3245
Macromolecular Pool Fraction (MPF) Maps in Minimal Scan Time Using a Modified Fast SPGR Sequence and a Calibrated Synthetic MT Reference Image1CAMH, Toronto, ON, Canada, 2King's College, London, United Kingdom
Synopsis
MPF has been shown to correlate with myelin. Recent advances have reduced the required acquisitions to two: with (MTΔ) and without (MT0) the MT pulse. These, along with B1 and T1 maps, can be used to compute MPF. Scan time can be minimized by synthesizing MT0 from the T1 and B1 maps required for MPF mapping thus obviating the need to acquire MT0. Here we present advances that allow for MPF mapping in a minimal scan time (about 10 min) . These include optimizing B1 and T1 mapping implementations with calibration procedures to ensure accuracy and modifying an accelerated MT-prepared sequence.
Introduction
The macromolecular pool fraction (MPF) has been shown to correlate with myelin1. MPF maps can be generated efficiently from T1, B1 and B0 maps and the collection of two additional volumes: a reference with no MT pulse (MT0) and an MT weighted volume (MTΔ) acquired at an optimal frequency offset, Δ2. Recently, further time efficiency was proposed by using the T1 and B1 maps used to make MPF, to create a synthetic MT0 , synMT0, thereby obviating the need to acquire MT03. In the original work, T1 maps were generated using a variable-flip-angle (VFA) method from two images, S1 and S2, that were acquired with the same sequence (spoiled-gradient echo, SPGR) and resolution as MTΔ. Due to the restrictions on TR for MT-prepared scans (due to SAR limitations), matching scans across MTΔ and T1 mapping acquisitions is not optimal.Last year, it was shown that it is possible to use a calibrated T1 mapping method based on a different sequence, fastSPGR (FSPGR), with a shortened RF pulse and in-plane SENSE-like acceleration, to create synMT04. In such a case, a calibration procedure is required to account for differences in multiplicative terms across sequences (involving improper spoiling and signal scaling). It was shown that the calibration is not subject-dependent and thus the scaling factor, f, can be determined a priori and applied on subsequent synMT0. Thus far, no effort has made to optimize the timing of the T1 mapping scans for purposes of MPF mapping. Also, MTΔ were acquired using the SPGR sequence which does not allow for in-plane accelerations so optimized scan time and resolution for MPF mapping was limited. Furthermore, discrepancies in bandwidth across sequences led to inaccuracies in synMPF in regions of large susceptibility gradients (Δχ).
In this work, we optimize T1 mapping acquisitions to reduce scan time for synMT0 generation. We also reduce MTΔ scan time by modifying the FSPGR sequence to allow for the insertion of MT pulses by extending the allowable TR such that SAR limitations are respected. This results in more accurate synMPF maps being generated in half the amount of time as last year (10:30 vs 20 min) and at higher resolution (1.3 vs 1.6 mm isotropic).
Method
Simulations were run to study the effect of T1 and B1 inaccuracies on MPF maps computed using the acquired MT0 (acqMPF) and calibrated synMT0 (synMPF). The errors in B1 and T1 maps are expected to propagate differently for synMPF and acqMPF since B1 and T1 values are used to compute synMT0 and MPF.Scan time for synMPF mapping is minimized by acquiring lower resolution T1 maps along with a very efficient 2D-B1 mapping implementation of the double-angle method (DAM)5 made possible by advances in B1 mapping calibrations6 (unpublished, submitted). The modified FSPGR sequence with an in-plane acceleration factor of two allows for a large reduction in scan time for MTΔ (from 8 to 5 min).
Four volunteers (37±10yrs) were scanned on a 3T scanner (GE Healthcare) according to the institutional REB. MT0 and MTΔ were acquired using the modified FSPGR sequence, calibrated B1 and T1 maps were obtained using calibrated DAM6 and VFA7 methods, respectively. Table 1 shows scanning parameters and times. Image processing was done using FSL (FMRIB software library) and MATLAB. The scaling factor for synMT0 calibration was found as per Ref.4 for each subject, then averaged to yield the scaling factor applied to all synMT0. MPF maps were computed using MT0 and f· synMT0, yielding acqMPF and synMPF, respectively.
Results & Discussion
The error propagaion graphs for WM MPF and GM MPF values are shown in Fig.2. Graphs 1 & 2 show that B1 errors lead to more severe discrepancies in synMPF and acqMPF errors than T1 errors. In WM, synMPF is less sensitive to T1 errors than acqMPR indicating some compensation of T1 bias. In all cases, the errors are more pronounced for GM values than WM values.Sample images for the synMT0 calibration procedure are given in Fig.3 A & B. In most regions, the ratio, R=synMT0/MT0 is constant as shown by the nicely peaked whole brain histogram of R values; the mode determines the scaling factor: f=(1/R). Results are similar across subjects (see Fig.3C).
Fig.4 shows examples of acqMPF and synMPF for two subjects along with sample WM/GM masks. Whole brain histograms of WM and GM MPF are shown in Fig.4B and (AVE(STD)) values are given in Fig.4C. In all cases, synMPF is well-matched to acqMPF in WM (overlapping histograms and <3% difference) but in GM, synMPF is biased towards an overestimation relative to acqMPF (shifted histograms and larger % differences). This can be explained due to (i) the smaller GM MPF values (causing an increase in % differences) and (ii) error propagation simulations show that small errors in B1 or T1 can lead to larger acqMPF and synMPF error discrepancies in regions of GM T1 and MPF values.
Conclusion
We showed that the proposed optimized MPF acquisitions yield very fast synMPF estimates. Results for synMPF are very well matched to acqMPF in WM and slightly overestimate GM-acqMPF. Matching sequences for MTΔ and synMT0 improved synMPF estimates in regions of large Δχ , compared to last year.Acknowledgements
We acknowledge the support of the Natural Sciences and Engineering Research Council of Canada (NSERC).References
- Khodanovich MY, Sorokina IV, Glazacheva VY, Akulov AE, Nemirovich-Danchenko NM, Romashchenko AV, Tolstikova TG, Mustafina LR, Yarnykh VL. Histological validation of fast macromolecular proton fraction mapping as a quantitative myelin imaging method in the cuprizone demyelination model. Scientific reports 2017;7:46686.
- Yarnykh VL. Fast macromolecular proton fraction mapping from a single off‐resonance magnetization transfer measurement. Magn Reson Med 2011.
- Yarnykh VL. Time‐efficient, high‐resolution, whole brain three‐dimensional macromolecular proton fraction mapping. Magn Reson Med 2016;75(5):2100-2106.
- Chavez S, Desmond KL. Producing a Synthetic Magnetization Transfer Reference Volume with T1 Maps Acquired using a Different Pulse Sequence: Practical Considerations. 2019; Montreal, Quebec, Canada. p 4001.
- Samson RS, Wheeler-Kingshott CAM, Symms MR, Tozer DJ, Tofts PS. A simple correction for B-1 field errors in magnetization transfer ratio measurements. Magnetic Resonance Imaging 2006;24(3):255-263.
- Chavez S. Assessing B1 map errors in vivo: measuring stability and absolute accuracy despite the lack of gold standard. 2018; Paris, France. p 2269.
- Chavez S. Calibrating variable flip angle (VFA)-based T1 maps: when and why a simple scaling factor is justified. 2018; Paris, France.
Figures
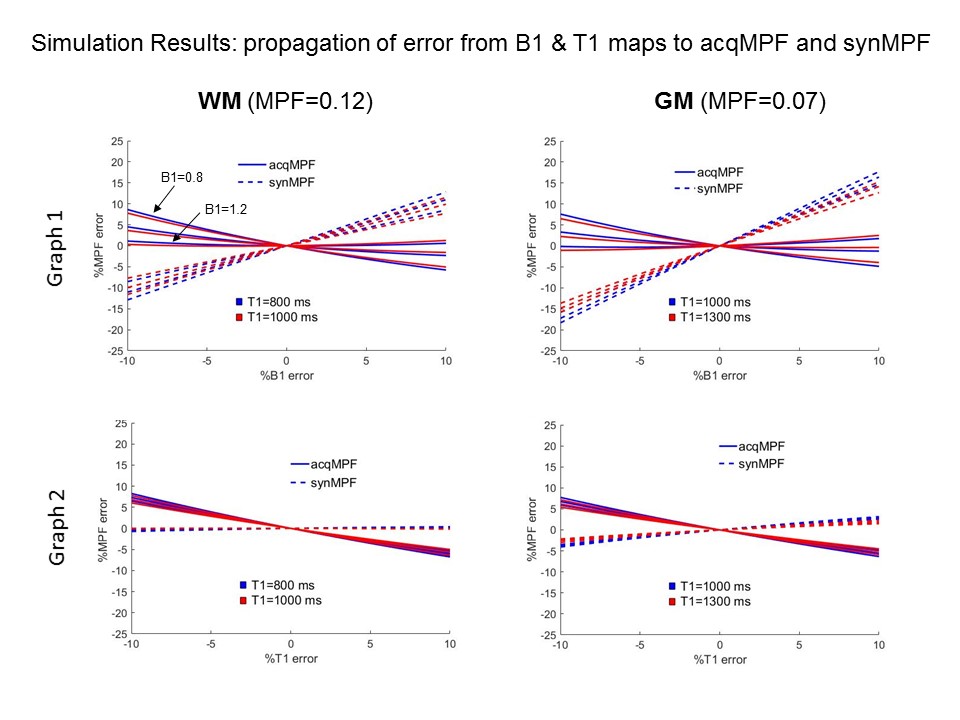
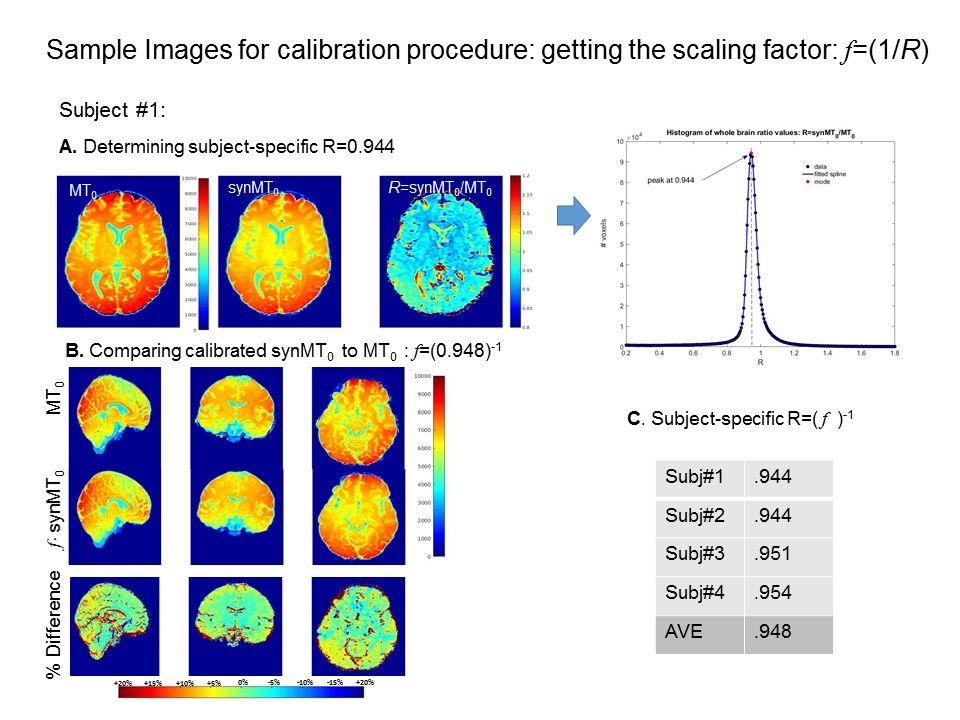
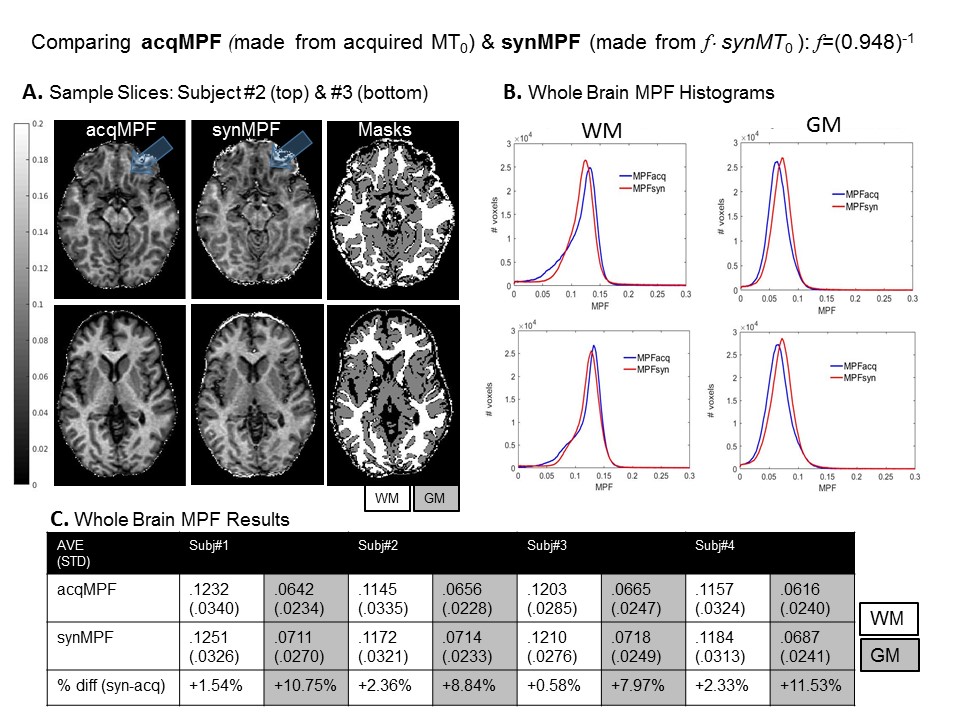
Fig.4 Assessing the Accuracy of synMPF Maps. Images were processed using tools from FSL (FMRIB software library): FLIRT for co-registrations, FAST for image segmentation and BET for brain extraction. A. shows how similar MPF maps look, even in regions of large Δχ (blue arrows). WM and GM acqMPF and synMPF values were obtained and histograms were plotted in B. C compares the average whole brain acqMPF and synMPF values in WM and GM in all subjects. B & C show that WM-MPF values were in close agreement and GM-MPF values were overestimated in synMPF relative to acqMPF.
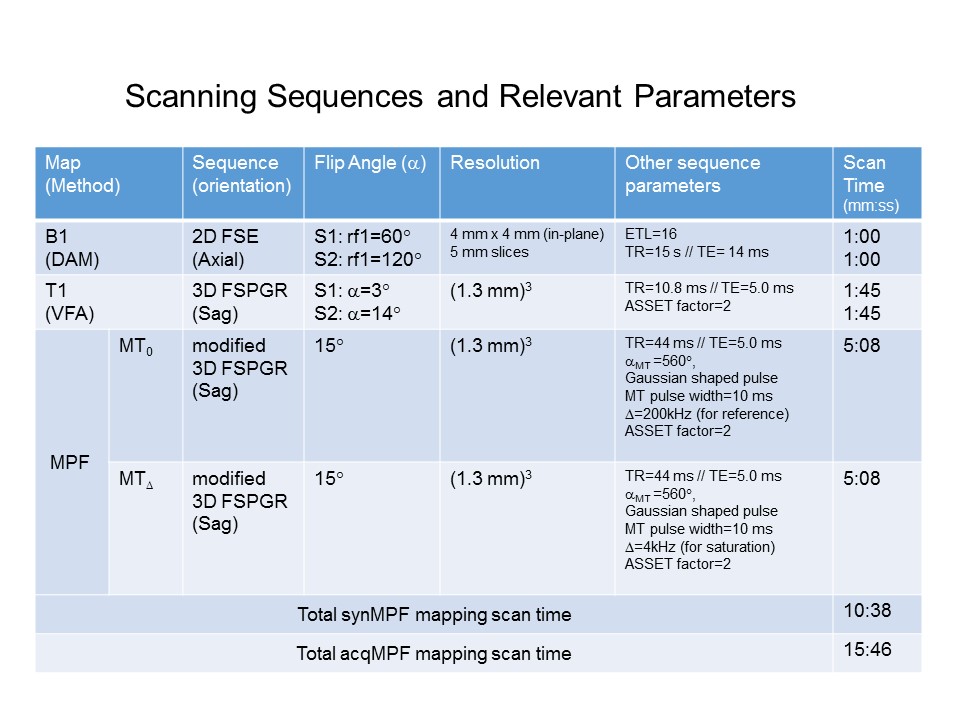
Table 1. Scanning Parameters and Timing for all Acquisitions. No B0 mapping was performed here since B0 had very little effect on the MPF maps and moreover, we are only interested in differences in acqMPF and synMPF. Once the scaling factor, f, has been determined, synMPF maps can be obtained without the MT0 acquisition, resulting in a scan time saving of (15:46-10:38)/15:46= 32.5%.