3243
3D-FLAIR imaging with optimized scan parameters to visualize endolymphatic hydrops with intravenous gadolinium-based contrast media1Department of Radiology, Shandong Provincial ENT Hospital, Shandong Provincial ENT Hospital affiliated to Shandong University, Jinan, China, 2Department of Medical Service, Shandong Provincial ENT Hospital, Shandong Provincial ENT Hospital affiliated to Shandong University, Jinan, China, 3Shandong province Qianfoshan Hospital, Jinan, China, 4GE Healthcare, MR Research China, Beijing, China, 5Gong Ruozhen Innovation Studio, Shandong Medical Imaging Research Institute Affiliated to Shandong University, Jinan, China
Synopsis
We aimed to explore the optimal scan parameters of 3D-FLAIR technique in labyrinthine lymph imaging for patients with vertigo disease. With different scan times and scan baselines applied, the corresponding 3D-FLAIR images were systematically compared. We found that the optimal scan time was 6hours after intravenous administration of GBCM. Additionally, the optimal scan baseline, aiming to obtain the relative maximum areas of the saccule, utricle and lateral semicircular canal to be displayed at the same level, is about 10.74±2.24 degrees from the anterior skull base. Therefore, using these optimal parameters, an accurate determination of endolymphatic hydrops can be achieved.
Introduction
The histopathological change of inner-ear diseases such as Meniere’s disease or fluctuating-sensorineural-hearing-loss is endolymphatic hydrops (EH). Some previous studies have shown the feasibility of in vivo visualization of EH after intravenous injection of gadolinium-based contrast media (GBCM) by using three-dimensional fluid-attenuated-inversion-recovery (3D-FLAIR) imaging [1,2]. The optimal scan time reported was 4hours after the administration of GBCM at a single-dose (0.2ml/kg) [1]. Nowadays, double-dose injection has been however, more widely used in clinic. The corresponding optimal scan time remains unknown. On the other hand, an appropriate scan baseline plays an important role in EH imaging, which can provide the relative maximum areas of the saccule, utricle and lateral semicircular canal at the same level. Currently, the optimal scan baseline has not been reported. Therefore, the aim of this study was to explore the optimal imaging parameters of 3D-FLAIR in labyrinthine lymph imaging for patients with vertigo disease, including the optimal scan time and scan baseline.Materials and methods
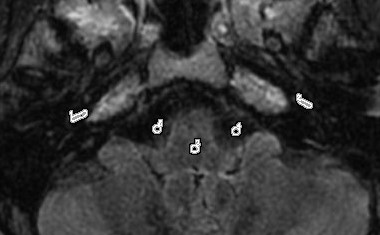
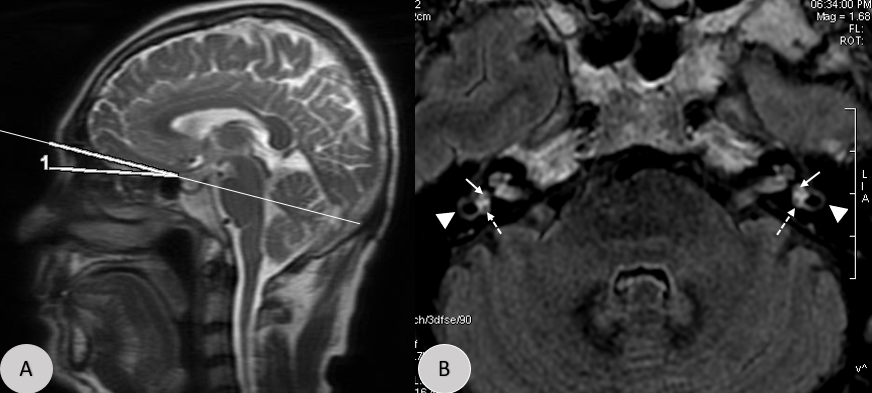
Subjects 22 patients (48±13 years old) with unilateral vertigo disease were recruited in this study, and underwent double-dose intravenous injection of gadobenate dimeglumine (0.4mL/kg). The corresponding 3D-FLAIR images were acquired four, six and eight hours after the agent injection. An extra image acquisition was implemented for eleven patients of them at 10 hours after agent injection. MR experiments All experiments were performed on a 3T clinical scanner (Discovery 750w, GE Healthcare, USA) equipped with an 8-channel phased-array coil. A 3D-FLAIR sequence was employed for labyrinthine lymph imaging with scan parameters of repetition time=9000ms; echo time=82.3ms; inversion time=2500ms; echo-train-length=140; bandwidth=71Khz; matrix size=256×256; NEX=2; slice thickness=1.6mm, and field-of-view=21cmx16cm. The scan time was 5 minutes 46 seconds. Data analysis All data were processed at a vendor-provided ADW 4.6 workstation (GE Medical Systems). To evaluate the contrast enhancement in the cochlear fluid quantitatively, regions of interest (ROI)s were separately set manually in the basal turn of the cochlea, brainstem and the cerebrospinal fluid area of the cerebellopontine angle on 3D-FLAIR images for all patients (Fig.1). The signal-intensity-ratio (SIR) was defined as the signal intensity of the basal turn divided by that of a circular reference ROI in the brainstem. Additionally, the signal intensities in the bilateral cochlear regions (i.e., with and without affection) were, respectively, evaluated using a defined CNR (contrast-to-noise-ratio) equation: CNR = ( SIcochlea - SIcerebrospinal fluid)/σbrainstem (Eq.1) , where SIcochlea represents the signal intensity of cochlea, SIcerebrospinal fluid is the signal intensity of the cerebrospinal fluid area, and σbrainstem is the standard deviation of the signal intensity of the brainstem. To obtain the optimal scan baseline, the anterior skull base was used as the baseline in sagittal position (zero degree). The 3D-FLAIR images of 22 patients were reconstructed so that the relative maximum areas of the saccule, utricle and lateral semicircular canal can be displayed at the same level. Two senior radiologists recorded the angles with the anterior skull base in the sagittal position, respectively. The SIR and CNR values were systematically compared between images acquired at different post-injection time using a Student’s t-test in SPSS 20.0 (IBM, Chicago, IL). The Student’s t-test was also applied to estimate the difference of the relative maximum areas of the saccule, utricle and lateral semicircular canal by comparing different scan degrees. The significance threshold was set as P=0.05.Results
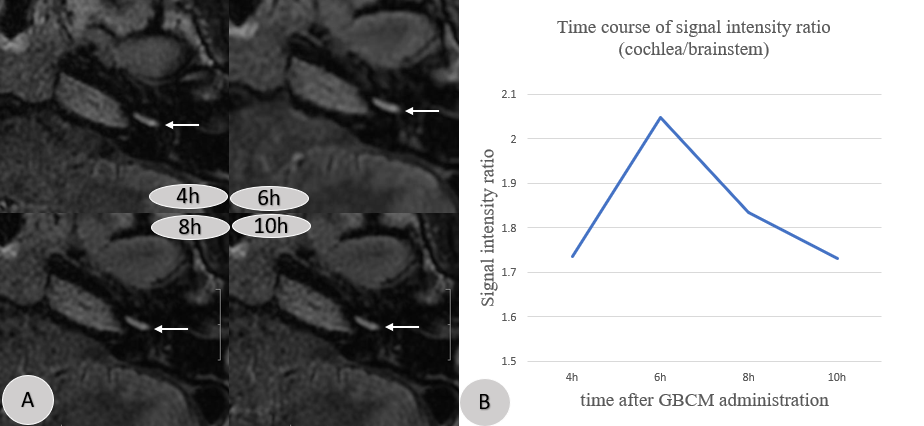
With double-dose injection, the 3D-FLAIR images acquired at 6 hours post-injection had the strongest image contrast in the cochlea of 44 ears for twenty-two patients (Fig.2). The SIR and CNR values were separately found in the cochlea of the affected 22 ears 4 hrs, 6 hrs, 8 hrs and 10 hrs after agent injection (mean SIR: 1.85±0.76, 2.05±0.72, 1.79±0.60, 1.65±0.56; mean CNR:14.77±6.44, 18.63±7.54, 13.17±6.94, 13.00±8.05; Table1). For unaffected 22 ears, they were 1.59±0.28, 1.97±0.68, 1.57±0.31, 1.45±0.32, and 12.20±3.88, 15.42±4.58, 10.61±3.87, 9.96±3.65, respectively (Table 1). Comparing the SIR and CNR values between 4 hours and 6 hours, and between 6 hours and 8 hours, respectively, significantly higher values were shown at 6 hours in both the affected and unaffected ears (P <0.05). The optimal angles with the anterior skull base in the sagittal position range from 6.20 to13.6 degrees (mean:10.74±2.24 degrees). The obtained mean level of 10.74 degree can be considered the optimal scan baseline from the anterior skull base (P<0.01;Fig.3).Discussion and conclusion
In this study, the optimal scan time was found at 6 hours after injecting the contrast agent at double-dose as more used in clinic, while 4 hours was reported with a single-dose injection previously [3]. Additionally, we obtained the optimal scan baseline of about 10.74±2.24 degrees from the anterior skull base. With this, the relative maximum areas of the saccule, utricle and lateral semicircular canal can be displayed at the same level. As the bilateral semicircular canals are fully visible at the same level, we can visualize the saccule and utricle simultaneously, and judge whether utricular protrusion is into the lateral semicircular canal. These findings can help us to accurately determine EH. In conclusion, based on the optimal scan time and scan baseline obtained, we can accurately estimate the EH on 3D-FLAIR imaging.Acknowledgements
No acknowledgement found.References
[1] Nakashima T, Naganawa S, Teranishis M, et al. Endolymphatic hydrops revealed by intravenous gadolinium injection in patients with Ménière’s disease. Acta Oto-Laryngologica. 2010; 130: 338–343.
[2] Naganawa S, Yamazaki M, Kawai H, et al. Visualization of endolymphatic hydrops in Ménière’s disease with single-dose intravenous gadolinium-based contrast media using heavily T2-weighted 3D-FLAIR. Magn Reson Med Sci. 2010;9:237-242.
[3] Naganawa S, Komada T, Fukatsu H, et al. Observation of contrast enhancement in the cochlear fluid space of healthy subjects using a 3D-FLAIR sequence at 3 Tesla. Eur Radiol 2006;16:733–7.
Figures