3242
Magic Sandwich to Stimulated Echo Relative change to identify sign and intensity of dipolar interaction in anisotropic tissue1Univ Lyon, INSA‐Lyon, Université Claude Bernard Lyon 1, UJM-Saint Etienne, CNRS, Inserm, CREATIS UMR 5220, U1206, F‐69616, LYON, France, 2CPE, VILLEURBANNE, France
Synopsis
Among the MR techniques playing on dipolar interaction (Hd), the magic sandwich echo sequence (MSE) is very seldom used in biological application. So far, the magic echo has been compared to the spin echo. However, MSE is closer to a stimulated echo thus a Magic Sandwich to Stimulated echo relative change (MaSteR) is of interest to study. The MaSteR evolution with spin-lock intensity increase was studied for thawed tendon for different orientations within B0 to modulate the dipolar interaction. We show that MaSteR is correlated to dipolar interaction, sample composition and its evolution with orientation is sensitive to Hd sign.
Introduction
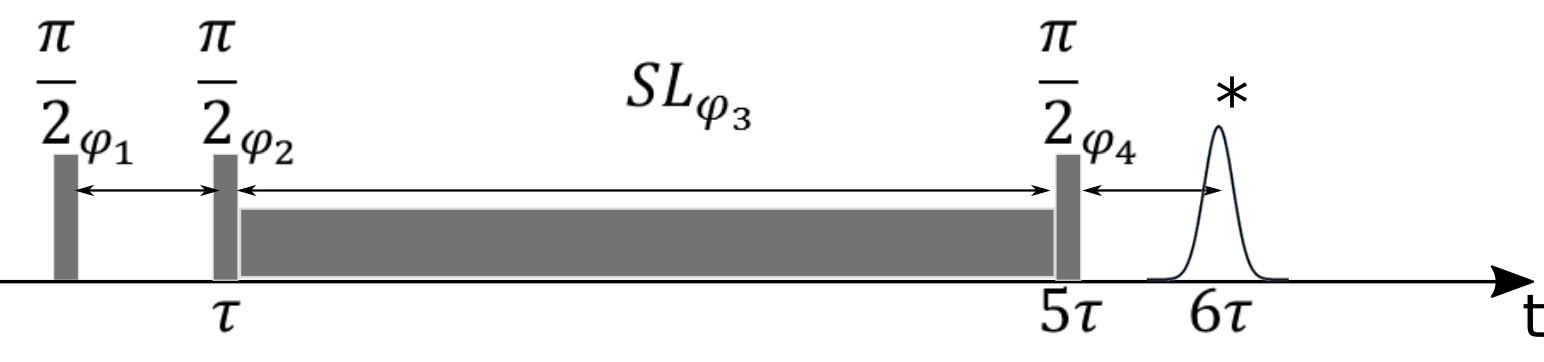
Among the sequences (1–3) giving access to dipolar interaction (Hd) in tissue and providing quantitative parameters related to the sample macromolecular contents, the magic sandwich echo (MSE) (4-7) is underused on biological tissue. This sequence contains a spin-lock, which modulates Hd in the double rotary frame according to Redfield’s theory (4). MSE has been compared to spin echo (5, 6) to measure an enhancement of SNR associated to dipolar interaction cancellation. Nevertheless, the sequence architecture of MSE without spin-lock RF pulse (fig.1) is closer to the stimulated echo sequence (STE) proposed by Frahm et al. (7). We introduce here the Magic sandwich to Stimulated echo signal Relative change MaSteR to provide quantitative information about the dipolar interaction in tissue. In addition, we highlight, using a non-localized spectroscopic magic sandwich echo sequence, that the behavior of this ratio as a function of the spin-lock intensity is sensitive to Hd sign.Methods
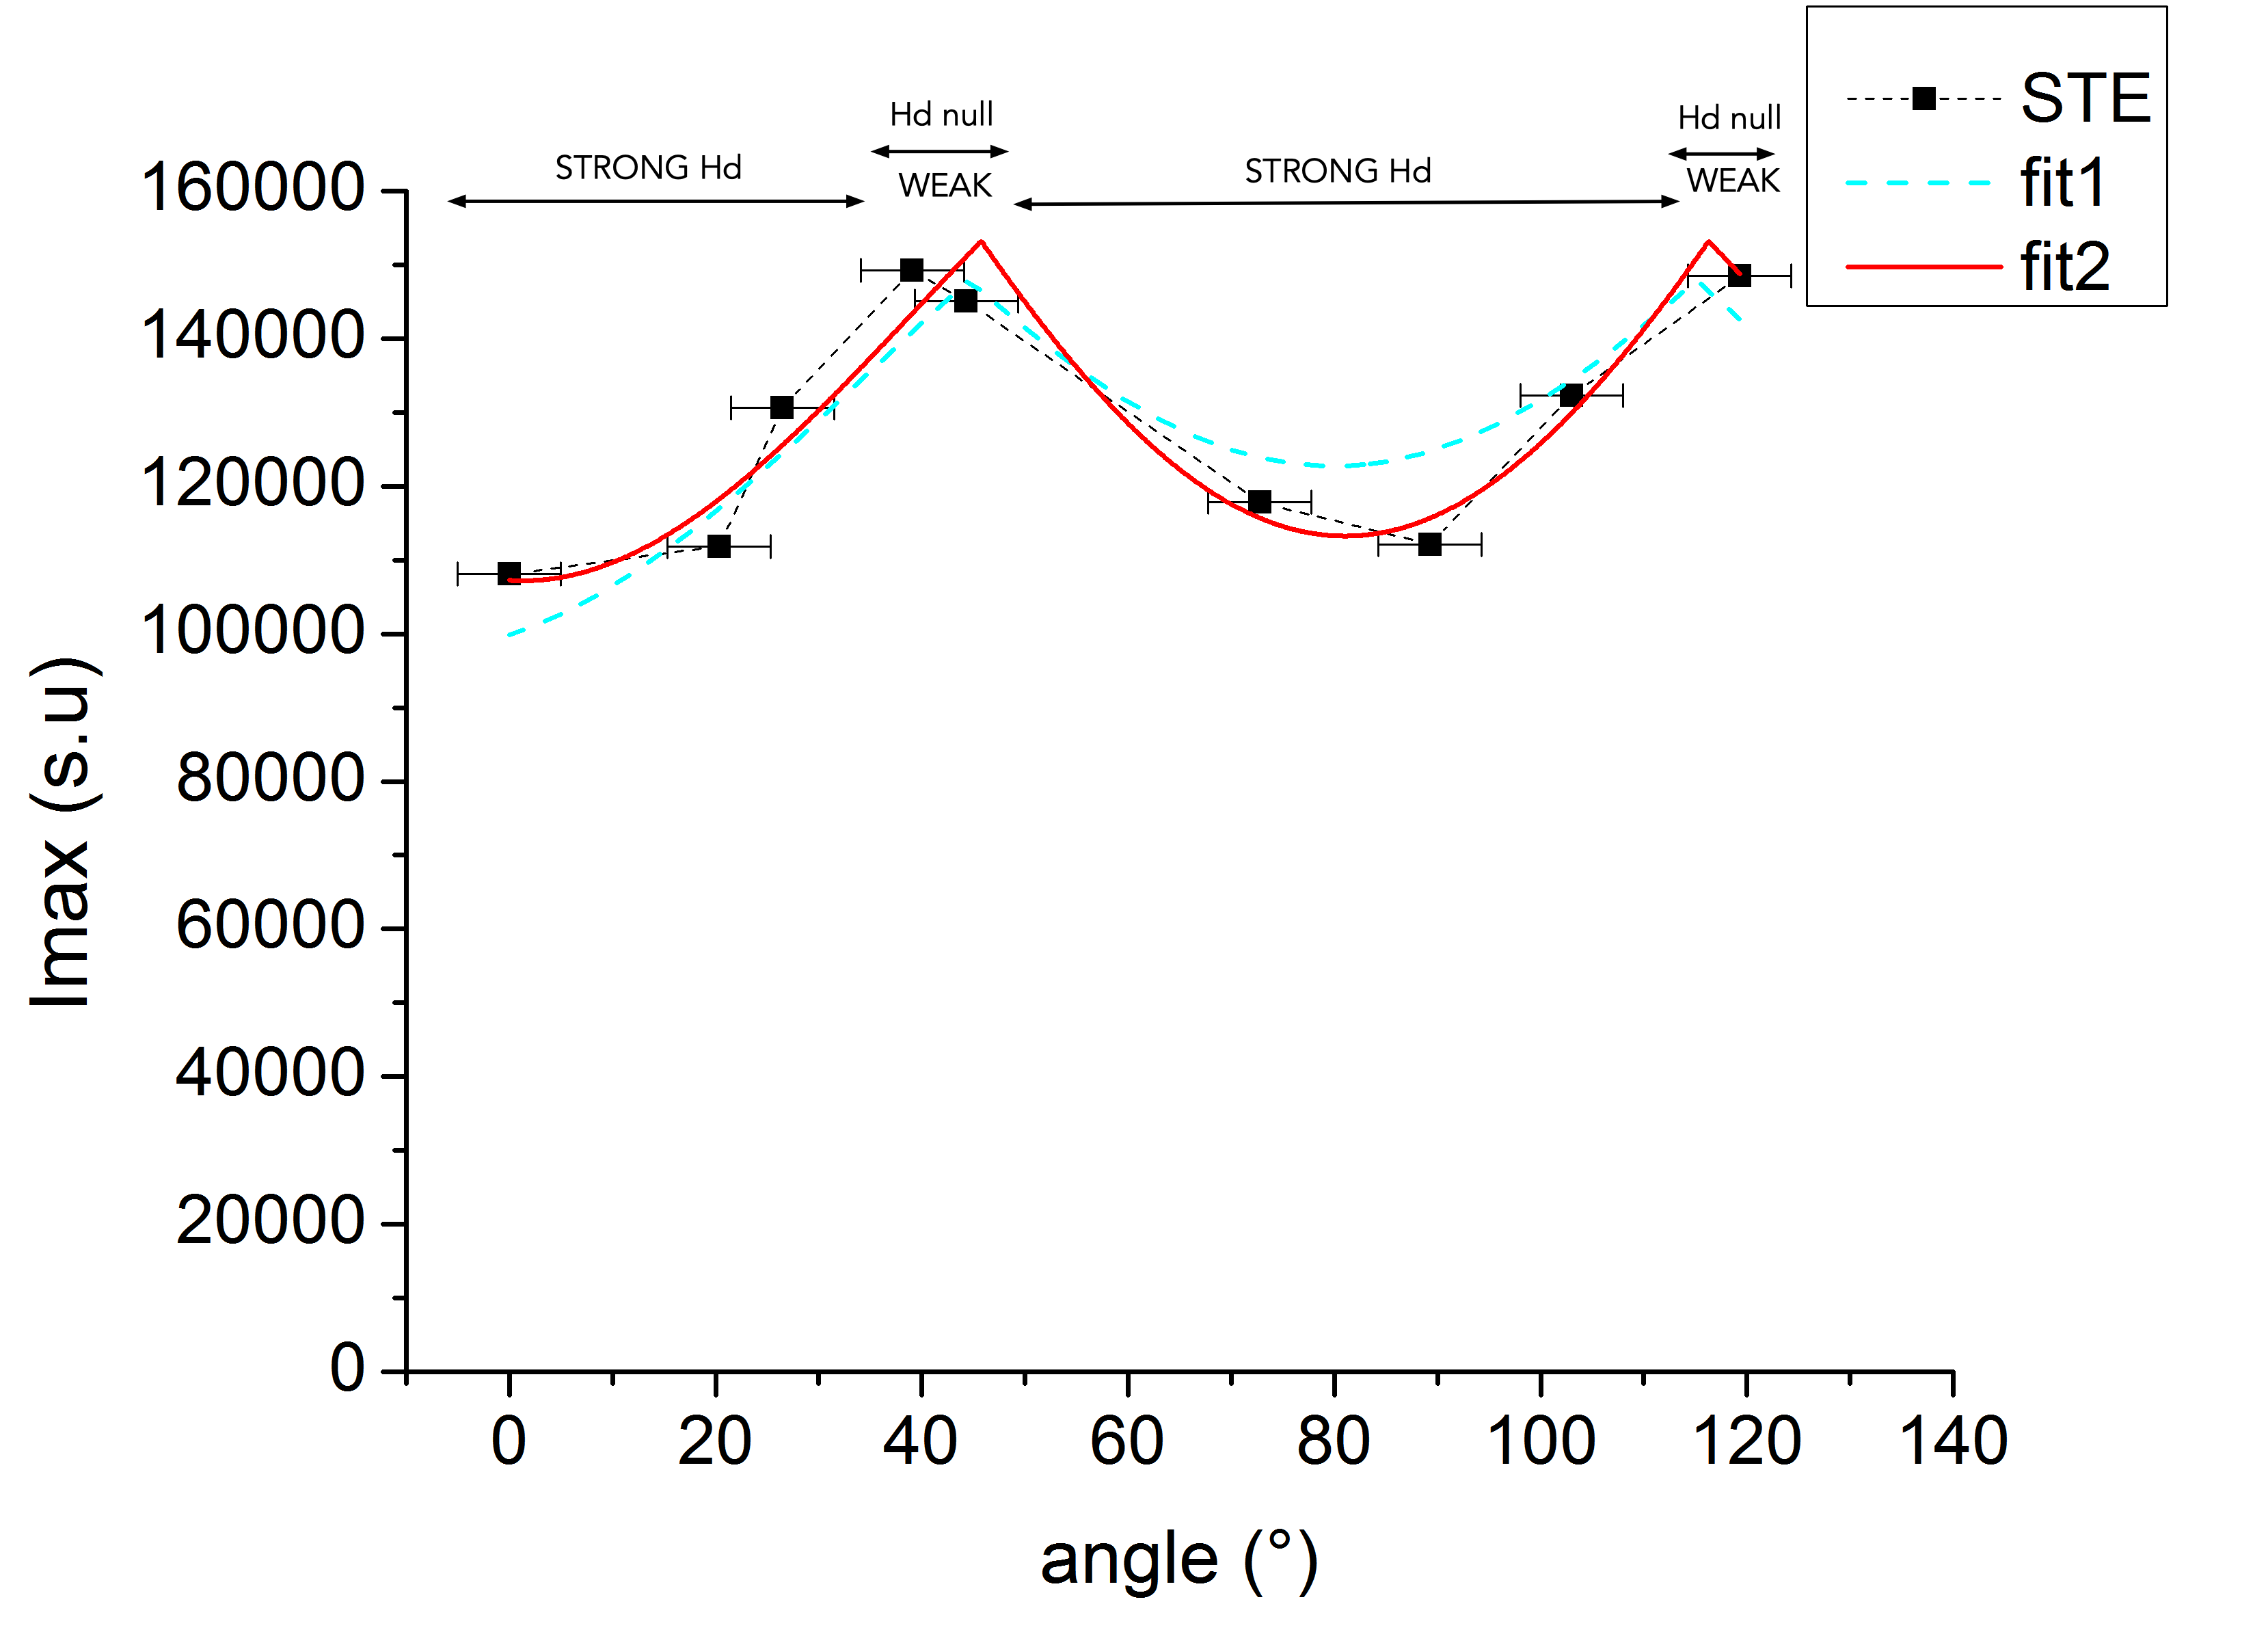
Samples consisted of two frozen beef tendons from butcher and thawed in water at room temperature during at least 2 hours. Acquisitions were performed on a 4.7 T Bruker system with a non-localized spectroscopic MSE (fig.1) with 6τ = 35 ms. To modify the Hd effect, samples were rotated with respect to B0, resulting in nine positions starting with fibers aligned with B0. The spin-lock RF pulse shape was a binomial 1 $$$(1 \overline{1})$$$, with a constant amplitude and a phase inversion. Ten different spin-lock RF pulse intensity values (B1sl) were taken between 0 and 162 μT (corresponding to the coil power limitation) for each sample orientation. The angles were retrospectively evaluated from measures on gradient echo image. The results on both samples are close, such that only one is presented. The STE amplitudes (B1sl = 0) plotted as a function of angle are first fitted by an expression containing only the dipolar interaction, where Hd is considered as a little perturbation responsible of signal decrease, and then the contribution of susceptibility is added in a second step. Susceptibility is modelled as a square function centered on 90° derived from home numerical simulations in accordance with cylindrical model described by Haacke et al.(8). The signal analysis consisted in following the MaSteR given by: $$$MaSteR = \frac{I_{MSE}-I_{STE}}{I_{STE}}$$$, according to B1sl and fiber orientation, where ISTE was the maximum intensity of stimulated echo (when B1sl = 0). The averaged on the five higher values of B1sl of the MaSteR is monitored to discriminate different Hd intensity according to the angle. Finally, a transition point defined experimentally can be identified when the MaSteR reaches its minimum and its behavior can be viewed for different orientation.Results and Discussion
STE is principally modulated by dipolar interaction in our protocol:From fig.2 it is shown that the rotation of the sample with respect to B0 modulates the stimulated echo amplitude up to 25 %. The results of the fit using an empirical parametric model described on legend table (fig.3) shows that dipolar interaction accounts for most of signal modulation compared to susceptibility. Measures of ISTE for different orientations enables to distinguish different groups related to both Hd conditions: the strong Hd around 0 ± 5° and 89 ± 5°, the weak Hd for 44 ± 5° and 119 ± 5°.
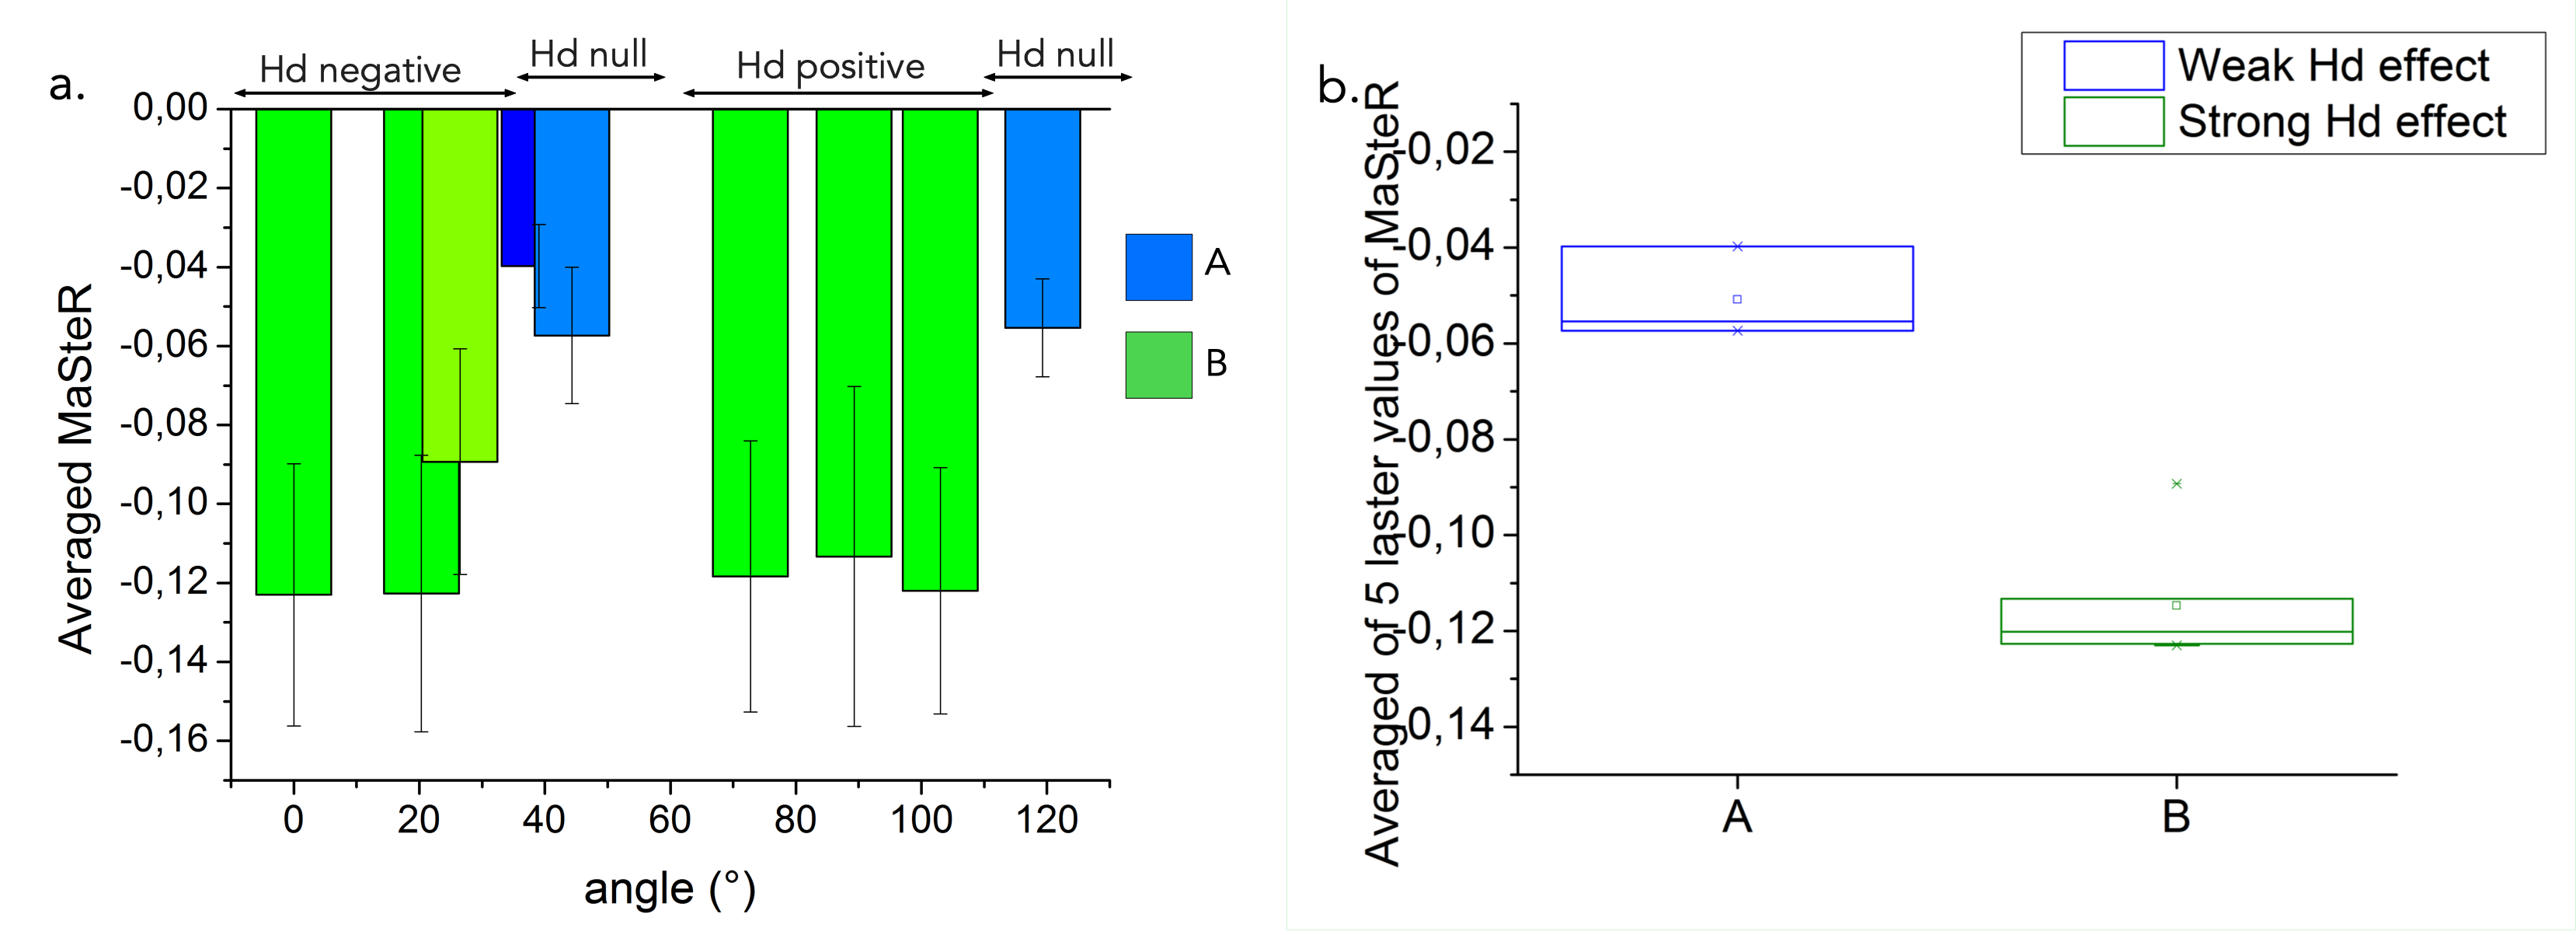
Averaged value of 5 MasteR as function of B1sl to discriminate different Hd:
The strong and weak dipolar interaction (A and B on fig.4) can easily be distinguished just by averaging the last 5 MaSteR values (above 22 μT). The average value provides information on Hd intensity. When the modulus of the average is low the Hd is weak, and inversely with strong Hd.
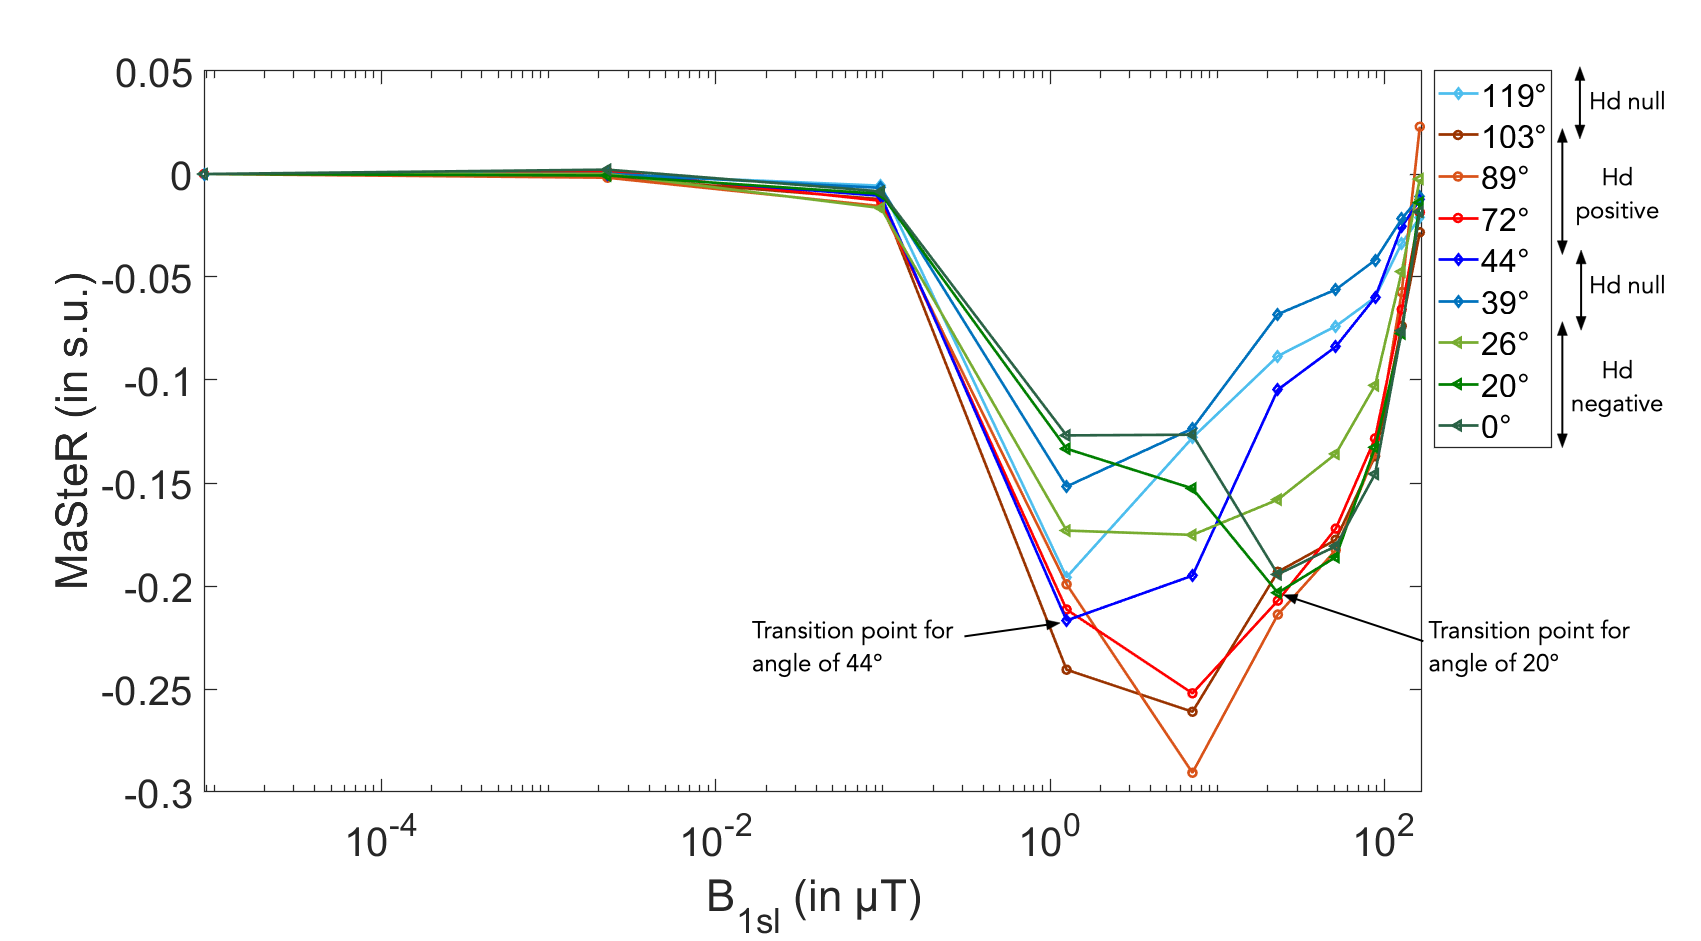
MaSteR behavior of the transition point to discriminate Hd sign with respect to B0:
When the dipolar interaction effect is low, close to the magic angle (54°) (diamond on fig.5), the B1sl of the transition point is around 1.26 μT. In accordance with the dipolar interaction expression ($$$\frac{1-3 cos^2(\theta)}{2 r^3}$$$), we observed differences between the negative Hd (triangle on fig.5) and the positive Hd (circle). When Hd is negative, the transition point appears for a higher value of B1sl (23.03 μT) than the one for positive dipolar interaction (7.10 μT). Consequently, the MaSteR acquired with only few adequate values of B1sl dependent on material (0, 5, 10, 22, 50, 100, 162 μT for example on thawed tendon) can provide valuable information on Hd intensity (see paragraph above) and Hd sign and by inference on the fiber averaged orientations. With a short echo time, this method provides a coarser result than diffusion tensor imaging (9) but invoking different physical phenomenon and do not need T2 measures like in DAFI technics (10). The future would be to develop an imaging version of this sequence for biomedical application.
Conclusion
Measures with the MSE sequence and using the MaSteR for the analysis can provide additional information on the sample architecture with respect to other imaging technics. The MaSteR variations with increasing B1sl gives new perspectives for MSE-based imaging sequence and their usefulness in the diagnosis of pathologies resulting in fiber disorders, like arthritis and neurodegenerative diseases.Acknowledgements
This work was performed within the scope of LABEX PRIMES (ANR-11-LABX-0063). Experiments were performed on the PILoT facility, part of the France Life Imaging infrastructure (ANR-11-INBS-0006).References
1. Eliav U, Navon G. A Study of Dipolar Interactions and Dynamic Processes of Water Molecules in Tendon by1H and2H Homonuclear and Heteronuclear Multiple-Quantum-Filtered NMR Spectroscopy. J. Magn. Reson. 1999; 137:295–310.
2. Duhamel G, Prevost V, Varma G, Alsop DC, Girard O. Magnetization Transfer from Inhomogeneously Broadened Lines (ihMT): Effect of MT Asymmetry on the ihMT Signal. Milan,Italy: 22nd Annual Meeting of ISMRM, 2014
3. Michaeli S, Gröhn H, Gröhn O, et al. Exchange-influenced T2rho contrast in human brain images measured with adiabatic radio frequency pulses. Magn. Reson. Med. 2005; 53:823–829.
4. Redfield AG. Nuclear Magnetic Resonance Saturation and Rotary Saturation in Solids. Phys. Rev. 1955; 98:1787–1809.
5. Grenier D, Pascui O, Briguet A. Dipolar contrast for dense tissues imaging. J. Magn. Reson. 2000; 147:353–356.
6. Regatte RR, Schweitzer ME, Jerschow A, Reddy R. Magic sandwich echo relaxation mapping of anisotropic systems. Magn. Reson. Imaging. 2007; 25:433–438.
7. Frahm J, Merboldt KD, Hanicke W, Haase A. Stimulated echo imaging. J. Magn. Reson. (1969) 1985; 64:81–93.
8. Haacke EM, Brown RW, Thompson MR, Venkatesan R, others. Magnetic Resonance Imaging: Physical Principles and Sequence Design. Volume 82. Wiley-Liss New York; 1999; 751-753.
9. Heemskerk AM, Sinha TK, Wilson KJ, Ding Z, Damon BM. Quantitative assessment of DTI-based muscle fiber tracking and optimal tracking parameters. Magn. Reson. in Medicine. 2009; 61:467–472.
10. Szeverenyi NM, Bydder GM: Dipolar anisotropy fiber imaging in a goat knee meniscus. Mag.Res. in Medicine. 2011; 65:463–470.
Figures