3240
Accurate mapping of T2 relaxation times at low SNR, based on Bloch simulations and PCA image denoising1Bio-medical Engineering, Tel Aviv University, Tel Aviv, Israel, 2Sagol School of Neuroscience, Tel Aviv University, Tel Aviv, Israel, 3Center for Advanced Imaging Innovation and Research (CAI2R), New-York University Langone Medical Center, New York, NY, United States
Synopsis
Quantitative T2 mapping using Bloch simulations offers high mapping accuracy, albeit may suffer from reduced precision due to noisy data when operating at low SNR.
In this work we tested the utility of PCA-based complex image denoising for increasing T2 mapping precision. Mapping was done using the echo modulation curve algorithm. Denoising was tested on phantom and in vivo scans. Comparing T2 maps before and after PCA complex image denoising showed an increase in T2 precision with no apparent loss of spatial resolution.
Introduction
The echo modulation curve (EMC) algorithm allows highly accurate mapping of T2 values in vivo1,2. The algorithm is based on fitting experimental curves extracted from multi spin echo (MSE) protocols to a dictionary of curves generated using Bloch simulations3. Scans performed at low signal to noise ratios (SNR), e.g., using large matrix sizes, or thin slices, generate noisy data, which reduces T2 fitting accuracy. Principal component analysis (PCA) image denoising has been previously shown to reduce noise and increase accuracy and precision of bi-exponential T2 mapping4. In this work we tested the utility of PCA-based complex image denoising, for increasing T2 mapping precision at low SNR.Methods
Phantom ScansISMRM/NIST system phantom (HPD Inc.) was scanned 10 times using a standard MSE sequence on a 3T Siemens scanner. Each scan used a different combination of slice thickness and matrix size: slice thickness = 1 or 2 mm, matrix size = 100x100; 192x192; 256x256; 380x380; 512x512. Remaining scan parameters were: NEchoes=25; TE/TR=13/3000 ms; FOV = 160x160 mm2. No undersampling was applied.
In vivo Scans
Brain imaging was done using a standard MSE sequence on a 3T Siemens scanner. Scan parameters were: slice thickness=3 mm, matrix size=216x180, FOV=216x180 mm2, TE/TR=10/3000 ms, NEchoes=15, no undersampling was applied.
Data Analysis
PCA was applied on a sliding window over a set of complex images reconstructed from the images’ raw data. For each window, only a subset of principal components was kept, based on the distribution of the eigenvalues of the data covariance matrix. Detailed description of the PCA algorithm used in this study can be found at Does et al4 and Veraart et al5. Windows of 5x5 and 7x7 were tested. EMC fitting was done before, and after the denoising process, producing two sets of T2 maps. For the phantom T2 maps, T2 mean value, standard deviation (SD) and coefficient of variation (CV) were calculated for selected internal region of interests (ROIs) inside 7 spheres.
Results
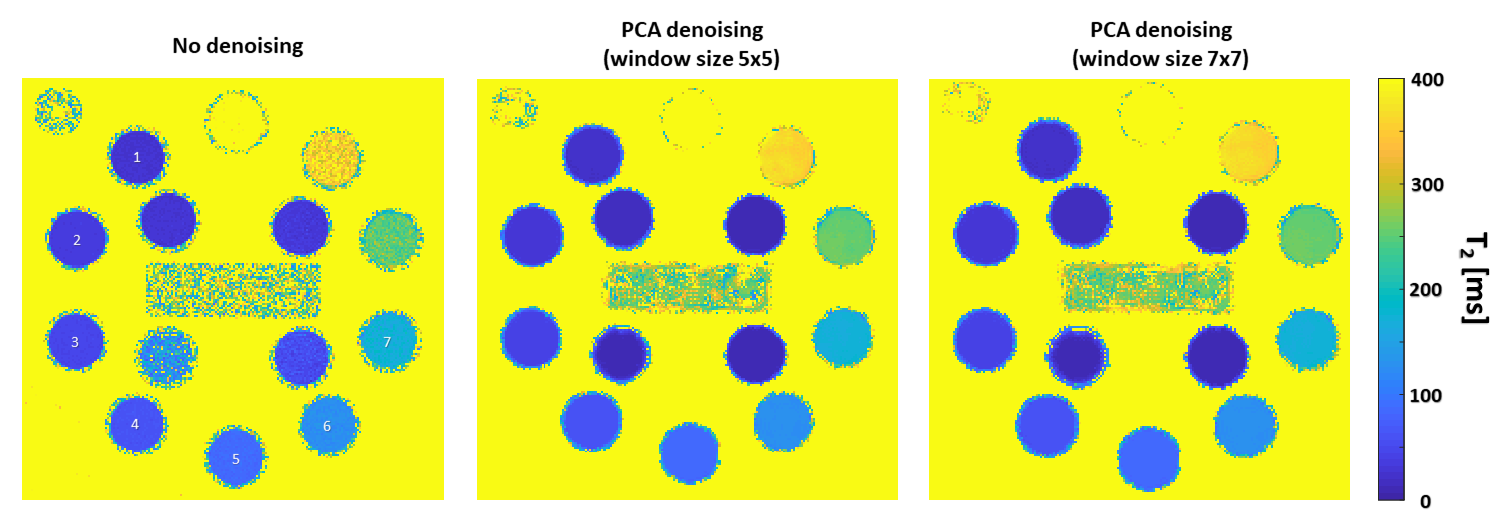
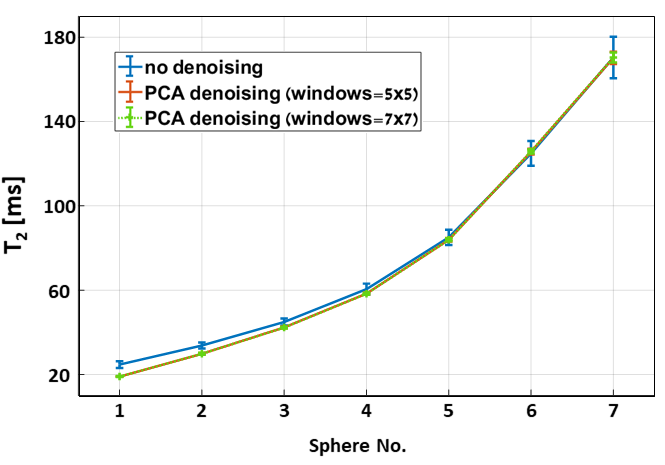
Figure 1 shows T2 maps of the HPD phantom, before and after applying PCA complex image denoising using a 5x5 and a 7x7 sliding window.Figure 2 describes T2 mean value, SD and CV for the seven marked spheres in the attached phantom image. A consistent decrease in both SD and CV appears in all 7 spheres when using PCA complex image denoising with either a 5x5 or a 7x7 window.
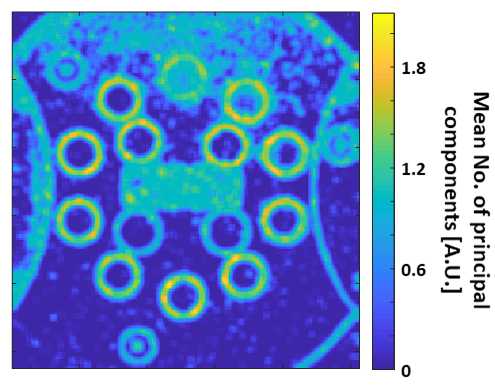
Figure 3 shows a P-map: the number of PCs found per each pixel, divided by the number of windows including that pixel (extracted from data of a single channel, out of a total of 20 receiver channels). We note that the number of principal components appears to increase in pixels located on edges.
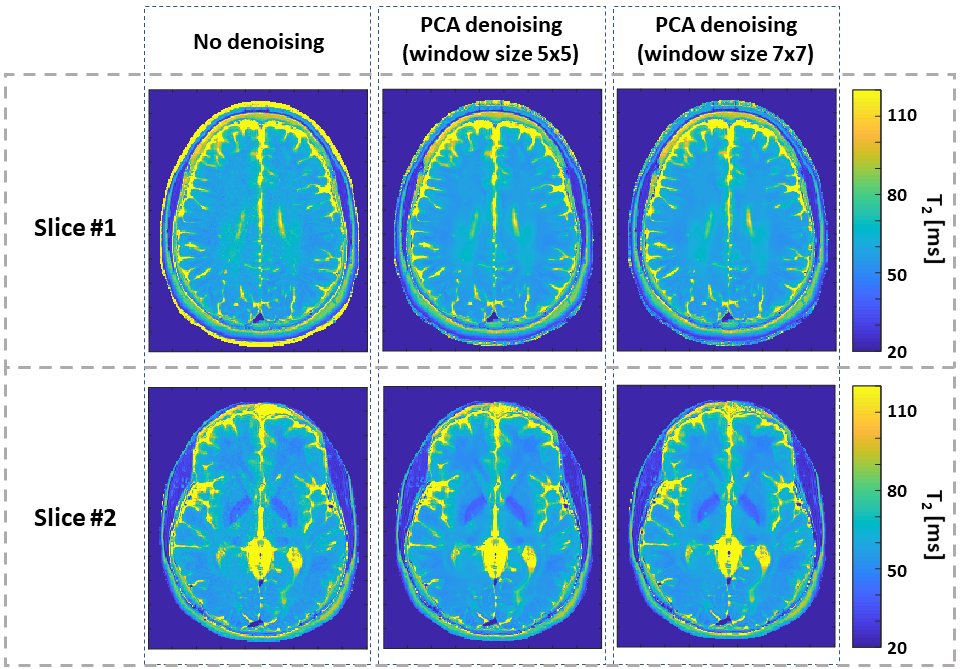
Figure 4 demonstrates the performance of the algorithm on in vivo brain scan, exemplifying the effectiveness of the denoising process. We note that no loss of spatial resolution is apparent in these images.
Discussion
T2 precision appears to increase in both phantom and in vivo scan after applying PCA complex image denoising. Results of in vivo scans show no significant loss of resolution or blurring of edges. The ability of the PCA complex image denoising to maintain high resolution can be explained by the selectivity of the principle components calculated per window according to its content.Acknowledgements
ISF Grant 2009/17References
1. Ben-Eliezer N, Sodickson DK, Shepherd T, Wiggins GC, Block KT. Accelerated and motion-robust in vivo T 2 mapping from radially undersampled data using bloch-simulation-based iterative reconstruction. Magn Reson Med. 2016;75(3):1346-1354.
2. Shepherd TM, Kirov II, Charlson E, et al. New rapid, accurate T 2 quantification detects pathology in normal-appearing brain regions of relapsing-remitting MS patients. NeuroImage Clin. 2017;14:363-370.
3. Ben-Eliezer N, Sodickson DK, Block KT. Rapid and accurate T2 mapping from multi-spin-echo data using bloch-simulation-based reconstruction. Magn Reson Med. 2015;73(2):809-817.
4. Does MD, Olesen JL, Harkins KD, et al. Evaluation of principal component analysis image denoising on multi-exponential MRI relaxometry. Magn Reson Med. 2019;81(6):3503-3514.
5. Veraart J, Novikov DS, Christiaens D, Ades-aron B, Sijbers J, Fieremans E. Denoising of diffusion MRI using random matrix theory. Neuroimage. 2016;142:394-406.
Figures