3239
In Vivo Myelin Quantification by T1w/T2w: Its Relationship with Other MRI Quantifiers of Myelin and Specificity
Hiroyuki Hamaguchi1, Nina Patzke2, Yuta Urushibata3, Xinnan Li1, Isabel Fernandez2, and Khin Khin Tha4,5
1Department of Biomarker Imaging Science, Hokkaido University Graduate School of Biomedical Science and Engineering, Sapporo, Japan, 2Department of Biological Sciences, Faculty of Science, Hokkaido University, Sapporo, Japan, 3Siemens Healthineers, Tokyo, Japan, 4Department of Diagnostic and Interventional Radiology, Hokkaido University Hospital, Sapporo, Japan, 5Global Station for Quantum Medical Science and Engineering, Hokkaido University, Sapporo, Japan
1Department of Biomarker Imaging Science, Hokkaido University Graduate School of Biomedical Science and Engineering, Sapporo, Japan, 2Department of Biological Sciences, Faculty of Science, Hokkaido University, Sapporo, Japan, 3Siemens Healthineers, Tokyo, Japan, 4Department of Diagnostic and Interventional Radiology, Hokkaido University Hospital, Sapporo, Japan, 5Global Station for Quantum Medical Science and Engineering, Hokkaido University, Sapporo, Japan
Synopsis
The division of T1-weighted image by T2-weighted image (T1w/T2w) has recently been introduced as a myelin quantifier, which gained attention due to the ease of obtaining images. However, controversy exists about its performance. The aim of this study was to test the correlation of T1w/T2w with other MRI quantifiers of myelin, so as to determine its performance. Moderate to strong correlation of T1w/T2w with the other quantifiers was observed. T1w/T2w appears to be sensitive to detect an abnormality, but is not specific for myelin.
Introduction
Myelin is an essential structure of the central nervous system that wraps around axons to promote neurotransmission1. It is composed of 70-85% lipid and 15-30% protein and is an electrical insulator2. Myelin integrity is modified in various diseases such as tumors and demyelinating diseases so that evaluation of its integrity is important3. Several MRI sequences and indices derived from them have been developed to non-invasively quantify myelin, some of which are available for application in clinics. Of these, myelin water fraction (MWF) extracted from gradient and spin-echo (GRASE) sequence4, magnetic transfer ratio (MTR) extracted from magnetization transfer imaging (MTI)5 and fractional anisotropy (FA) extracted from diffusion tensor imaging (DTI)6, are commonly known. Their performance in myelin quantification has also been reported as satisfactory4-6. Recently, the division of T1-weighted image by T2-weighted image (T1w/T2w) has been added as a myelin quantifier, which gained attention due to the ease of obtaining images. However, controversy exists about its performance.The aim of this study was to test the correlation of T1w/T2w with other MRI quantifiers of myelin, so as to determine its performance.
Methods
This study was conducted in two parts:Part I: In this study, the correlation of T1w/T1w with MRI indices known as capable to quantify myelin was tested. Five animal brain specimens (a deer, a seal, and 3 sea lion brains), fixated in 4% paraformaldehyde and dissolved in 0.1M phosphate buffer saline and 0.1% sodium azide, were scanned by using two 3T MRI scanners. Magnetization prepared rapid gradient echo (MPRAGE) and T2-sampling perfection with application-optimized contrast using different flip angle evolution (T2-SPACE), GRASE, MTI, DTI, magnetization prepared 2 rapid acquisition gradient echoes (MP2RAGE), Carr Purcell Meiboom Gill (CPMG) for T2 relaxation time (T2), and 3D steady gradient echo (3D-GRE) for the spin-lattice relaxation time in the rotating frame (T1ρ) were acquired to extract T1w/T2w, MTR, FA and MD, T1 relaxation time (T1), T2, and T1ρ, respectively. The representative maps of the deer brain are given in Figure 1. White matter was then segmented into 10 regions-of-interest (ROIs) based on the T1w/T2w value (Figure 2). The values corresponding to each ROI were then extracted from the other indices. Correlation of T1w/T2w with these indices was tested for each ROI, by using Spearman’s rank-order correlation analyses. P<0.01 was considered statistically significant (JMP Pro 14, SAS, Japan).
Part II: To test the sensitivity and specificity of T1w/T2w in quantifying myelin, T1w/T2w maps were reconstructed in the patients with biopsy-confirmed demyelinating (N=3) and non-demyelinating (i.e., gliosis, vasculitis) (N=3) lesions. Regional T1w/T2w were compared by using two-sample t-tests.
Results
Part I: Figure 3 summarizes the results of tests of correlation of T1w/T2w with the other MRI quantifiers of myelin. The degree of correlation varied from weak to strong. The strongest correlations were observed with MWF (r=0.767) and T1 (r=-0.744), moderate correlations with (r=0.545), FA (r=0.449), T2 (r=-0.441), and T1ρ (r=-0.470), and weak correlation with MD (r=-0.390). The correlation was linear for MTR and FA, but linear-plateau for the other indices. These observations were consistent across specimens.Part II: T1w/T2w did not vary between demyelinating and non-demyelinating lesions (P=0.3096) (Figure 4). Each set of representative images is given in Figure 5.
Discussion
Varying degree of correlation of T1w/T2w with the other indices suggests varying sensitivity of these indices in quantifying myelin or estimating neural architecture. MWF, which is the ratio of the area in the T2 distribution arising from myelin water, is believed to accurately reflect differing regional myelin concentration or density7. A strong positive correlation between T1w/T2w and MWF suggests that T1w/Tw2 is also highly reflective of myelin concentration. Failure to reach a perfect correlation (r≡1) may be due to the lower sensitivity of T1w/T2w in quantifying myelin. A strong negative correlation between T1w/T2w and T1 is thought to be related to their sensitivities to myelin, macromolecules and other polymer structures in the water environment8. Linear-plateau correlation between T1w/T2w and several indices including MWF was observed at areas with high T1w/T2w (i.e., >70%). Taken together with the linear correlation with MTR and the previous observations of the linear relationship between MWF and the other indices9, it is thought that T1w/T2w is also affected by factors other than myelin, as aforementioned.Failure to observe a difference in T1w/T2w between demyelinating and non-demyelinating lesions, together with a signal difference between the lesions and adjacent brain parenchyma, may imply that T1w/T2w is not specific for myelin but sensitive to detect an abnormality.
Conclusions
The relationship of T1w/T2w with several MRI quantifiers of myelin available for application in clinics was tested. Although T1w/T2w appears to be sensitive to changes in myelin, these changes are not specific -- which demands caution in interpreting these values.Acknowledgements
We thank Drs. Jongho Lee and Tomoyuki Okuaki for kind provision of the MRI sequence and software.References
- Bunge, Richard P. Glial cells and the central myelin sheath. Physiological reviews, 1968, 48.1: 197-251. Yamauchi, J. Journal of Japanese Biochemical Society 88.6 (2016): 687.2.
- Clarke, DD. Circulation and energy metabolism of the brain. Basic neurochemistry: Molecular, cellular, and medical aspects, 1999.3.
- Alexander, J. S., Zivadinov, R., Maghzi, A. H., Ganta, V. C., Harris, M. K., & Minagar, A. Multiple sclerosis and cerebral endothelial dysfunction: Mechanisms. Pathophysiology, 2011, 18.1: 3-12.4.
- Prasloski, T., Rauscher, A., MacKay, A. L., Hodgson, M., Vavasour, I. M., Laule, C., & Mädler, B. Rapid whole cerebrum myelin water imaging using a 3D GRASE sequence. Neuroimage, 2012, 63.1: 533-539.5.
- Van Buchem, M. A., Steens, S. C., Vrooman, H. A., Zwinderman, A. H., McGowan, J. C., Rassek, M., & Engelbrecht, V. Global estimation of myelination in the developing brain on the basis of magnetization transfer imaging: a preliminary study. American Journal of Neuroradiology, 2001, 22.4: 762-766.6.
- Chang, E. H., Argyelan, M., Aggarwal, M., Chandon, T. S. S., Karlsgodt, K. H., Mori, S., & Malhotra, A. K. The role of myelination in measures of white matter integrity: combination of diffusion tensor imaging and two-photon microscopy of CLARITY intact brains. Neuroimage, 2017, 147: 253-261.7.
- Warntjes, J. B. M., Persson, A., Berge, J., & Zech, W. Myelin detection using rapid quantitative MR imaging correlated to macroscopically registered luxol fast blue–stained brain specimens. American Journal of Neuroradiology, 2017, 38.6: 1096-1102.8.
- Shams, Z., Norris, D. G., & Marques, J. P. A comparison of in vivo MRI based cortical myelin mapping using T1w/T2w and R1 mapping at 3T. PloS one, 2019, 14.7.9.
- Hamaguchi, H., Patzke, N., Urushibata, Y., Katscher, U., Tha, K.K, Performance of MRI sequences in evaluation of myelin: a preliminary report. The 7th GI-CoRE Medical Science and Engineering Symposium, Sapporo, Japan, 2019 August 18.
Figures
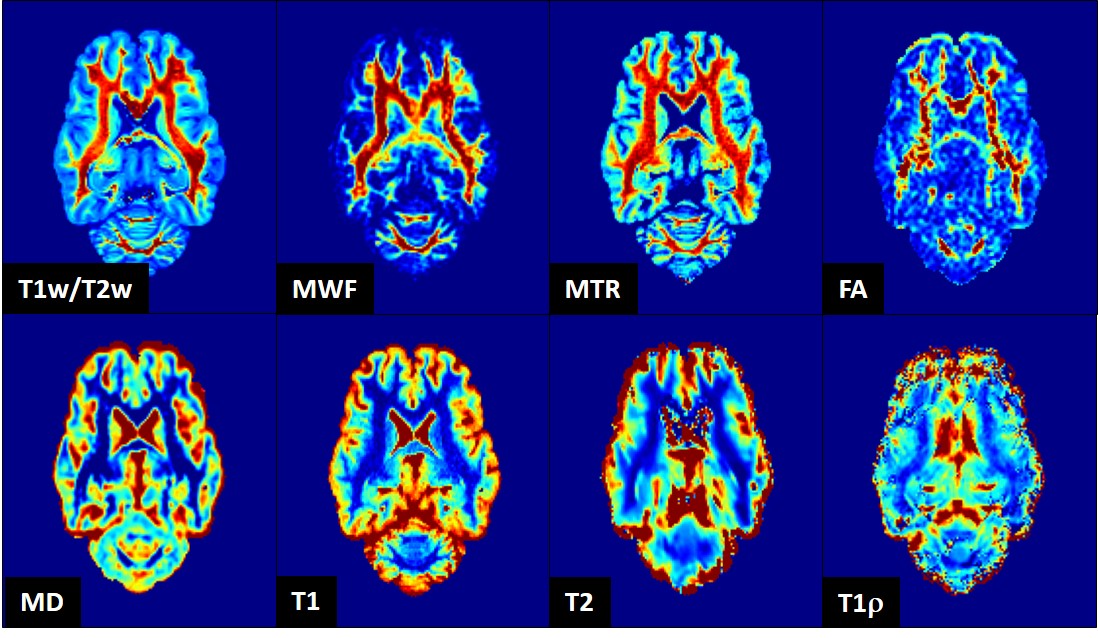
The
representative maps of each myelin quantifier. An axial section of the deer
brain is given. Abbreviations: T1w/T2w, the
division of T1-weighted image by T2-weighted image; MWF, myelin water fraction; MTR, magnetization transfer ratio; FA, fractional anisotropy; MD, mean diffusivity; T1, T1 relaxation time; T2, T2 relaxation time; T1ρ, the spin-lattice relaxation time in the rotating frame.
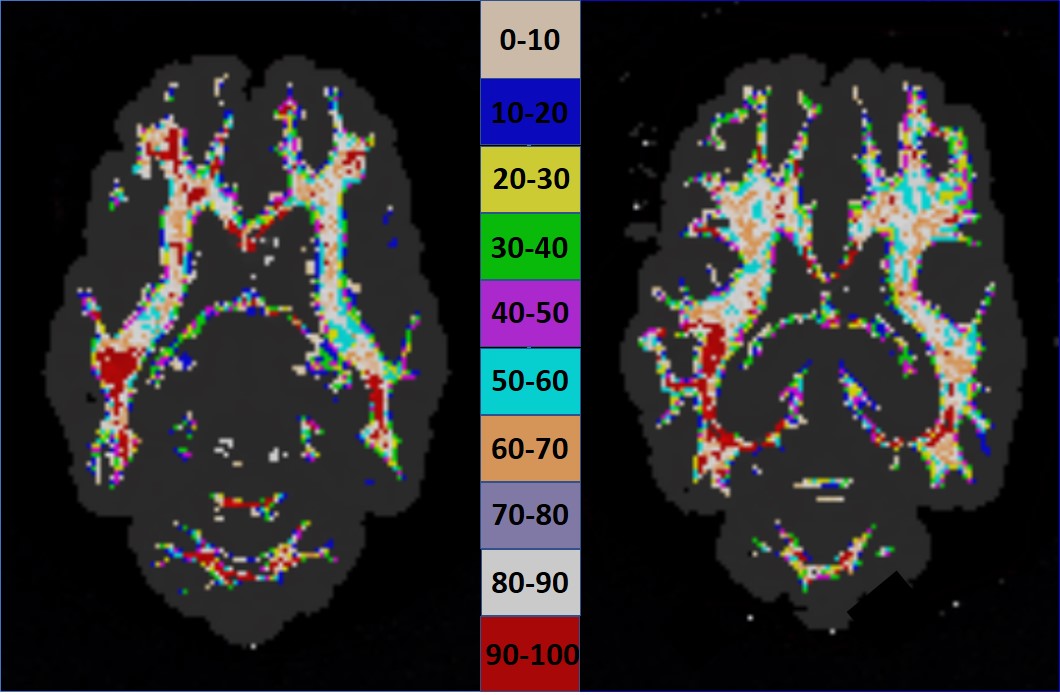
Segmentation of white matter into 10
regions-of-interest (ROIs) based on the T1w/T2w value. The color scale in the middle represents the percent signal contribution.
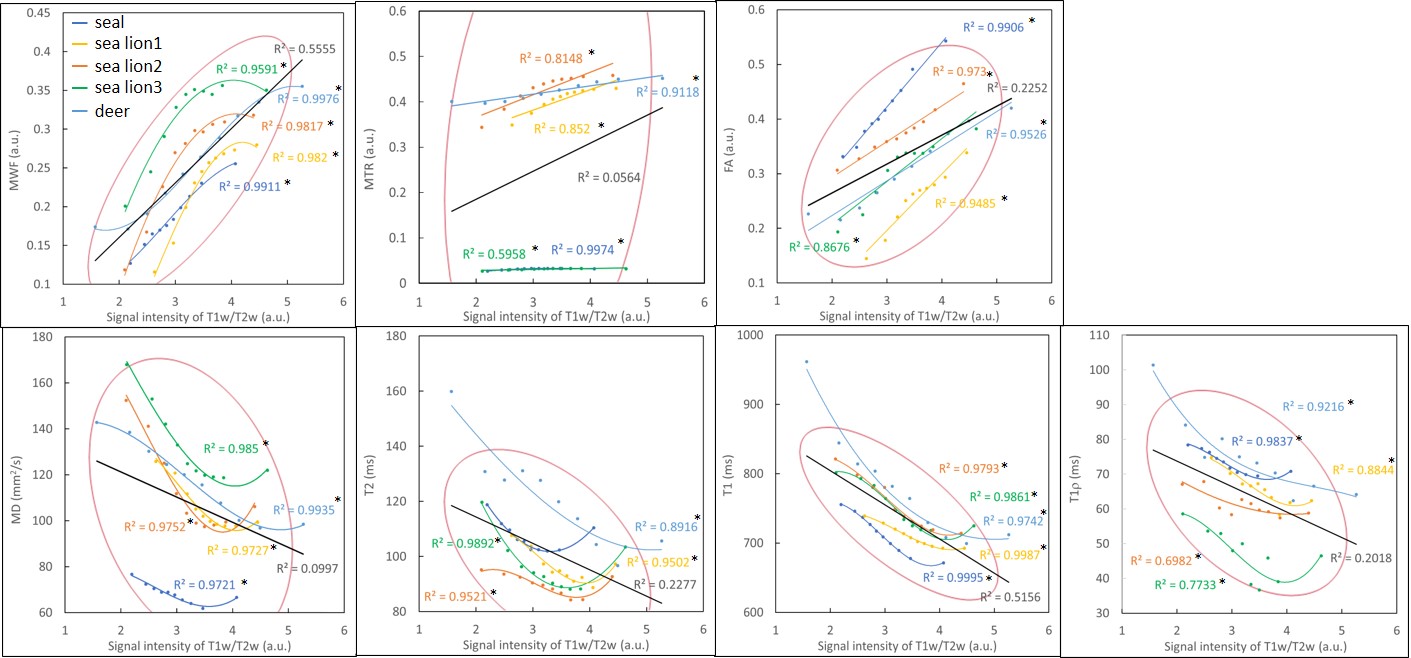
The results of tests of correlation T1w/T2w with other MRI quantifiers of myelin. A linear relationship is observed between T1w/T2w and MTR or FA, whereas a linear-plateau relationship is observed with the other quantifiers.
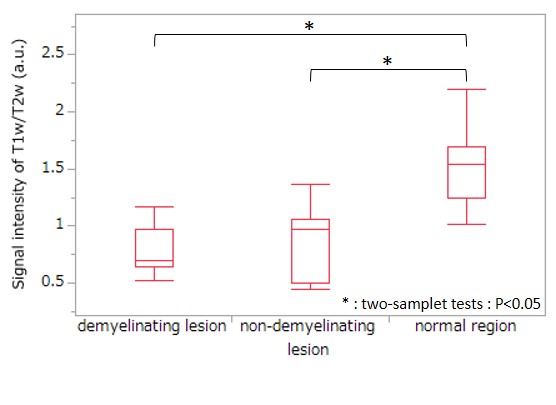
The comparison of T1w/T2w among the demyelinating lesions, non-demyelinating lesions, and the adjacent normal-appearing brain parenchyma. T1w/T2w does not vary between the lesions (P=0.3096).
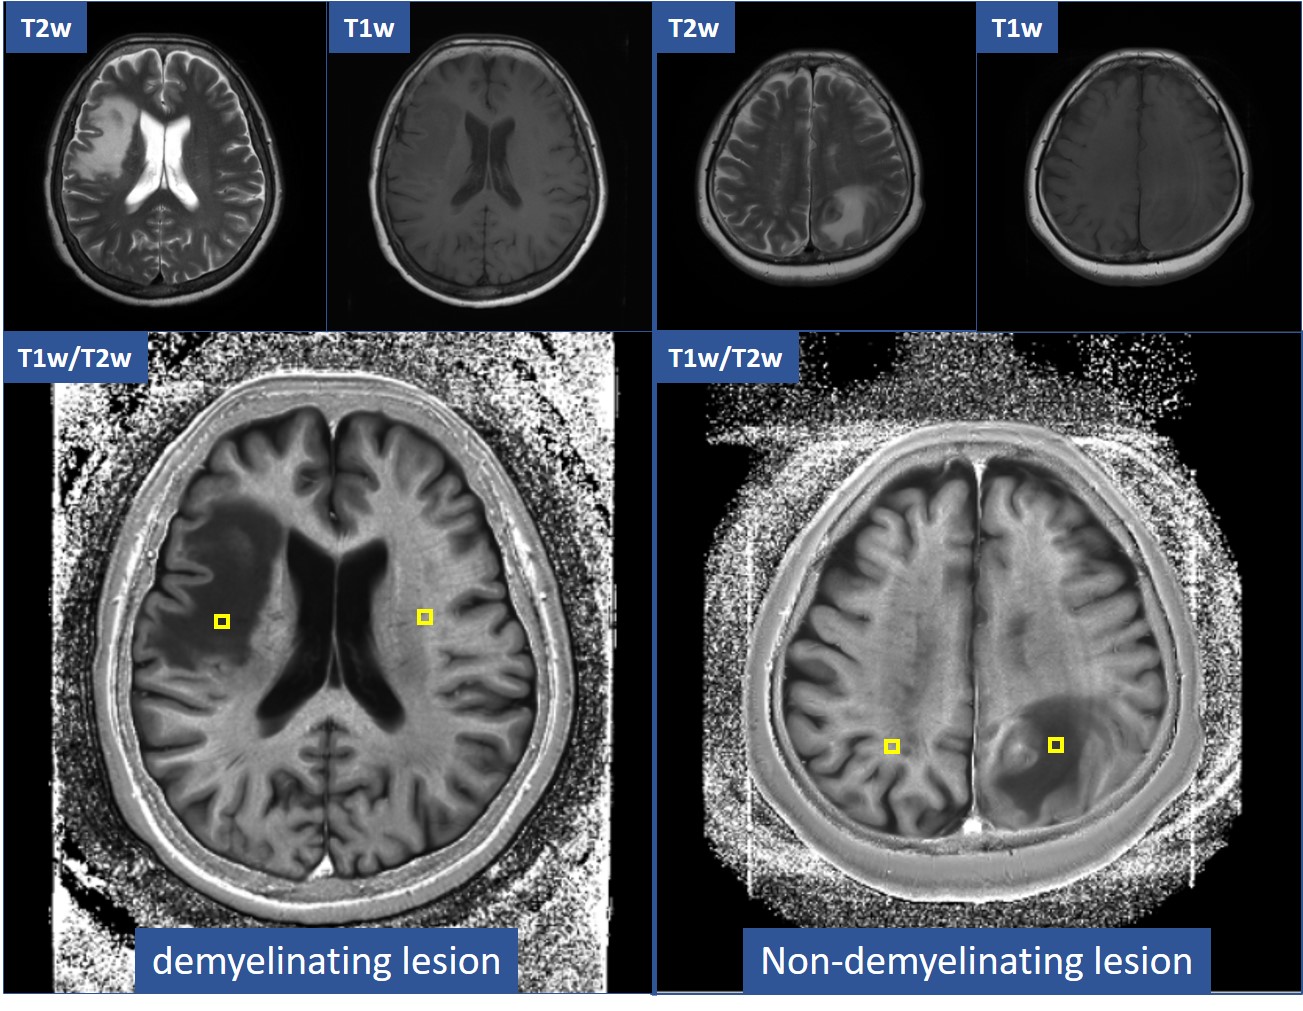
The representative T1w/T2w maps of demyelinating (Left) and non-demyelinating (Right) lesions. The upper row shows the axial T1- and T2-weighted images containing the lesions. The lower row shows the corresponding T1w/T2w. Both lesions have lower T1w/T2w than the adjacent brain parenchyma. The yellow squares indicate the regions-of-interest used to compare the T1w/T2w values.