3238
Vessel size imaging using hypoxia and hyperoxia gas challenges with spin- and gradient-echo (SAGE) MRI1Department of Biomedical Engineering, University of Southern California, Los Angeles, CA, United States, 2Departments of Pediatrics and Radiology, Children's Hospital Los Angeles, Los Angeles, CA, United States
Synopsis
This study demonstrated the feasibility of using hyperoxia and transient hypoxia gas challenges in conjunction with spin- and gradient-echo (SAGE) MRI to estimate vessel size index (VSI). Hypoxia yielded an average VSI of 14μm within acceptable range for healthy tissue, whereas hyperoxia severely underestimated vessel sizes. Test-retest in two patients demonstrated repeatability of hypoxia-VSI. Future work to optimize the acquisition and cross-validate against other VSI methodologies is required to assess the diagnostic value of this technique.
Introduction
Vessel size imaging is a non-invasive MRI method to quantitatively assess the spatial scale of the microvessels in brain tumors or ischemic stroke patients.1–3 Using the relative changes between $$$R_2$$$ and $$$R_2^*$$$ measured concurrently using spin- and gradient-echo (SAGE) MRI4,5 in response to an intravascular contrast agent, this technique measures a weighted mean of the microvascular vessel sizes, referred to as Vessel Size Index (VSI). Since VSI relies on gadolinium contrast which has been shown to accumulate in many different organs,6 VSI is limited in renally-impaired and pediatric patients. To prevent the use of exogenous contrast, Jochimsen et al. had demonstrated that a hypercapnia challenge could be used instead of gadolinium to map vessel sizes.7 Additionally, previous works have shown that hyperoxia and hypoxia challenges can be performed to induce similar MRI signal changes as gadolinium contrast.8,9 Therefore, in this work, we explored the feasibility of using hyperoxia and hypoxia challenges to measure VSI using SAGE MRI.Methods
A total of four healthy subjects were studied (female 50%, age 35±14). Test-retest was performed in a subset of two subjects.Gas challenge: Hyperoxia and hypoxia gas challenges had been detailed in previous works.9,10 Briefly, after one minute of breathing room air, subjects breathed 100% oxygen for two minutes, before switching back to room air for two minutes. For the hypoxic challenge, subjects breathed room air for one minute, followed by 100% nitrogen for 5 breaths (approximately 25 seconds) before switching back to room air. The safety of hypoxia challenges has been studied in prior publications.11,12
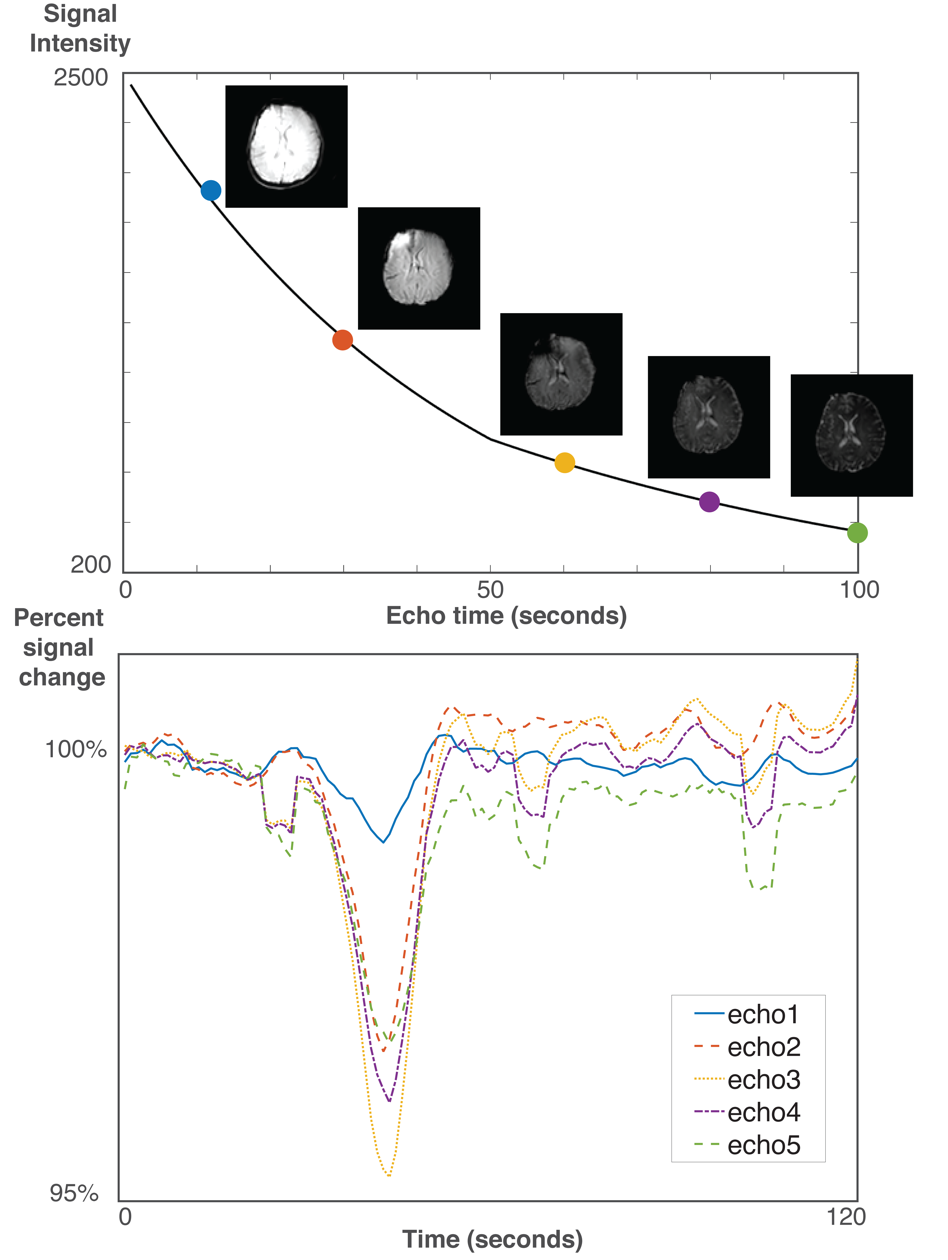
MRI: SAGE MRI4 was acquired with a Philips 3T Achieva with the following parameters: 5 echoes with TE = [8.8, 28, 53, 72, 91] ms, TR=1800ms, FOV=240×240mm, resolution = 2.5×2.5×5mm. $$$R_2$$$ and $$$R_2^*$$$ were obtained using least-squares error minimization:
$$S(\tau) = \begin{cases} S_0^I \times e^{-\tau \times R_2^*} & 0 < \tau < TE_{SE}/2 \\ S_0^{II} \times e^{-TE_{SE} \times (R_2^*-R_2)} \times e^{-\tau \times (2 \times R_2-R_2^*)} & TE_{SE}/2 < \tau < TE_{SE} \end{cases}$$
where $$$S_0^I$$$ and $$$S_0^{II}$$$ are equilibrium signals and $$$TE_{SE}$$$ is the echo time of the final spin echo at 91ms. VSI can be calculated using the following equation:
$$VSI = 0.867 \times \sqrt{CBV \times ADC} \times \frac{\Delta R_2^*}{\Delta R_2^{3/2}}$$
where CBV is 5%, D is 0.8μm2/ms and $$$\frac{\Delta R_2^*}{\Delta R_2^{3/2}}$$$ is obtained from the linear fit between $$$\Delta R_2^*$$$ and $$$\Delta R_2^{3/2}$$$ during gas administration.
Results
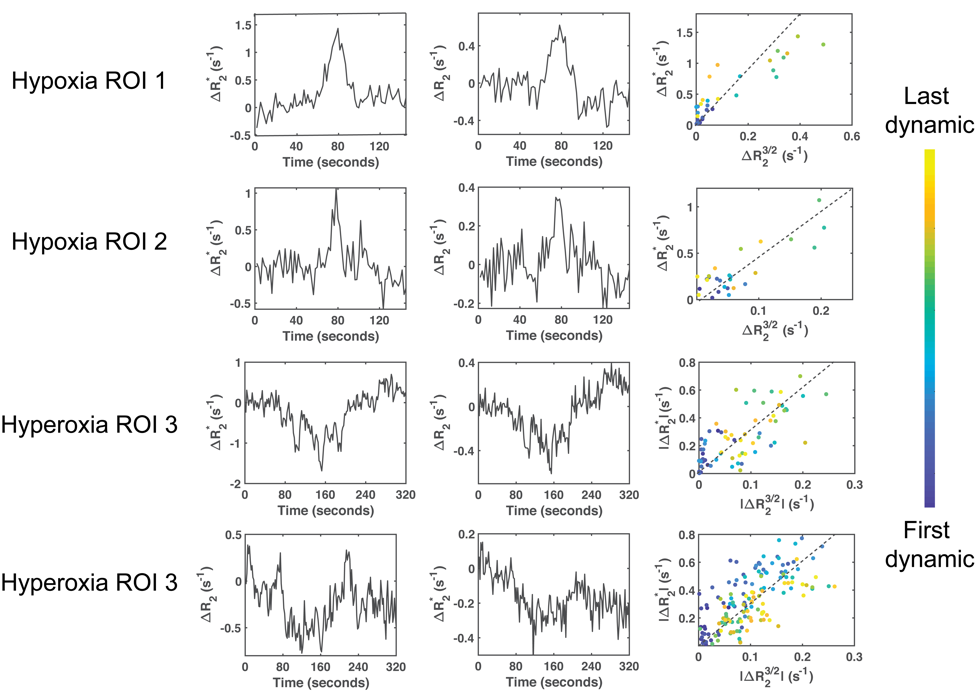
None of the patients consciously perceived the hypoxia or hyperoxia episodes and no complications were encountered. Hyperoxia increased SpO2 to 100%, whereas hypoxia lowered saturation to 84±7%. Typical SAGE images and response curves are illustrated in Figure 1.Examples of $$$R_2$$$ and $$$R_2^*$$$ changes in response to the gas challenges are shown in Figure 2. Hypoxia induced an increase of 1.4±0.2s-1 in $$$R_2^*$$$ and a smaller increase of 0.6±0.1s-1 in $$$R_2$$$ compared to baseline. In contrast, hyperoxia induced a decrease of –0.7±0.4s-1 and –0.3±0.2s-1 in $$$R_2^*$$$ and $$$R_2$$$ respectively. These relaxivities linearly varied with each other during both challenges (Figure 2), and the slopes of these linear regressions were used to compute regional VSI for each subject.
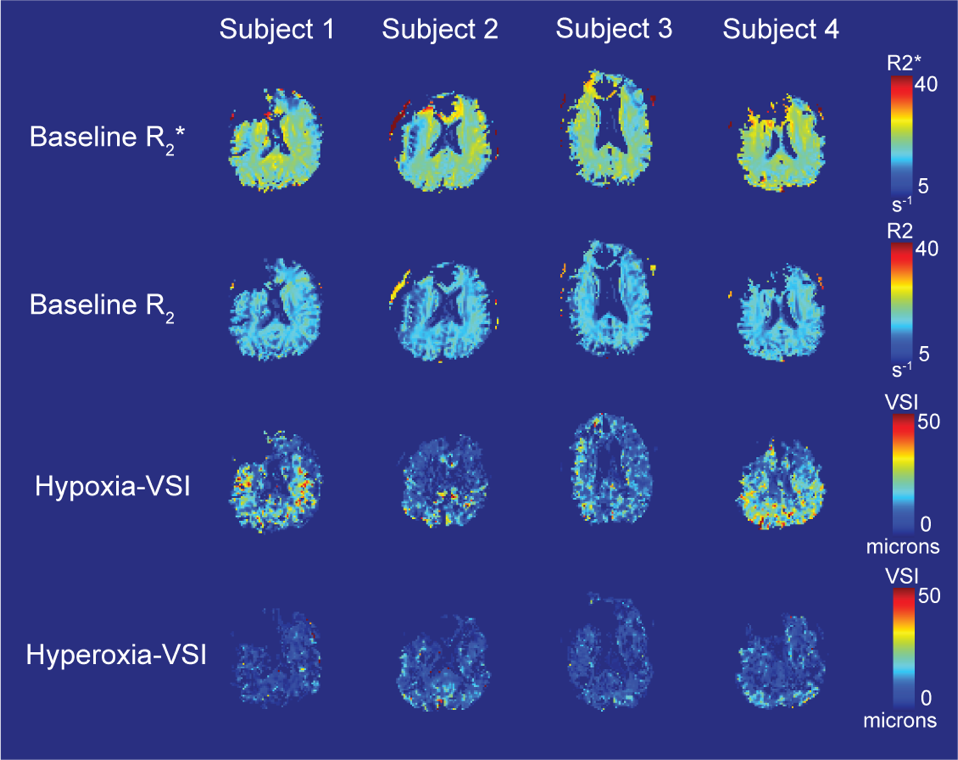
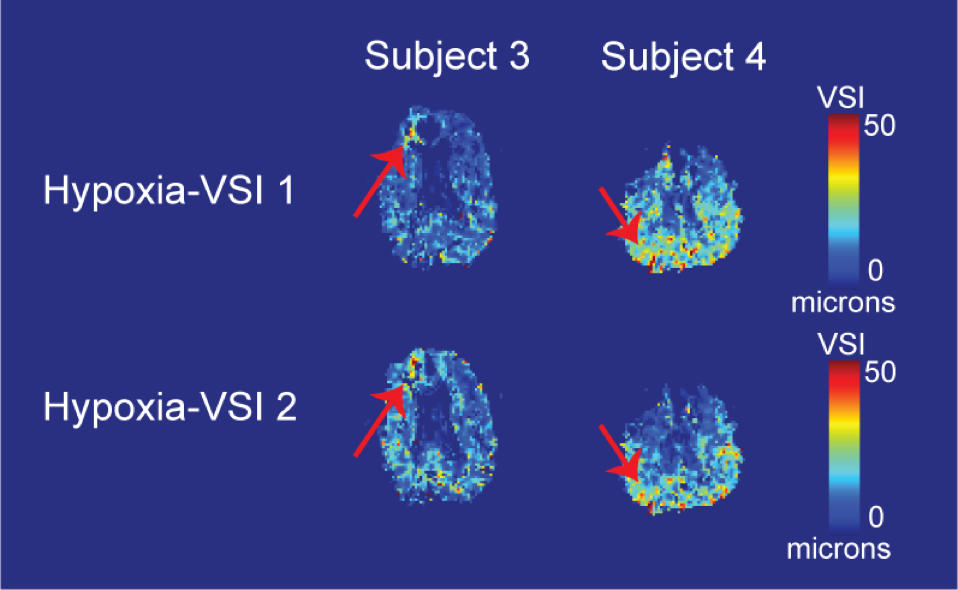
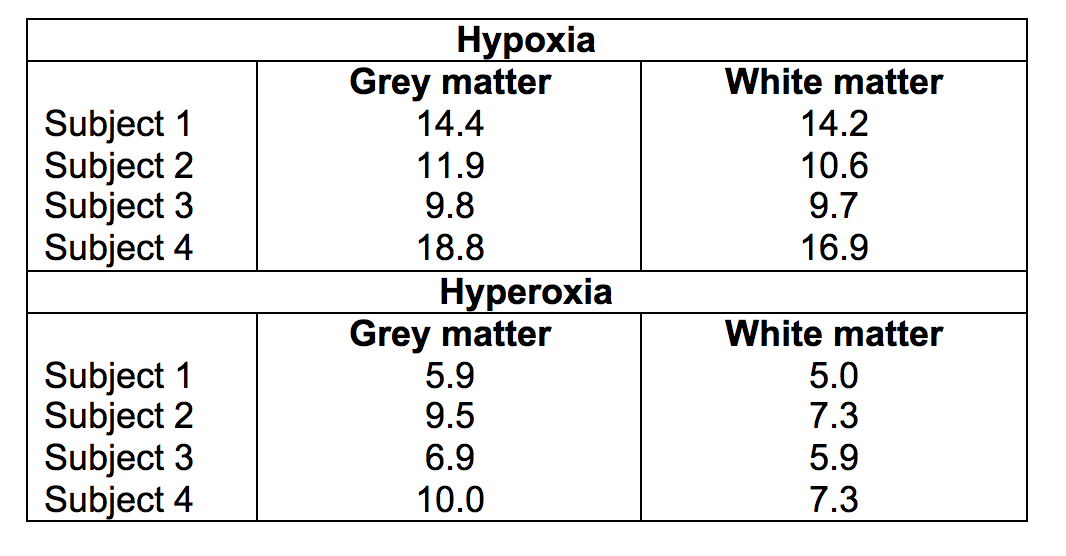
Voxel-wise estimates for $$$R_2$$$ and $$$R_2^*$$$ at baseline are shown in Figures 3A and 3B. No clear differentiation was observed between VSI in the grey matter and white matter (Figures 3C and 3D), with typical hypoxia-VSI within the range of 10 to 20μm. Hyperoxia-VSI was much lower than hypoxia-derived, with average measurements in the grey matter and white matter detailed in Table 1. Test-retest reproducibility for the hypoxia challenge was assessed in two subjects, and the VSI maps displayed moderate spatial agreement between two iterations in areas of large vessel sizes (Figure 4).
Discussion
In this study, we used hyperoxia and hypoxia gas challenges in conjunction with SAGE MRI to estimate vessel sizes in four healthy volunteers. Hypoxia gas paradigm yielded an average VSI of 14μm, within acceptable range for healthy subjects.7 In contrast, hyperoxia challenge severely underestimated the vessel sizes in both the grey matter and white matter. This underestimation could be explained by the low signal responses induced by typical fixed-inspired hyperoxia challenges, as shown by this study through the smaller changes in $$$R_2^*$$$, $$$R_2$$$, and BOLD signal compared to hypoxia.13 The hyperoxia stimulus was also sufficiently longer duration than the transient hypoxic exposure, allowing time for compensatory vasoconstriction14 and changes in CMRO2.15 Therefore, hyperoxia challenges are less reliable compared to hypoxia as an intravascular contrast in vessel size imaging.Overall, this current study has demonstrated that it is feasible to use hypoxia challenge to induce concurrent changes in $$$R_2^*$$$ and $$$R_2$$$ and measure vessel sizes in the brain. However, despite the agreement between hypoxia-VSI values with average vessel sizes in literature, the quality of VSI maps was poor especially in the frontal brain regions. Further optimization to correct for susceptibility artifact near air sinuses as well as a cross-validation study against gadolinium-based VSI or histology is required. The use of repeated hypoxic stimuli or principal component analyses could potentially decrease physiologic noise, similar to approaches in BOLD MRI. Additionally, future work to assess feasibility of hypoxia-VSI in brain tumor and acute stroke is necessary to determine the diagnostic value of this technique.
Acknowledgements
The authors would like to thank Dr. Ashley Stokes and colleagues for the generous release of the SAGE patch. This work is supported by the National Heart Lung and Blood Institute (1RO1HL136484-A1, 1U01HL117718-01), the National Institutes of Health (1R01-NS074980), the National Institute of Clinical Research Resources (UL1 TR001855-02) and by research support in kind from Philips Healthcare.References
1. Kiselev VG, Strecker R, Ziyeh S, Speck O, Hennig J. Vessel size imaging in humans. Magn Reson Med. 2005;53(3):553-563. doi:10.1002/mrm.20383
2. Troprès I, Lamalle L, Péoc’h M, et al. In vivo assessment of tumoral angiogenesis. Magn Reson Med. 2004;51(3):533-541. doi:10.1002/mrm.20017
3. Xu C, Schmidt WUH, Villringer K, et al. Vessel size imaging reveals pathological changes of microvessel density and size in acute ischemia. J Cereb Blood Flow Metab. 2011;31(8):1687-1695. doi:10.1038/jcbfm.2011.38
4. Stokes AM, Skinner JT, Quarles CC. Assessment of a combined spin- and gradient-echo (SAGE) DSC-MRI method for preclinical neuroimaging. Magn Reson Imaging. 2014;32(10):1181-1190. doi:10.1016/j.mri.2014.08.027
5. Schmiedeskamp H, Straka M, Newbould RD, et al. Combined spin- and gradient-echo perfusion-weighted imaging. Magn Reson Med. 2012;68(1):30-40. doi:10.1002/mrm.23195
6. Rogosnitzky M, Branch S. Gadolinium-based contrast agent toxicity: a review of known and proposed mechanisms. Biometals. 2016;29(3):365-376. doi:10.1007/s10534-016-9931-7
7. Jochimsen TH, Ivanov D, Ott DVM, et al. Whole-brain mapping of venous vessel size in humans using the hypercapnia-induced BOLD effect. Neuroimage. 2010;51(2):765-774. doi:10.1016/j.neuroimage.2010.02.037
8. MacDonald ME, Berman AJL, Mazerolle EL, Williams RJ, Pike GB. Modeling hyperoxia-induced BOLD signal dynamics to estimate cerebral blood flow, volume and mean transit time. Neuroimage. 2018;178:461-474. doi:10.1016/j.neuroimage.2018.05.066
9. Vu C, Coloigner J, Choi S, Wood J. Relative perfusion mapping using BOLD imaging with induced hypoxia. In: International Society of Magnetic Resonance in Medicine. Paris, France; 2018. http://archive.ismrm.org/2018/2292.html. Accessed June 24, 2019.
10. Vu C, Coloigner J, Wood J. Hyperoxia Challenge in Healthy and Anemic Subjects Using BOLD MRI.; 2019. https://www.hal.inserm.fr/inserm-02159373. Accessed October 29, 2019.
11. Sangkatumvong S, Khoo MCK, Kato R, et al. Peripheral Vasoconstriction and Abnormal Parasympathetic Response to Sighs and Transient Hypoxia in Sickle Cell Disease. doi:10.1164/rccm.201103-0537OC
12. Bickler PE, Feiner JR, Lipnick MS, Batchelder P, MacLeod DB, Severinghaus JW. Effects of Acute, Profound Hypoxia on Healthy Humans. Anesth Analg. 2017;124(1):146-153. doi:10.1213/ANE.0000000000001421
13. Losert C, Peller M, Schneider P, Reiser M. Oxygen-enhanced MRI of the brain. Magn Reson Med. 2002;48(2):271-277. doi:10.1002/mrm.10215
14. Watson NA, Beards SC, Altaf N, Kassner A, Jackson A. The effect of hyperoxia on cerebral blood flow: a study in healthy volunteers using magnetic resonance phase-contrast angiography. Eur J Anaesthesiol. 2000;17(3):152-159. http://www.ncbi.nlm.nih.gov/pubmed/10758463. Accessed April 1, 2019.
15. Xu F, Liu P, Pascual JM, Xiao G, Lu H. Effect of hypoxia and hyperoxia on cerebral blood flow, blood oxygenation, and oxidative metabolism. J Cereb Blood Flow Metab. 2012;32(10):1909-1918. doi:10.1038/jcbfm.2012.93
Figures