3237
Simultaneous Quantification of SPIO and Gd contrast agents using MR Fingerprinting1Biomedical Translational Imaging Centre (BIOTIC), HALIFAX, NS, Canada, 2Department of Physics & Atmospheric Science, Dalhousie University, HALIFAX, NS, Canada
Synopsis
Superparamagnetic Iron Oxide (SPIO) contrast agents are used extensively in molecular imaging studies as a tool to evaluate various SPIO-labelled cells. These studies would be greatly improved if multiple contrast agents could be quantified simultaneously. We combined an SSFP MR fingerprinting sequence with TE variation, and an extension of a concentration-dependent linear model, to achieve dual quantification and show viability of SPIO labelled CD8+ T cell mapping. As a pilot study for in vivo application, we demonstrate concentration mapping of a mouse injected with gadolinium, and R2* quantification of an SPIO labelled immune therapy injection site.
Introduction
Superparamagnetic Iron Oxide (SPIO) contrast agents are used extensively in molecular imaging studies for cell tracking of various SPIO-labeled cells1. MRI can enable monitoring and potential quantification of cell populations in vivo2, facilitate longitudinal studies of disease progression, and ultimately aid in the characterization of underlying cellular behaviour3. However, quantitative MR cell tracking is currently limited to single contrast agents, restricting the speed and complexity of information that can be acquired.MR Fingerprinting (MRF) is a novel methodology that enables acquisition of multiple relaxivity maps simultaneously4. MRF allows quantification of two T1/T2 contrast agents administered together5, and can be expanded to include T2* quantification required for SPIO measurements6–8. By exploiting MRF's robustness to undersampling9 and extending the framework to provide concentration maps of SPIO-labelled cells and a second agent, we can acquire substantial information not available via conventional methods, within realistic timescales for in vivo application.
In this work, we show how these adaptations allow MRF to simultaneously map SPIO and gadolinium (Gd) concentrations, and demonstrate its viability for quantifying SPIO labelled CD8+ T cells. A pilot study explores in vivo concentration mapping of a mouse injected with Gd, and R2* quantification of an SPIO labelled immune therapy site.
Methods
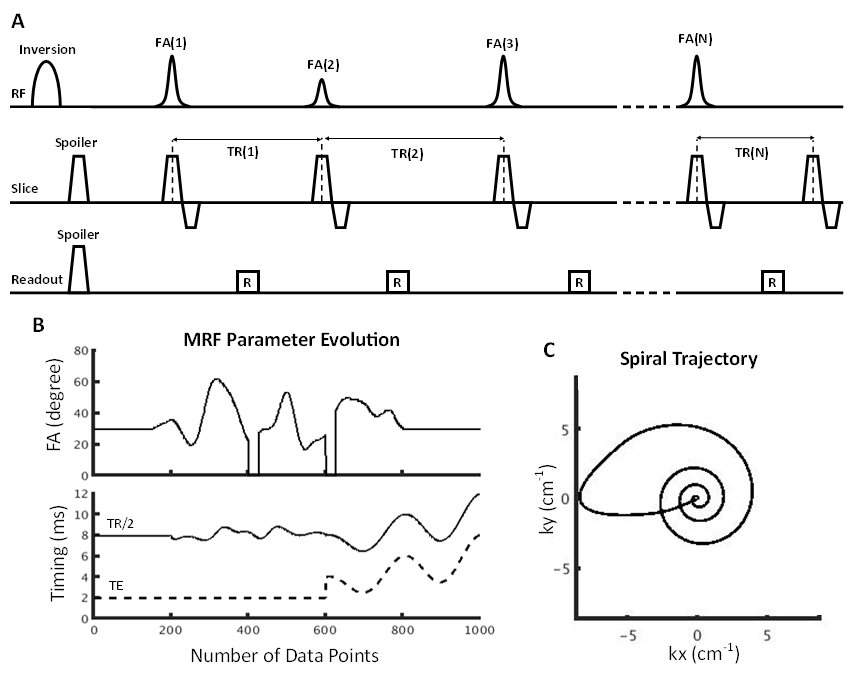
For in vitro validation, phantoms were prepared in 5 mm NMR tubes, with 4% gelatin in distilled water. Varying concentrations of either Molday ION Rhodamine B (MIRB; Biopal) labelled CD8+ T cells or ProHance (Gadoteridol; Bracco Imaging) were added (n=20), with MIRB: 0–17M cells/mL and ProHance: 0-2mM. CD8+ T cells were isolated from lymph nodes in a C57BL/6 mice and cultured in vitro for 10 days prior to labeling before 24 hours. Phantoms were also created containing both ProHance [0-1mM] and MIRB [0-3.5mM] increasing in opposite directions (n=6). Bulk T1, T2, and T2* values were obtained using conventional methods with a 3T preclinical scanner (Agilent, Santa Clara, CA).A spiral IR-FISP MRF sequence varied TE, TR and flip angle, allowing simultaneous quantification of T1, T2, and T2*. Data was collected over 1000 iterations (8x undersampled), yielding 128x128 images with 3x3mm resolution in ~3 minutes, which were reconstructed offline using MATLAB (The MathWorks; Natick, MA). The MRF dictionary was generated in MATLAB using extended phase graphing. T2* decay was simulated by scaling the output by exp(-(TE-TR/2)/T2*). The dictionary was calculated for values of T1 = 30-2300ms, T2 = 1-1150ms, and T2* = 0.1-80ms, in decreasing granularity at higher values.
Dictionary matching was performed by calculating the maximum dot product of the magnitude of the signal with the magnitude of each dictionary entry, providing an estimation of T1, T2, and T2*. Estimates of concentrations were calculated by solving the following equations:
$$R1=R1_0+[Gd]·r_{1g}+[SPIO]·r_{1,SPIO}$$ $$R2=R2_0+[Gd]·r_{2g}+[SPIO]·r_{2,SPIO} $$ $$R2^*=R2_0^*+[Gd]·r_{2g}^*+[SPIO]·r_{2,SPIO}^* $$
All mouse work was done under Dalhousie UCLA guidelines. For pilot in vivo validation, a C57BL/6 mouse was imaged using a T2-weighted scan (TE=6.3ms, ETL=8) MRF before and after intravenous injection of 200μL of Multihance (Gadobenate Dimeglumine; Bracco Imaging). Gd concentration was mapped using our described algorithms. To demonstrate R2* mapping, a second C57BL/6 mouse was imaged with a balanced SSFP (TE=4ms, TR=8ms, flip=30°) and MRF. This mouse had received a subcutaneous injection of DPX(IMV) with SPIO-labeled antigen in the right flank approximately two weeks prior to scans.
Results and Discussion
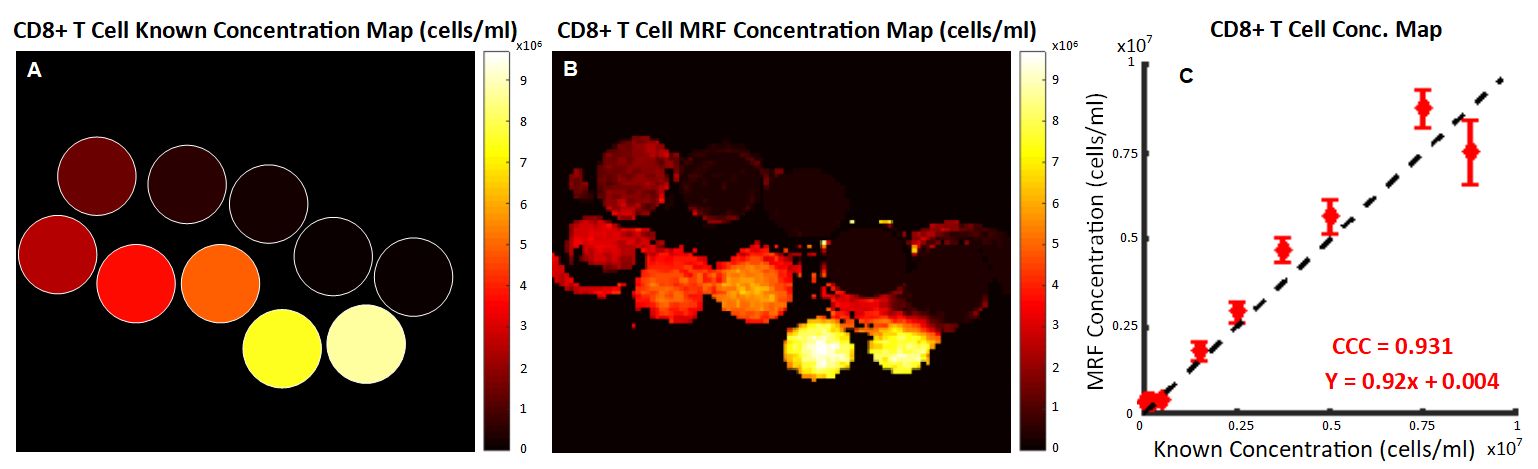
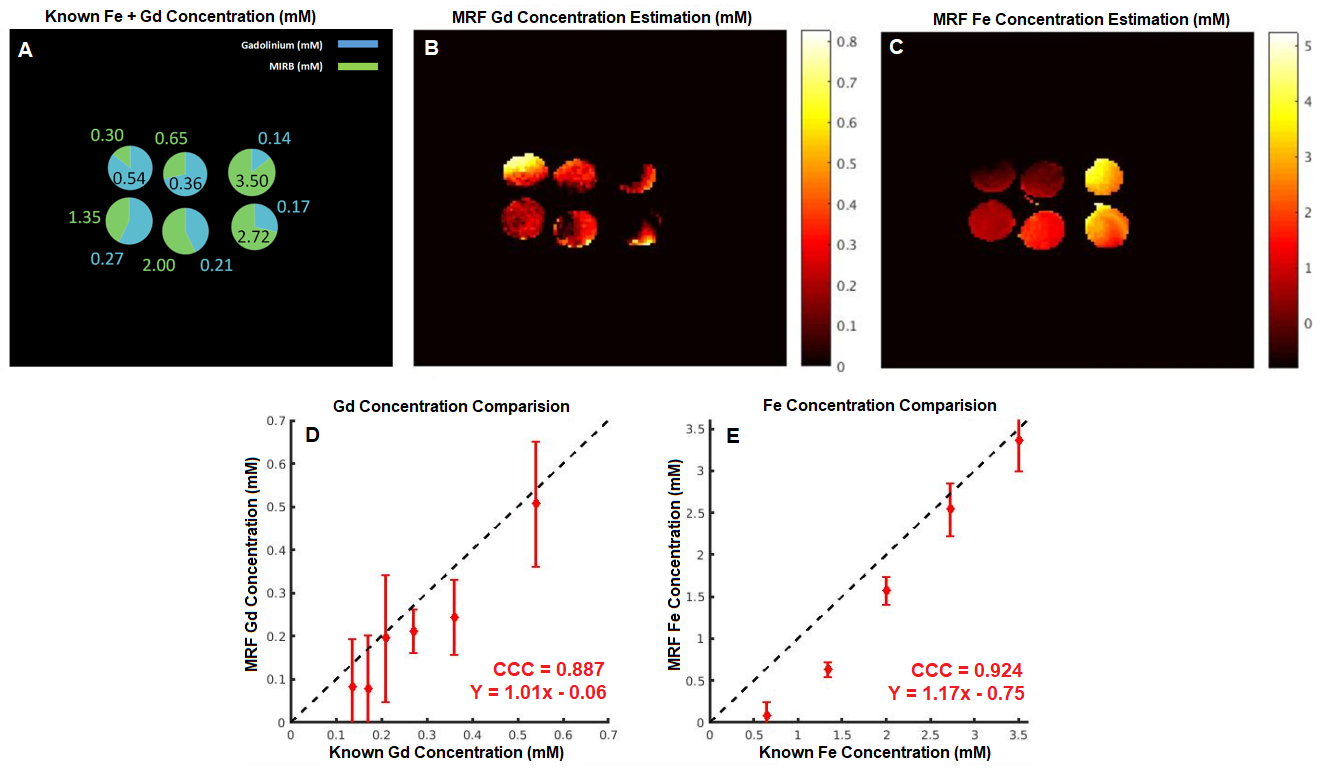
Fig 2 shows concentration mapping for SPIO-labelled CD8+ T cells, with Fig 3 showing the mapping for mixed bare SPIO and Gd. The inhomogeneity seen in most tubes is the results of using baseline relaxivity values for 4% gelatin instead of pre-contrast maps.Figs 2C, 3D, and 3E show the comparison to the known concentration values. The labelled cells strongly correlate to the known values, with a Lin’s Concordance Correlation Coefficient (CCC) >0.99 between 0.25-7.5x10⁶ cells/mL. We expect that shortening the TE of the sequence will provide improved sensitivity outside of this range. Dual quantification correlates less closely to known values, with CCC of 0.887 and 0.924 respectively. We expect Gd precision and SPIO accuracy to be increased in vivo, due to more accurate pre-contrast maps.
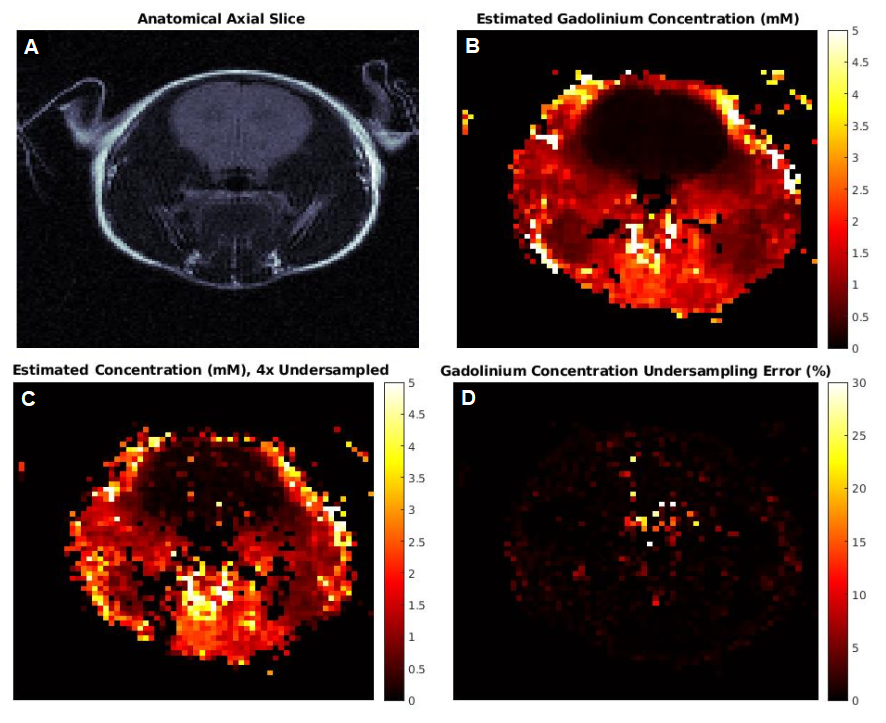
Fig 4 shows the results of the in vivo gadolinium injection. The concentration maps agree with expected results, i.e. the contrast agent would not be expected to pass through the blood-brain barrier in a healthy mouse. Figs 4B, 4C show data with 4x undersampling; despite additional noise, the concentration prediction for >90% of the pixels is within 10% of the fully sampled data. We are currently implementing golden angle interleaf rotation to further improve robustness to undersampling.
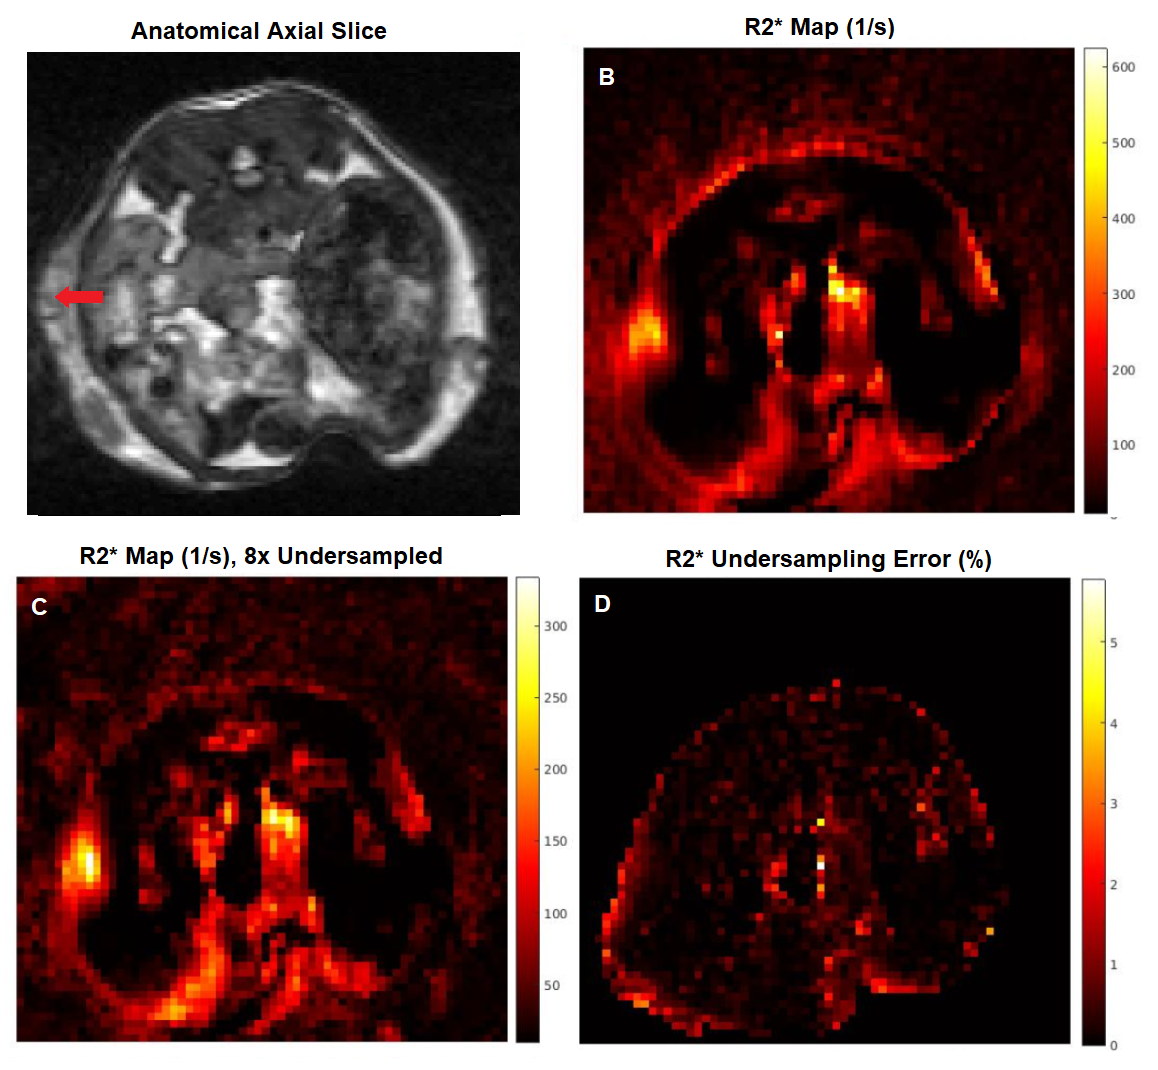
Fig 5 shows anatomical information for the SPIO injected mouse, and the resulting MRF R2* map. There is a localized increase in R2* on the left side of the mouse, at the injection site. To further validate quantification, we are currently imaging mice with a cervical tumor model following IV injection of SPIO and gadolinium to obtain simultaneous maps of T1 and T2*.
Conclusion
MR Fingerprinting can quantify both SPIO and Gd simultaneously, and enables SPIO-labelled CD8+ T cell mapping. In vivo mapping of both agents was performed, laying the groundwork for future work into increasing the speed and value of cell tracking studies.Acknowledgements
Funding for this project was provided by an NSERC Discovery Grant.References
1. Kitagawa T, Kosuge H, Uchida M, et al. RGD targeting of human ferritin iron-oxide nanoparticles enhances in vivo molecular MRI of experimental aortic aneurysms. J Cardiovasc Magn Reson. 2012;14(1):M9. doi:10.1186/1532-429X-14-S1-M9
2. Zhou Z, Qutaish M, Han Z, et al. MRI detection of breast cancer micrometastases with a fibronectin-targeting contrast agent. Nat Commun. 2015;6:7984. doi:10.1038/ncomms8984
3. Abakumova T, Abakumov M, Shein S, et al. Connexin 43-targeted T1 contrast agent for MRI diagnosis of glioma. Contrast Media Mol Imaging. 2016;11(1):15-23. doi:10.1002/cmmi.1653
4. Ma D, Gulani V, Seiberlich N, et al. Magnetic resonance fingerprinting. Nat Lond. 2013;495(7440):187-192.
5. Anderson CE, Donnola SB, Jiang Y, et al. Dual Contrast - Magnetic Resonance Fingerprinting (DC-MRF): A Platform for Simultaneous Quantification of Multiple MRI Contrast Agents. Sci Rep. 2017;7. doi:10.1038/s41598-017-08762-9
6. Hong T, Han D, Kim D-H. Simultaneous estimation of PD, T1, T2, T2*, and ∆B0 using magnetic resonance fingerprinting with background gradient compensation. Magn Reson Med. 2019;81(4):2614-2623. doi:10.1002/mrm.27556
7. Wyatt CR, Smith TB, Sammi MK, Rooney WD, Guimaraes AR. Multi-parametric T2* magnetic resonance fingerprinting using variable echo times. NMR Biomed. 2018;31(9):e3951. doi:10.1002/nbm.3951
8. Wang CY, Coppo S, Mehta BB, Seiberlich N, Yu X, Griswold MA. Magnetic resonance fingerprinting with quadratic RF phase for measurement of T2* simultaneously with δf, T1, and T2. Magn Reson Med. 2019;81(3):1849-1862. doi:10.1002/mrm.27543
9. Stolk CC, Sbrizzi A. Understanding the combined effect of k-space undersampling and transient states excitation in MR Fingerprinting reconstructions. IEEE Trans Med Imaging. February 2019. doi:10.1109/TMI.2019.2900585
Figures