3235
4D Flow for estimation of global and local pulse wave velocity in stenotic femoral arteries1Computer Assisted Clinical Medicine, Medical Faculty Mannheim, University Heidelberg, Mannheim, Germany, 2Magnetic Resonance Systems Lab, Department of Imaging Physics, Delft University of Technology, Delft, Netherlands, 3First Department of Medicine, Medical Faculty Mannheim, Mannheim, Germany, 4Institute of Clinical Radiology and Nuclear Medicine, Medical Faculty Mannheim, Mannheim, Germany
Synopsis
Pulse wave velocity (PWV) is a promising biomarker for decreasing artery diameter and wall stiffness. Recent work showed the possibility to calculate the local PWV from the velocity profil time delay along the artery out of 4D Flow measurements. In this study we used 4 different models (half maximum, maximum, foot-to-foot, cross-correlation) to compare and calculate the PWV in the relatively small femoral arteries in five subjects with stenotic arteries. We found an increased PWV of up to 20 m/s compared to literature values of healthy volunteers. Cross-correlation and half maximum methods yielded consistent results.
Introduction
Peripheral Artery Disease (PAD) is one of the most evident disease which affects more than 200 million individuals worldwide [1]. It is a common circulation problem in which narrow and stiffened arteries as in stenosis, fatty deposit and calcifications reduce blood flow through the limbs. Promising biomarkers for decreasing artery diameter and wall stiffness are flow velocity measurements and estimation of pulse wave velocities (PWV) [2, 3]. Especially in the relative small femoral arteries compared to the aorta, quantification of these parameters is challenging.In this study, we sought to monitor flow velocity and local PWV in the femoral arteries in calcifications.
Methods
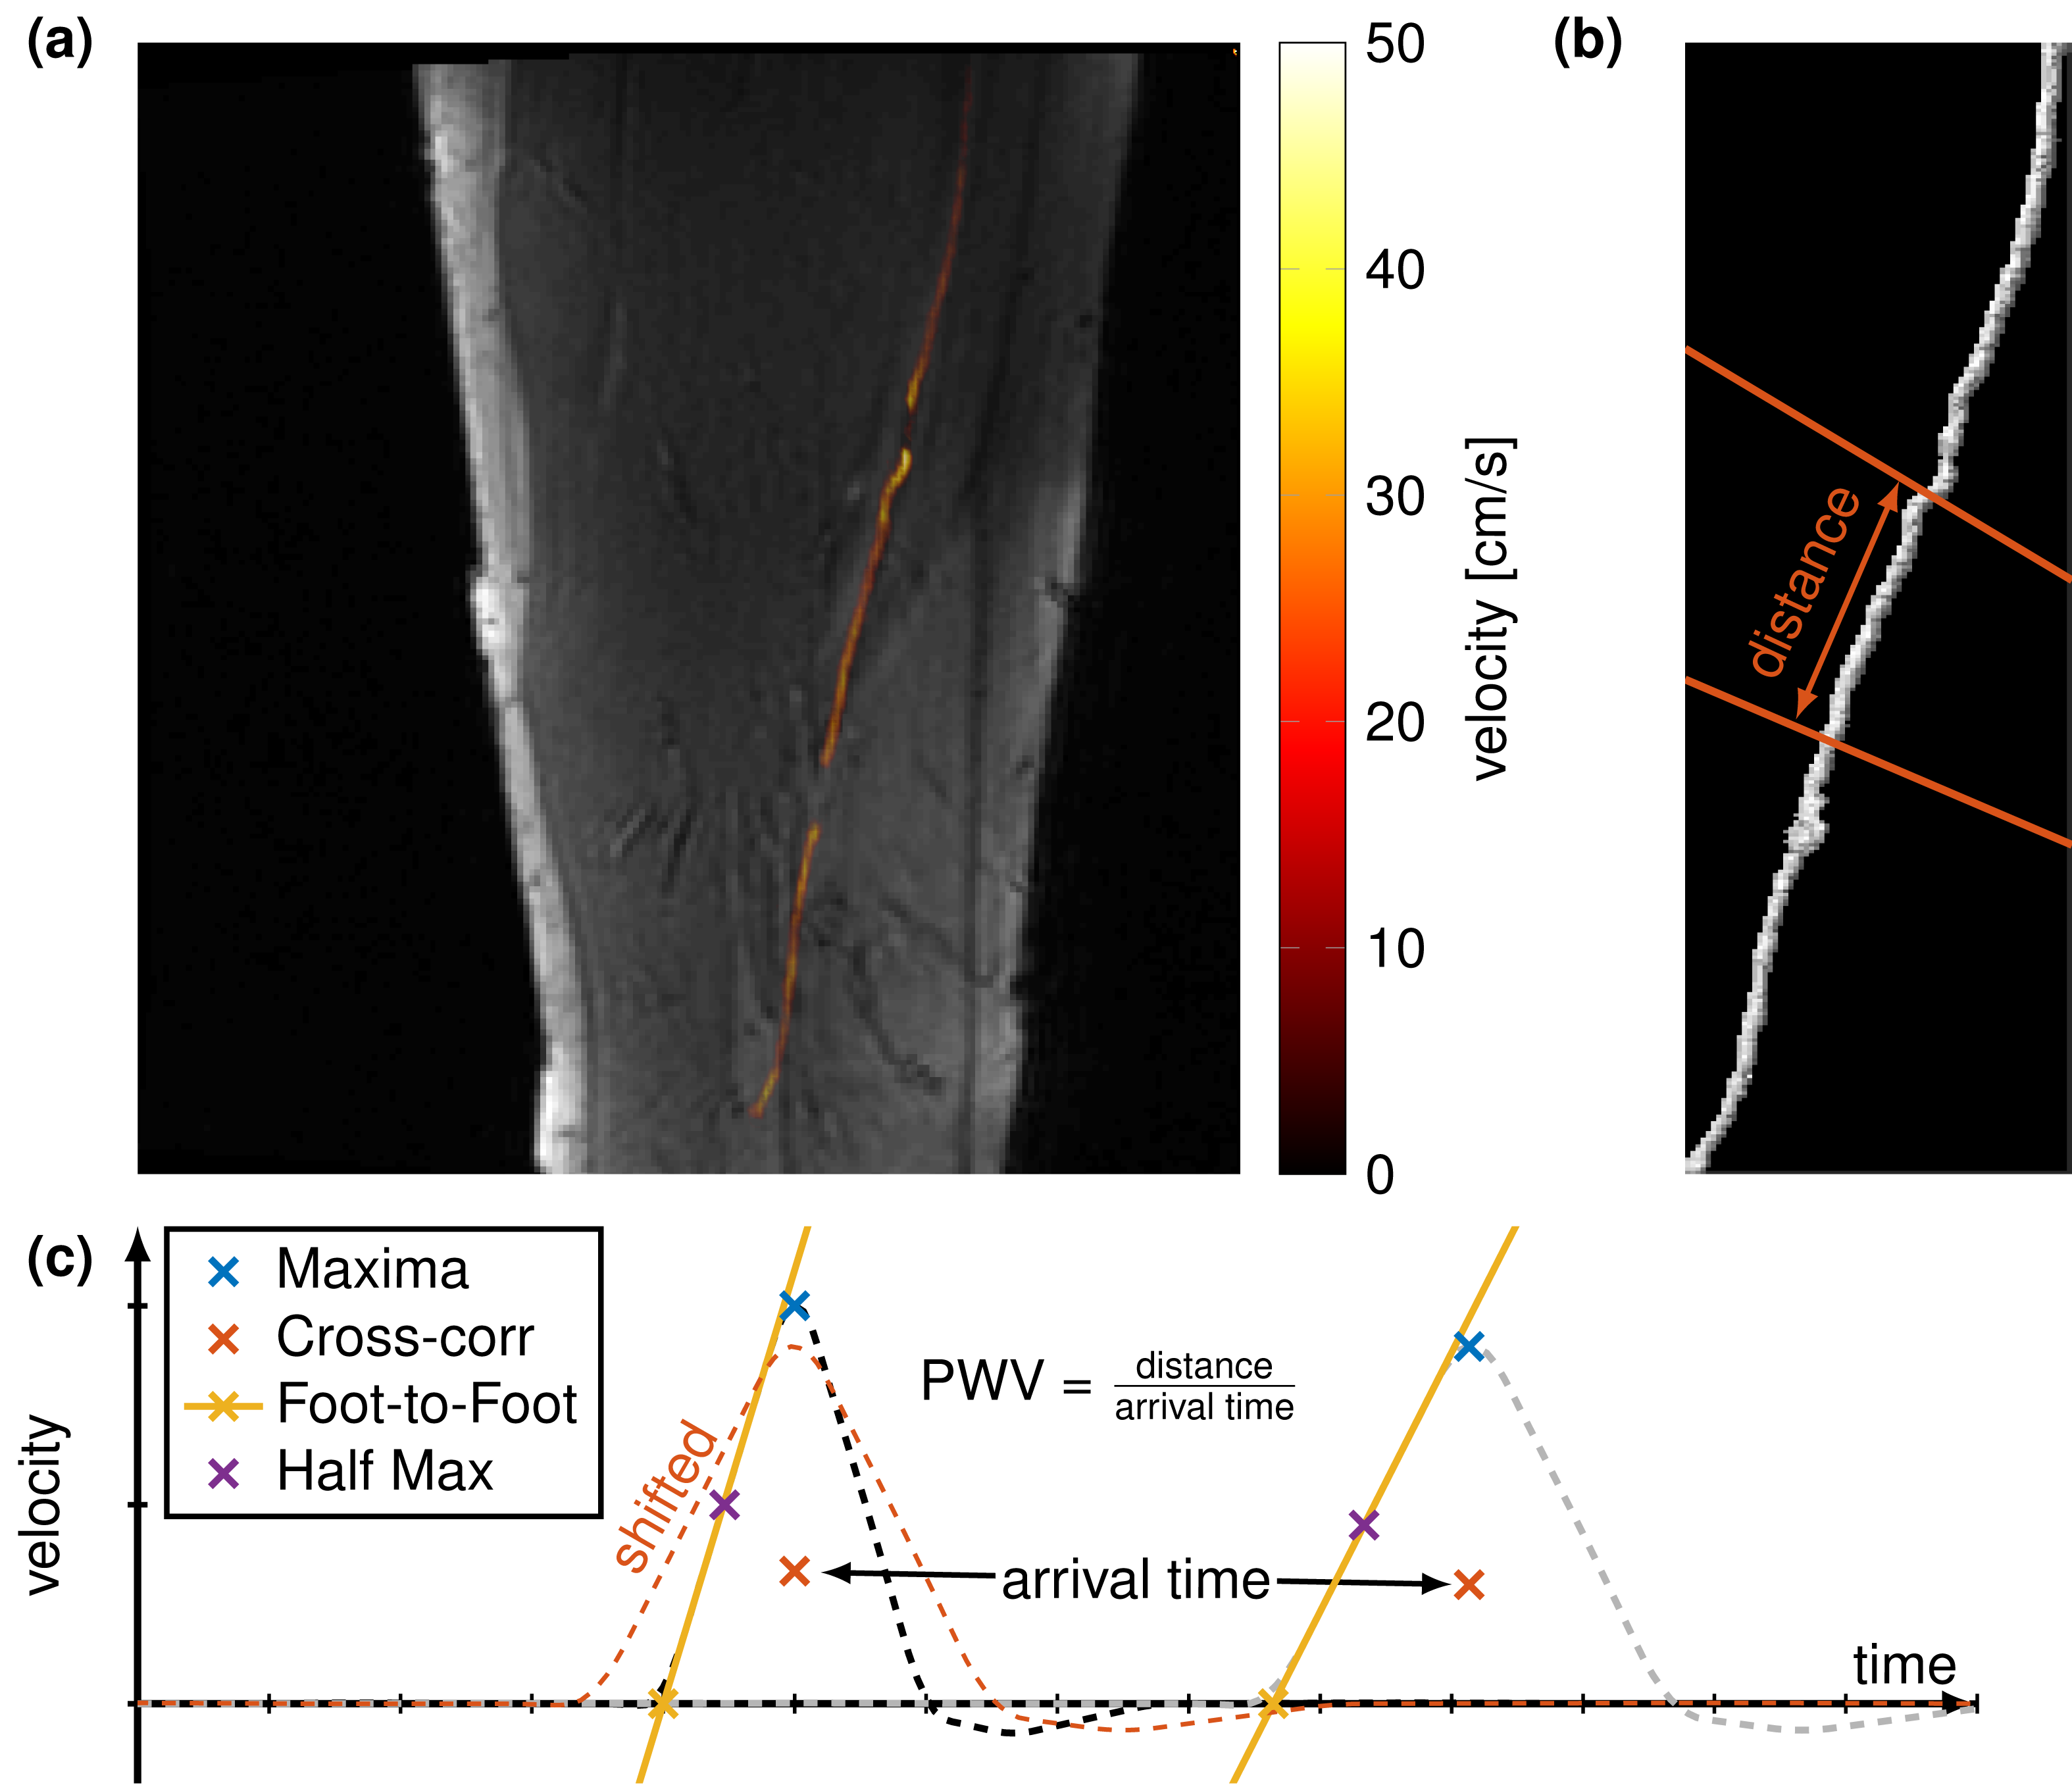
All measurements were performed in a 3 T (Skyra, Siemens Healthineers). 4D flow measurements were performed to estimate the local PWV. In vivo measurements were performed in five subjects with stenosis and calcifications (all male, 61-77 years old) in the femoral arteries. Sequence parameter for the 4D flow were base in-plane resolution = 192x192 (1.3x1.3 mm), 12 - 18 slices, slice thickness (1.3 - 2 mm), TR = 20-40 ms, TE = 3 ms, bandwidth = 490 Hz/px, VENC = 100 cm/s and flip angle = 7°.Image processing was performed by using MATLAB (The MathWorks; Natick, MA). First, the artery was semi-automatic segmented using maximal intensity projections on the phase images for every slice. Maximal velocity of every slice in the femoral artery are calculated and within a 9x9 neighborhood, all pixels with velocity bigger than 50 % of the local maximal velocity were taken for artery segmentation. The segmentation is represented as a vectorized line which is then vectorial multiplied with the velocity field which leads to the velocity over the distance along the artery. The pulse wave velocity (PWV) is defined as the distance between two positions in the artery over their arrival time of one bolus (Fig. 1). The arrival time can be calculated by different methods. We compared four different methods as proposed [4]. The time of peak velocity (maximum) and half the peak velocity (half maximum) are the most evident methods. A more stable commonly used techniques is the cross correlation which measures the similarity between two velocity profiles by convolution. Lastly, the foot-to-foot method is fitting the slope of the wave profile to estimate the "foot" of the wave.
Results
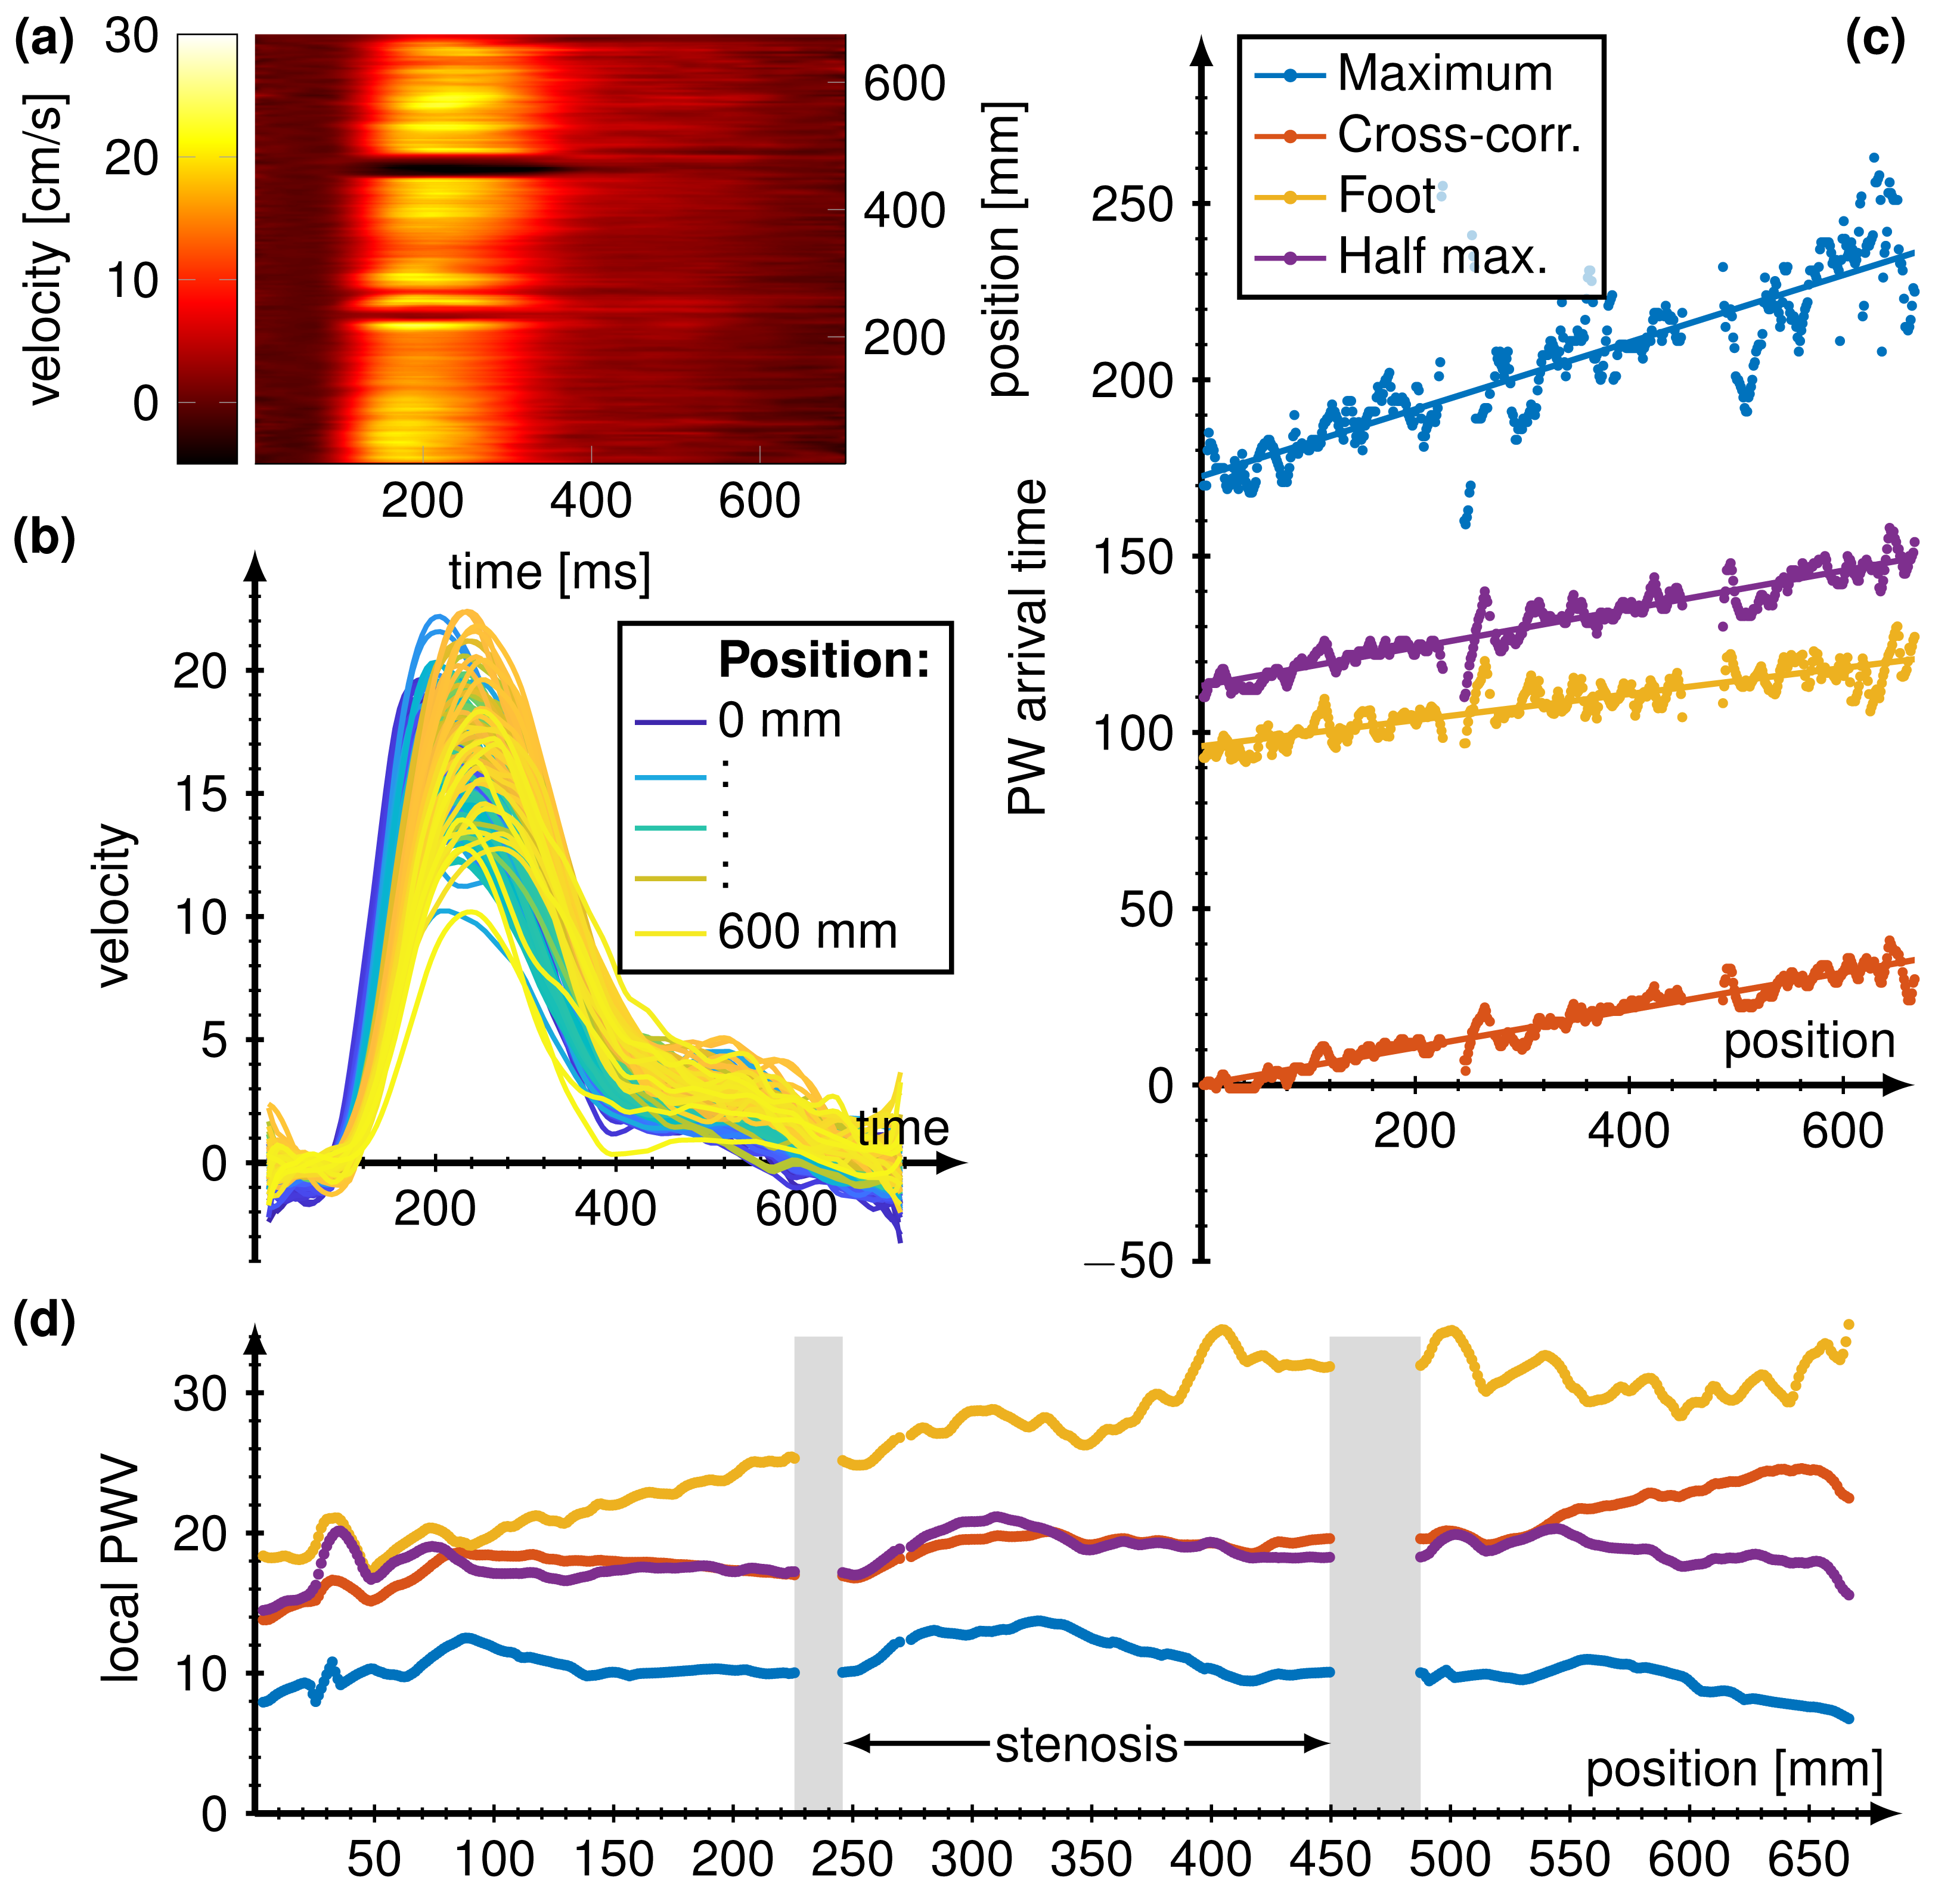
Figure 2 shows respectively for one subject the flow velocity profils over time and increasing position (encoded in shade from blue to yellow) in (b) and flow velocity per time of the ECG-cycle over the position in the femoral artery in (a). (c) show the estimated PWV for the four methods: Maximum, Cross-correlation, Foot-to-foot and half maximum. PWV arrival time estimate by the maximum of the flow profil resulted in the highest slope and therefore smallest PWV of around 10 m/s. Cross correlation and half maximum yielded similar slopes with PWV of around 18 m/s and foot-to-foot method resulted in PWV of 25 m/s. (d) Local PWV estimated with all four different methods showed similar behaviors for cross correlation and half maximum. Using peak flow (maximum) resulted in a similar trend compared with using the half maximum but resulted in overall smaller local PWV's. Foot-to-foot method resulted in higher estimated local PWV and showed larger deviations compared to the other methods. No PWV could be derived at positions of stenosis and calcifications.Discussion
We calculated local PWV in the femoral arteries in subjects with stenosis and found PWV of around 18 m/s for half maximum and cross correlation method, yielding significant higher velocities as in healthy subjects [3]. Estimating the peak flow arrival time resulted in significantly lower PWV and foot-to-foot method in higher PWV. Velocity profiles had to be interpolated and smoothed due to the small number of pixels (~10) in the artery per slice. Estimating PWV in narrow arteries was not possible due to lack of signal. Changing ECG cycle duration and movement within the 15 minutes scan hampers the image quality, especially by comparing wave profiles and estimating PWV.Conclusion
Calculating local PWV in the femoral arteries is feasible by using half maximum and cross correlation methods outside of narrowed and stiffed arteries with velocities up to 20 m/s.Acknowledgements
No acknowledgement found.References
[1] Fowkes, F. et al. Comparison of global estimates of prevalence and risk factors for peripheralartery disease in 2000 and 2010: a systematic review and analysis. Lancet 382, 1329–40(2013).
[2] Dyverfeldt, P., Ebbers, T. & Lanne, T. Pulse wave velocity with 4D flow MRI: systematicdifferences and age-related regional vascular stiffness. Magn Reson Imaging. 32, 1266–71(2014).
[3] Nabeel, P. M., Raj, V. K., Joseph, J., Abhidev, V. V. & Sivaprakasam, M. Local PulseWave Velocity: Theory, Methods, Advancements, and Clinical Applications. IEEE Reviewsin Biomedical Engineering 1–1 (2019).
[4] Ruesink, T., Medero, R., Rutkowski, D. & Rold´an-Alzate, A. In Vitro Validation of 4D FlowMRI for Local Pulse Wave Velocity Estimation. Cardiovascular Engineering and Technology 9, 674–687 (2018).
Figures