3232
A pulse sequence for robust and efficient quantitative R1rho asymmetry imaging to probe chemical exchange effect
Baiyan Jiang1 and Weitian Chen1
1Department of Imaging and Interventional Radiology, The Chinese University of Hong Kong, Hong Kong, Hong Kong
1Department of Imaging and Interventional Radiology, The Chinese University of Hong Kong, Hong Kong, Hong Kong
Synopsis
The measurement of R1rho (1/T1rho) spectrum and its asymmetry have several advantages over Chemical Exchange Saturation Transfer (CEST) to probe chemical exchange effect. Previously reported AC-iTIP approach is able to obtain R1rho-spectrum and R1rho asymmetry robustly. However, it suffers from long scan time. In this work, we proposed a new AC-iTIP approach to reduce the scan time by approximately 30%~40%, without compromising the robustness.
Introduction
The MRI imaging based on endogenous chemical exchange mechanism, such as Chemical Exchange Saturation Transfer (CEST), can be used to probe metabolites and proteins level in tissue. The R1rho asymmetry imaging may have certain advantages compared to CEST.1,2 However, these approaches suffer from B1 RF and B0 field inhomogeneities. Recently, an approach termed Adiabatic Continuous wave constant amplitude spin-lock for irradiation with Toggling Inversion Preparation (AC-iTIP) was proposed to improve the robustness of R1rho asymmetry imaging.3 However, this approach suffers from a relatively long scan time. In this work, we report a revised pulse sequence of AC-iTIP to reduce its scan time by approximately 30%~40%. Simulations, phantom, and in vivo experiments were used to demonstrate the proposed approach.Methods
In AC-iTIP, a toggling inversion pulse1 and crushers are applied preceding ACCSL RF pulses.4,5 Although ACCSL is able to lock the spins along the effective spin-lock field in presence of B1 and B0 inhomogeneities, the B0 inhomogeneity can result in a discontinuity of the Z-spectrum, whereas R1rho-spectrum is not affected.3 In the original iTIP approach,1 R1rho asymmetry can be calculated without obtaining a full R1rho-spectrum. However, due to the use of adiabatic RF pulses in AC-iTIP,3 additional data acquisition is needed to obtain a full R1rho-spectrum to calculate R1rho asymmetry, which prolongs the scan time.When using AC-iTIP and there is no B0 field inhomogeneity, the adiabatic pulse will align the spins with the effective spin-lock field in parallel if frequency offset (FO) is positive, and in anti-parallel if FO is negative. The flip angle is smaller than 90 degrees at any FO. However, consider the scenario in Figure 1: positive B0 inhomogeneity and negative FO, with the sum of them bigger than 0. Now the adiabatic pulse will align the spins in anti-parallel due to negative FO. Therefore, instead of path 1, the spins will follow path 2. The magnetization flips more than 90 degrees until the sum of B0 and FO is smaller than 0. This results in distortion of the spectrum between FO=0Hz and FO+B0=0Hz. The similar situation applies to the negative B0 inhomogeneity and positive FO.
The discontinuity can be corrected by reversing the FM component of the adiabatic pulse, as shown in Figure 2. Namely, the adiabatic pulse will align the spins with the effective spin-lock field in anti-parallel if FO is positive, and in parallel if FO is negative. The reversing equation is as follow:$$FM2=\left\{\begin{matrix}-FM1-2\times \begin{vmatrix}FO\end{vmatrix}, if FO\leq 0\\ -FM1+2\times \begin{vmatrix}FO\end{vmatrix}, if FO> 0\end{matrix}\right.\ ,[1]$$where FM1 is the standard FM waveform, FM2 is the reversed waveform, and FO is the frequency offset. Combined with a B0 map acquisition, we can replace the distorted regions with the correct ones.
We performed the proposed approach using simulation and compared both the AC-iTIP3 and the proposed approach using phantom and in vivo experiments. Simulations were performed using parameters of cartilage, five pool-population ratios of metabolites were selected from 0 to 0.01. Three groups of B1 RF and B0 field inhomogeneities were simulated: control (no B1 RF and B0 inhomogeneity), moderate (90% B1 and 50Hz B0) and severe (80% B1 and -75Hz B0). Simulation data were performed at FO from -500 to 500Hz. For moderate and severe cases, reversed FM data were simulated at FO from -50 to 50Hz and -75 to 75Hz, respectively. Phantoms and in vivo knee data sets were acquired from a Philips Achieva TX 3.0T system (Philips Healthcare, Best, the Netherlands) using eight-channel head and knee coils, respectively. For both phantom and in vivo experiments, scans were performed at FO from -300 to 300Hz with 25Hz increment, reversed FM data were collected at FO ±100Hz, ±75Hz, ±50Hz and ±25Hz. Six tubes of myo-inositol with concentration 0, 20, 30, 50, 100, 150 and 200mM were dissolved in phosphate-buffered saline (pH=7.4), and added with 0.2mM MnCl2 to modulate the water relaxation R1 and R2 to ~1.6 and 20Hz, respectively. Volunteer scan was conducted under the approval of the Institutional Review. 2D Fast Spin Echo was used for imaging data acquisition. Frequencies of spin-lock (FSL) for simulation, phantom and in vivo experiments was 150Hz. Time of spin-lock was 60ms. Scan time reduction was about 30%. An order of 15 polynomial fitting was used to fit the spectrum to perform asymmetry analysis. R1rho asymmetry was calculated at 0.9ppm to 1.1ppm.
Results and Discussion
Figure 3 shows the simulation results. The reversed FM is able to correct the discontinuity and obtain a smooth Z-spectrum. Note R1rho asymmetry signal reduces with increasing B1 RF inhomogeneity, which affects the optimal FSL.3 Figure 4 shows the phantom results. Note both AC-iTIP and the proposed approach show a similar linear relationship between the R1rho asymmetry and the concentration of metabolites. Figure 5 shows the in vivo results. Note the proposed approach resulted in a comparable R1rho asymmetry map compared to AC-iTIP, but the scan time is reduced by 30%.Conclusion
The preliminary results demonstrated the proposed approach can significantly reduce the scan time of AC-iTIP without comprising its robustness in the presence of field inhomogeneities. The proposed approach has the potential to probe metabolites in vivo.Acknowledgements
This study is supported by a grant from the Research Grants Council of the Hong Kong SAR (Project SEG CUHK02), and a grant from the Innovation and Technology Commission of the Hong Kong SAR (Project MRP/001/18X).References
- Jin T, and Kim S-G. Quantitative Chemical Exchange Sensitive MRI Using Irradiation with Toggling Inversion Preparation. Magnetic Resonance in Medicine, 2012, 68(4), pp. 1056–1064., doi:10.1002/mrm.24449.
- Ling W, Nicholls, F. J, Jin T, et al. Selective Detection of Chemical Exchange Specific R1rho by iTIP gagCEST. ISMRM 2014.
- Jiang, B., Jin, T., Blu, T., & Chen, W. (2019). Probing chemical exchange using quantitative spin-lock R1ρ asymmetry imaging with adiabatic RF pulses. Magnetic Resonance in Medicine, 82(5), 1767–1781. doi: 10.1002/mrm.27868.
- Jiang B and Chen W. On-Resonance and off-Resonance Continuous Wave Constant Amplitude Spin-Lock and T1ρ Quantification in the Presence of B1 and B0 Inhomogeneities. NMR in Biomedicine, 2018, 31(7), doi:10.1002/nbm.3928.
- Chen W. Artifacts correction for T1rho imaging with constant amplitude spin-lock. J Magn Reson. 2017;274:13‐23. https://doi.org/10.1016/j.jmr.2016.11.002.
Figures
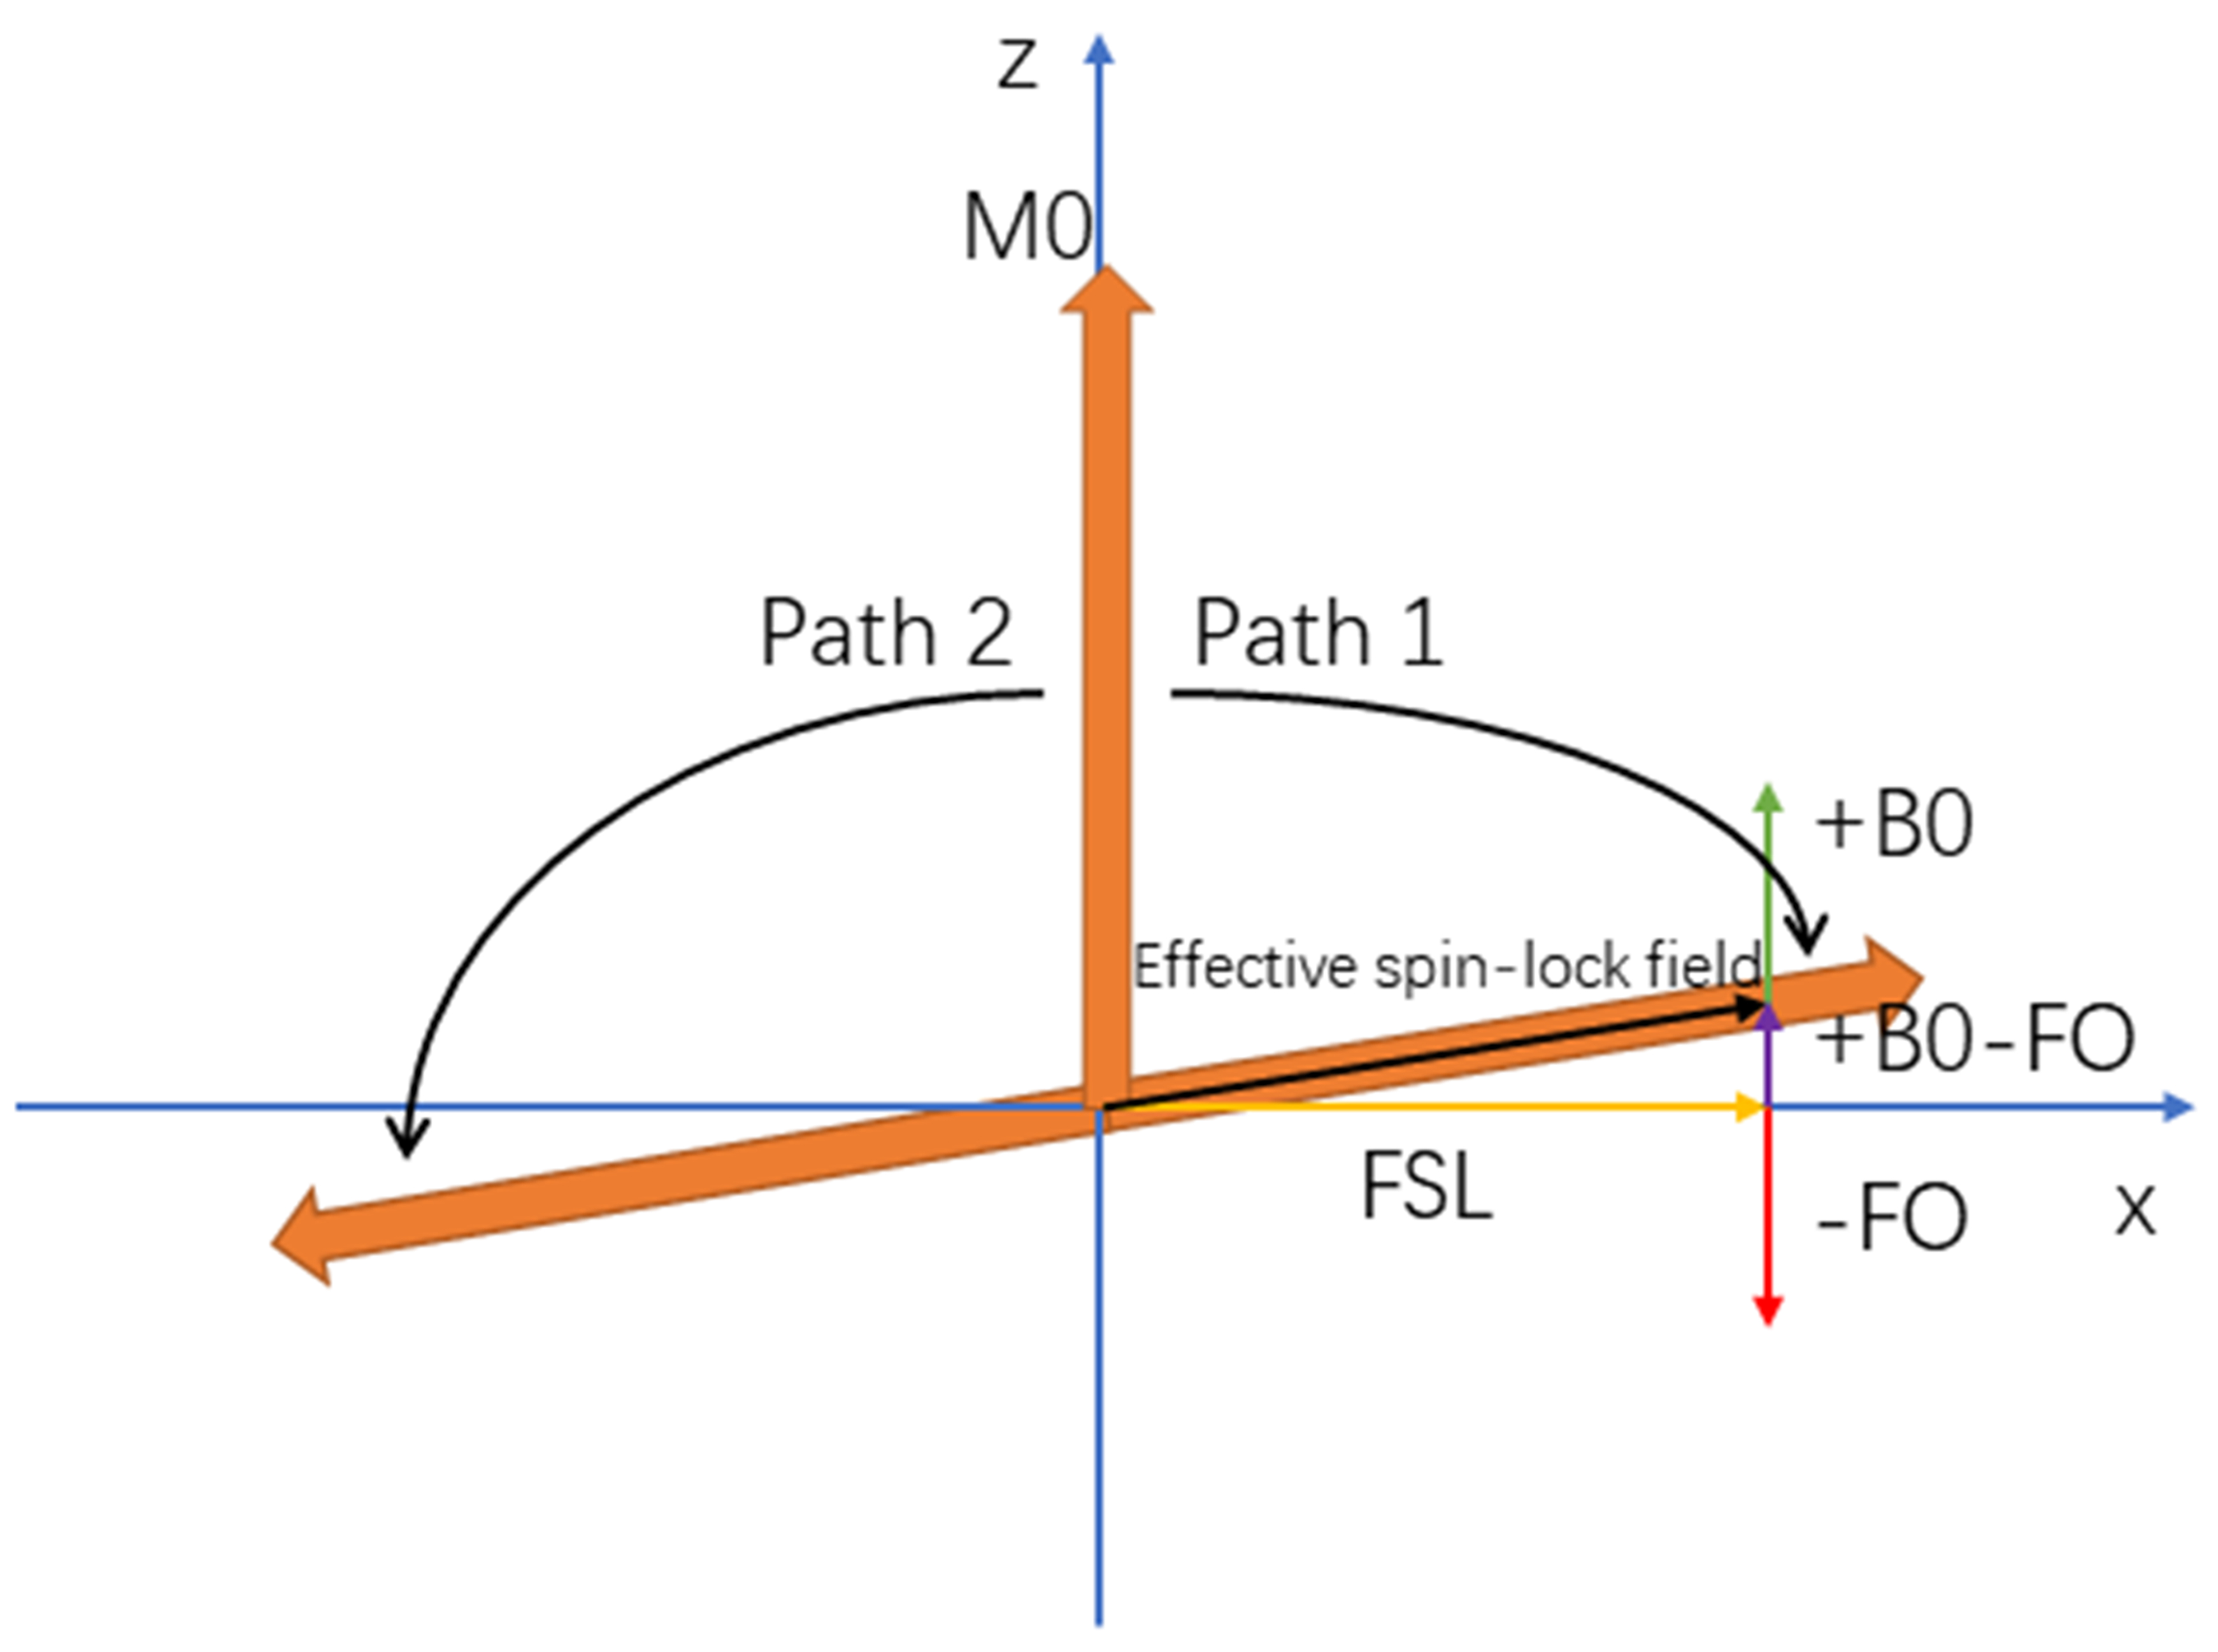
Figure 1. Simulation demonstrating the effect of B0
inhomogeneity on ACCSL magnetization evolution in the x-z plane. M0 represents the magnetization. FSL is the frequency of spinlock.
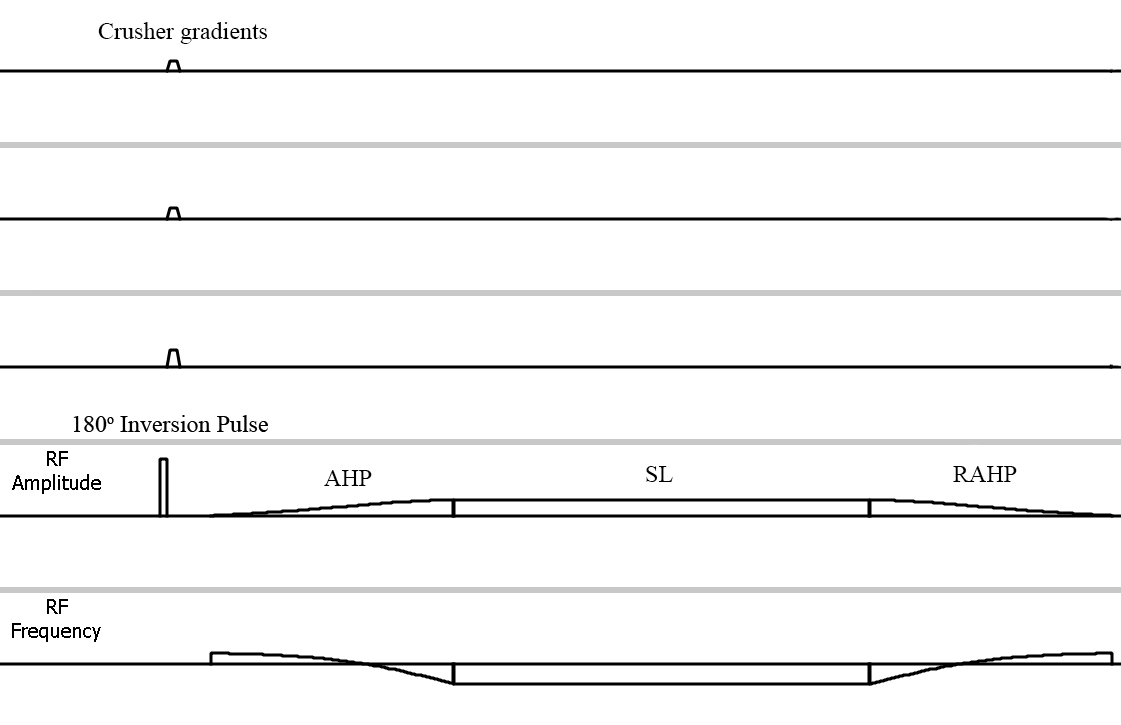
Figure 2. Pulse cluster of the new AC-iTIP approach. FO is negative in this illustration.
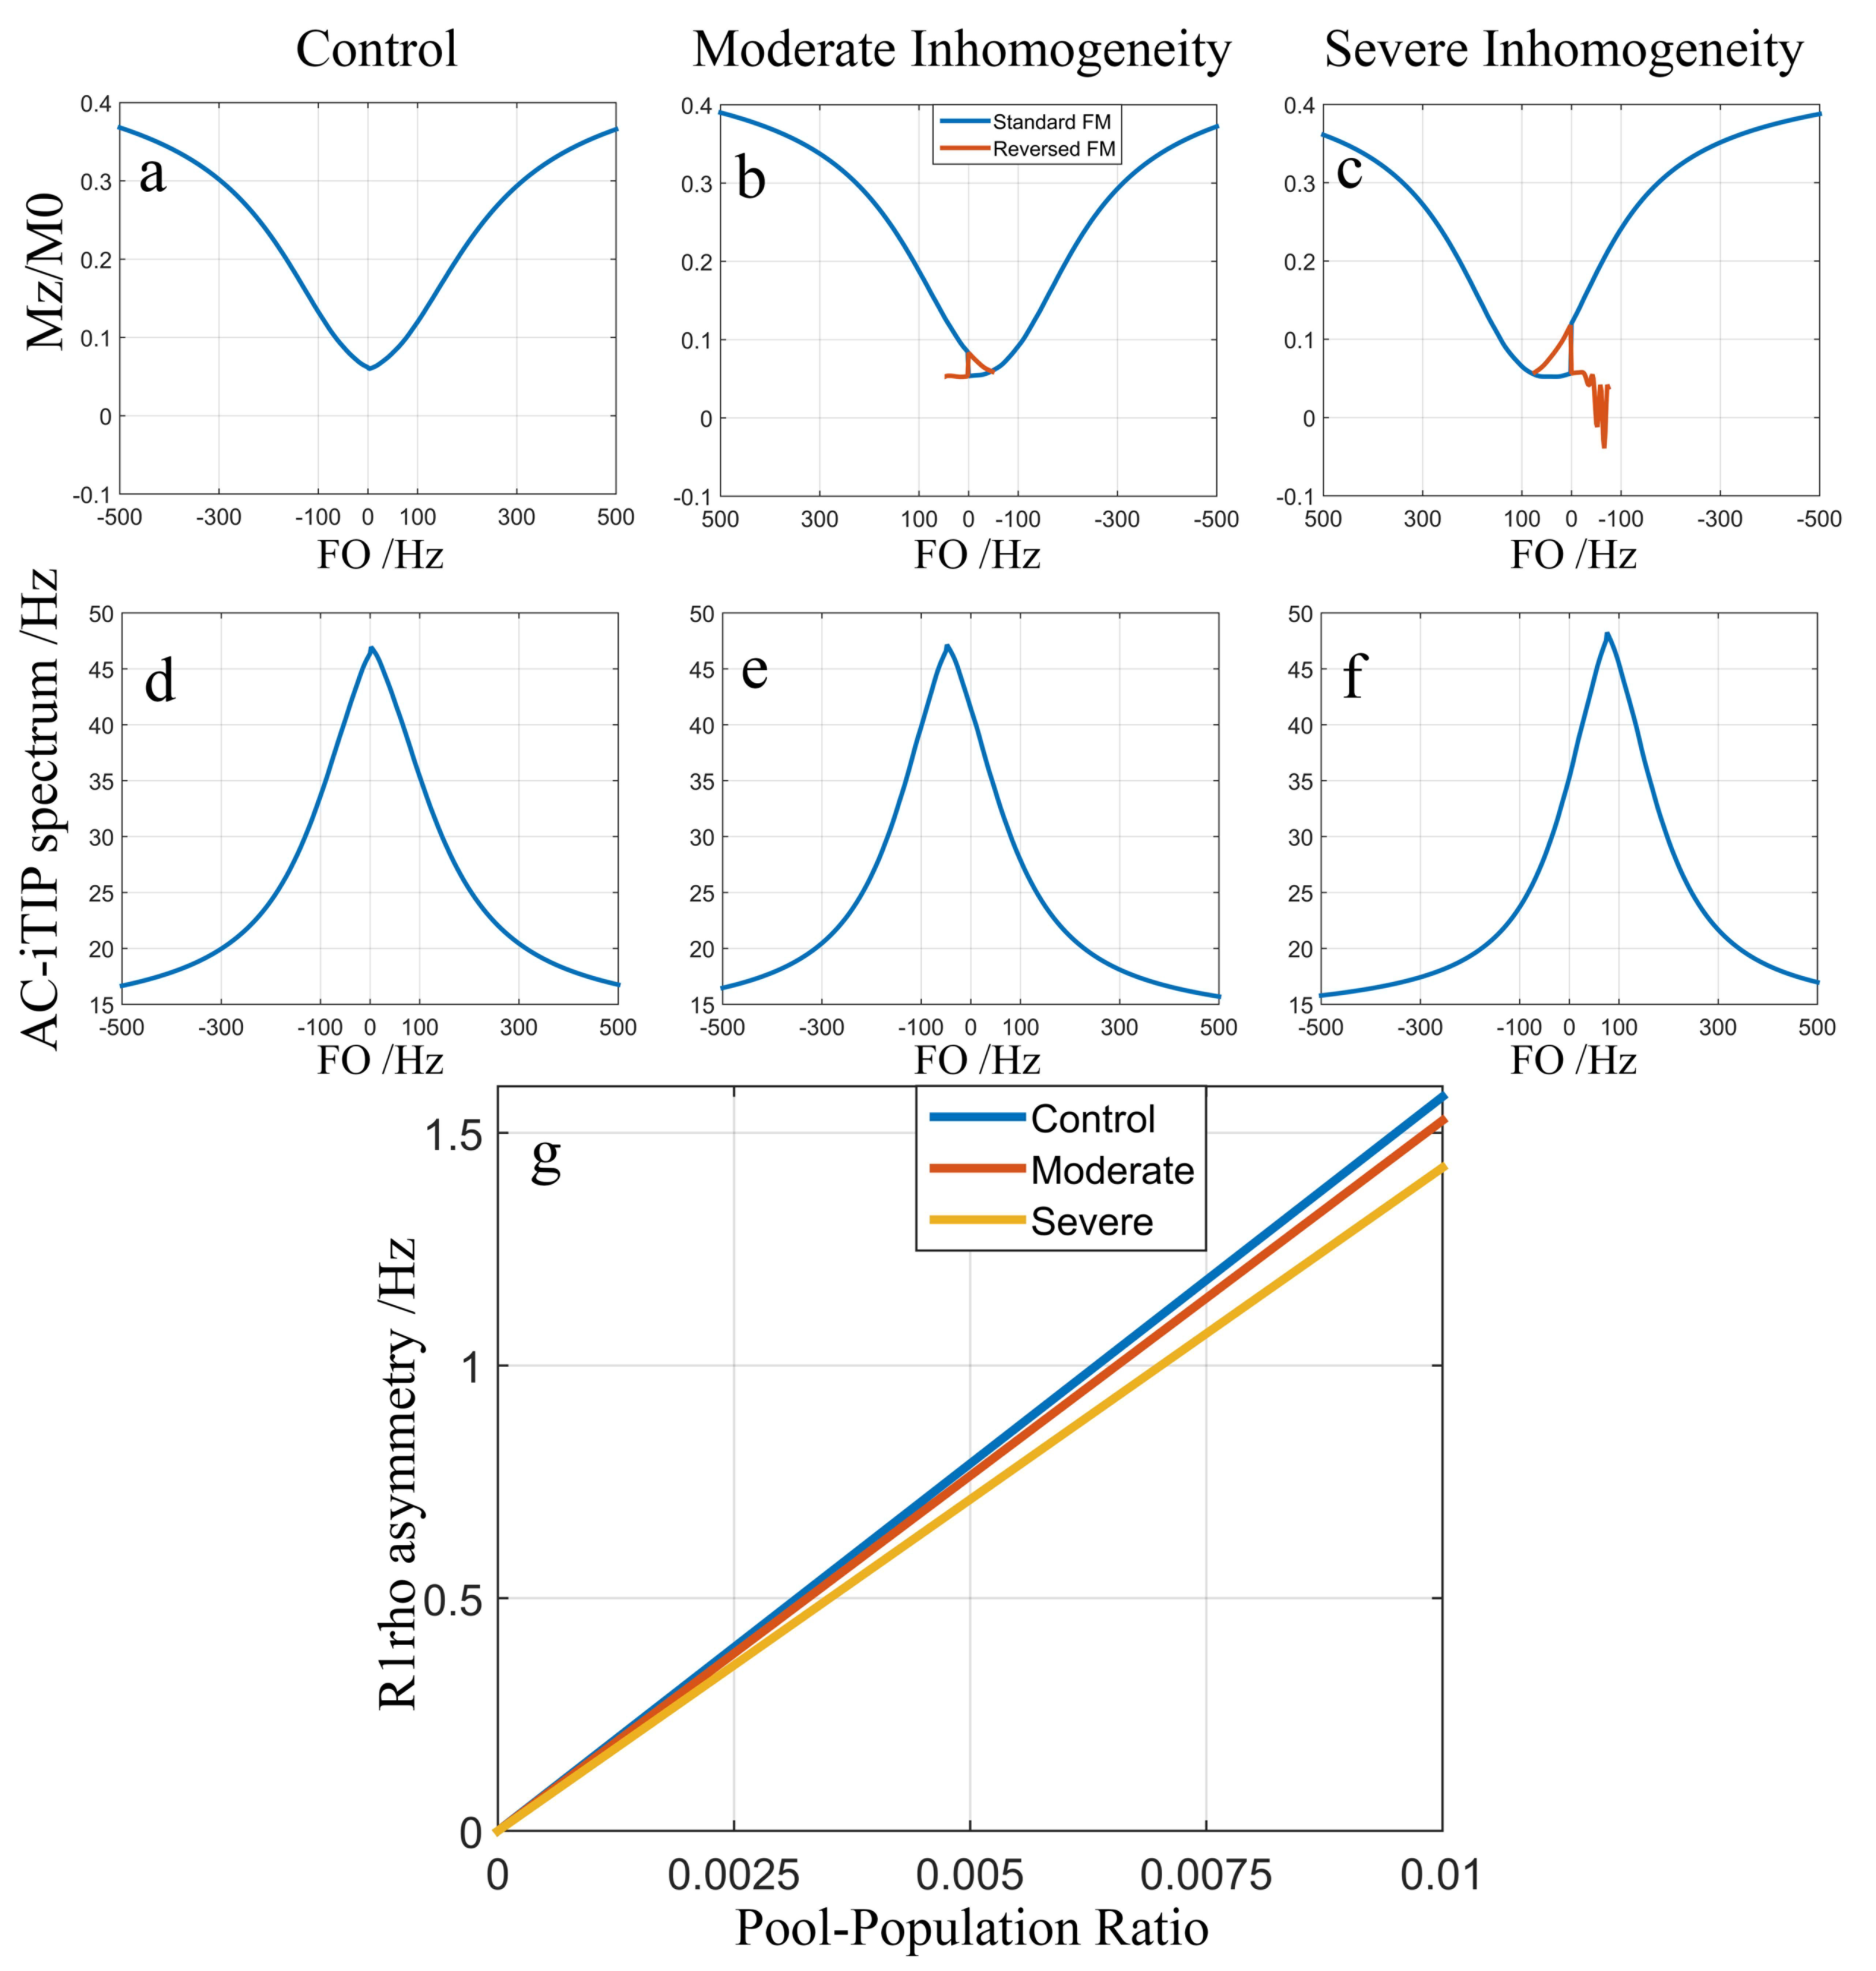
Figure 3. Simulation
results. Top row (a, b, and c): Z-spectrums obtained using ACCSL. Blue lines correspond to the Z-spectrum simulated using the standard FM, red lines correspond to the data simulated using the reversed FM. Note that the
discontinuity in (b) and (c) can be corrected by the red lines. Second row (d,
e, and f): R1rho-spectrums after correction. The spectrums shown in (a)–(f)
were simulated using pool-population ratio of 0.01. (g): R1rho asymmetries at a range of pool-population ratio under the control (blue), moderate (red), and severe inhomogeneities(yellow).
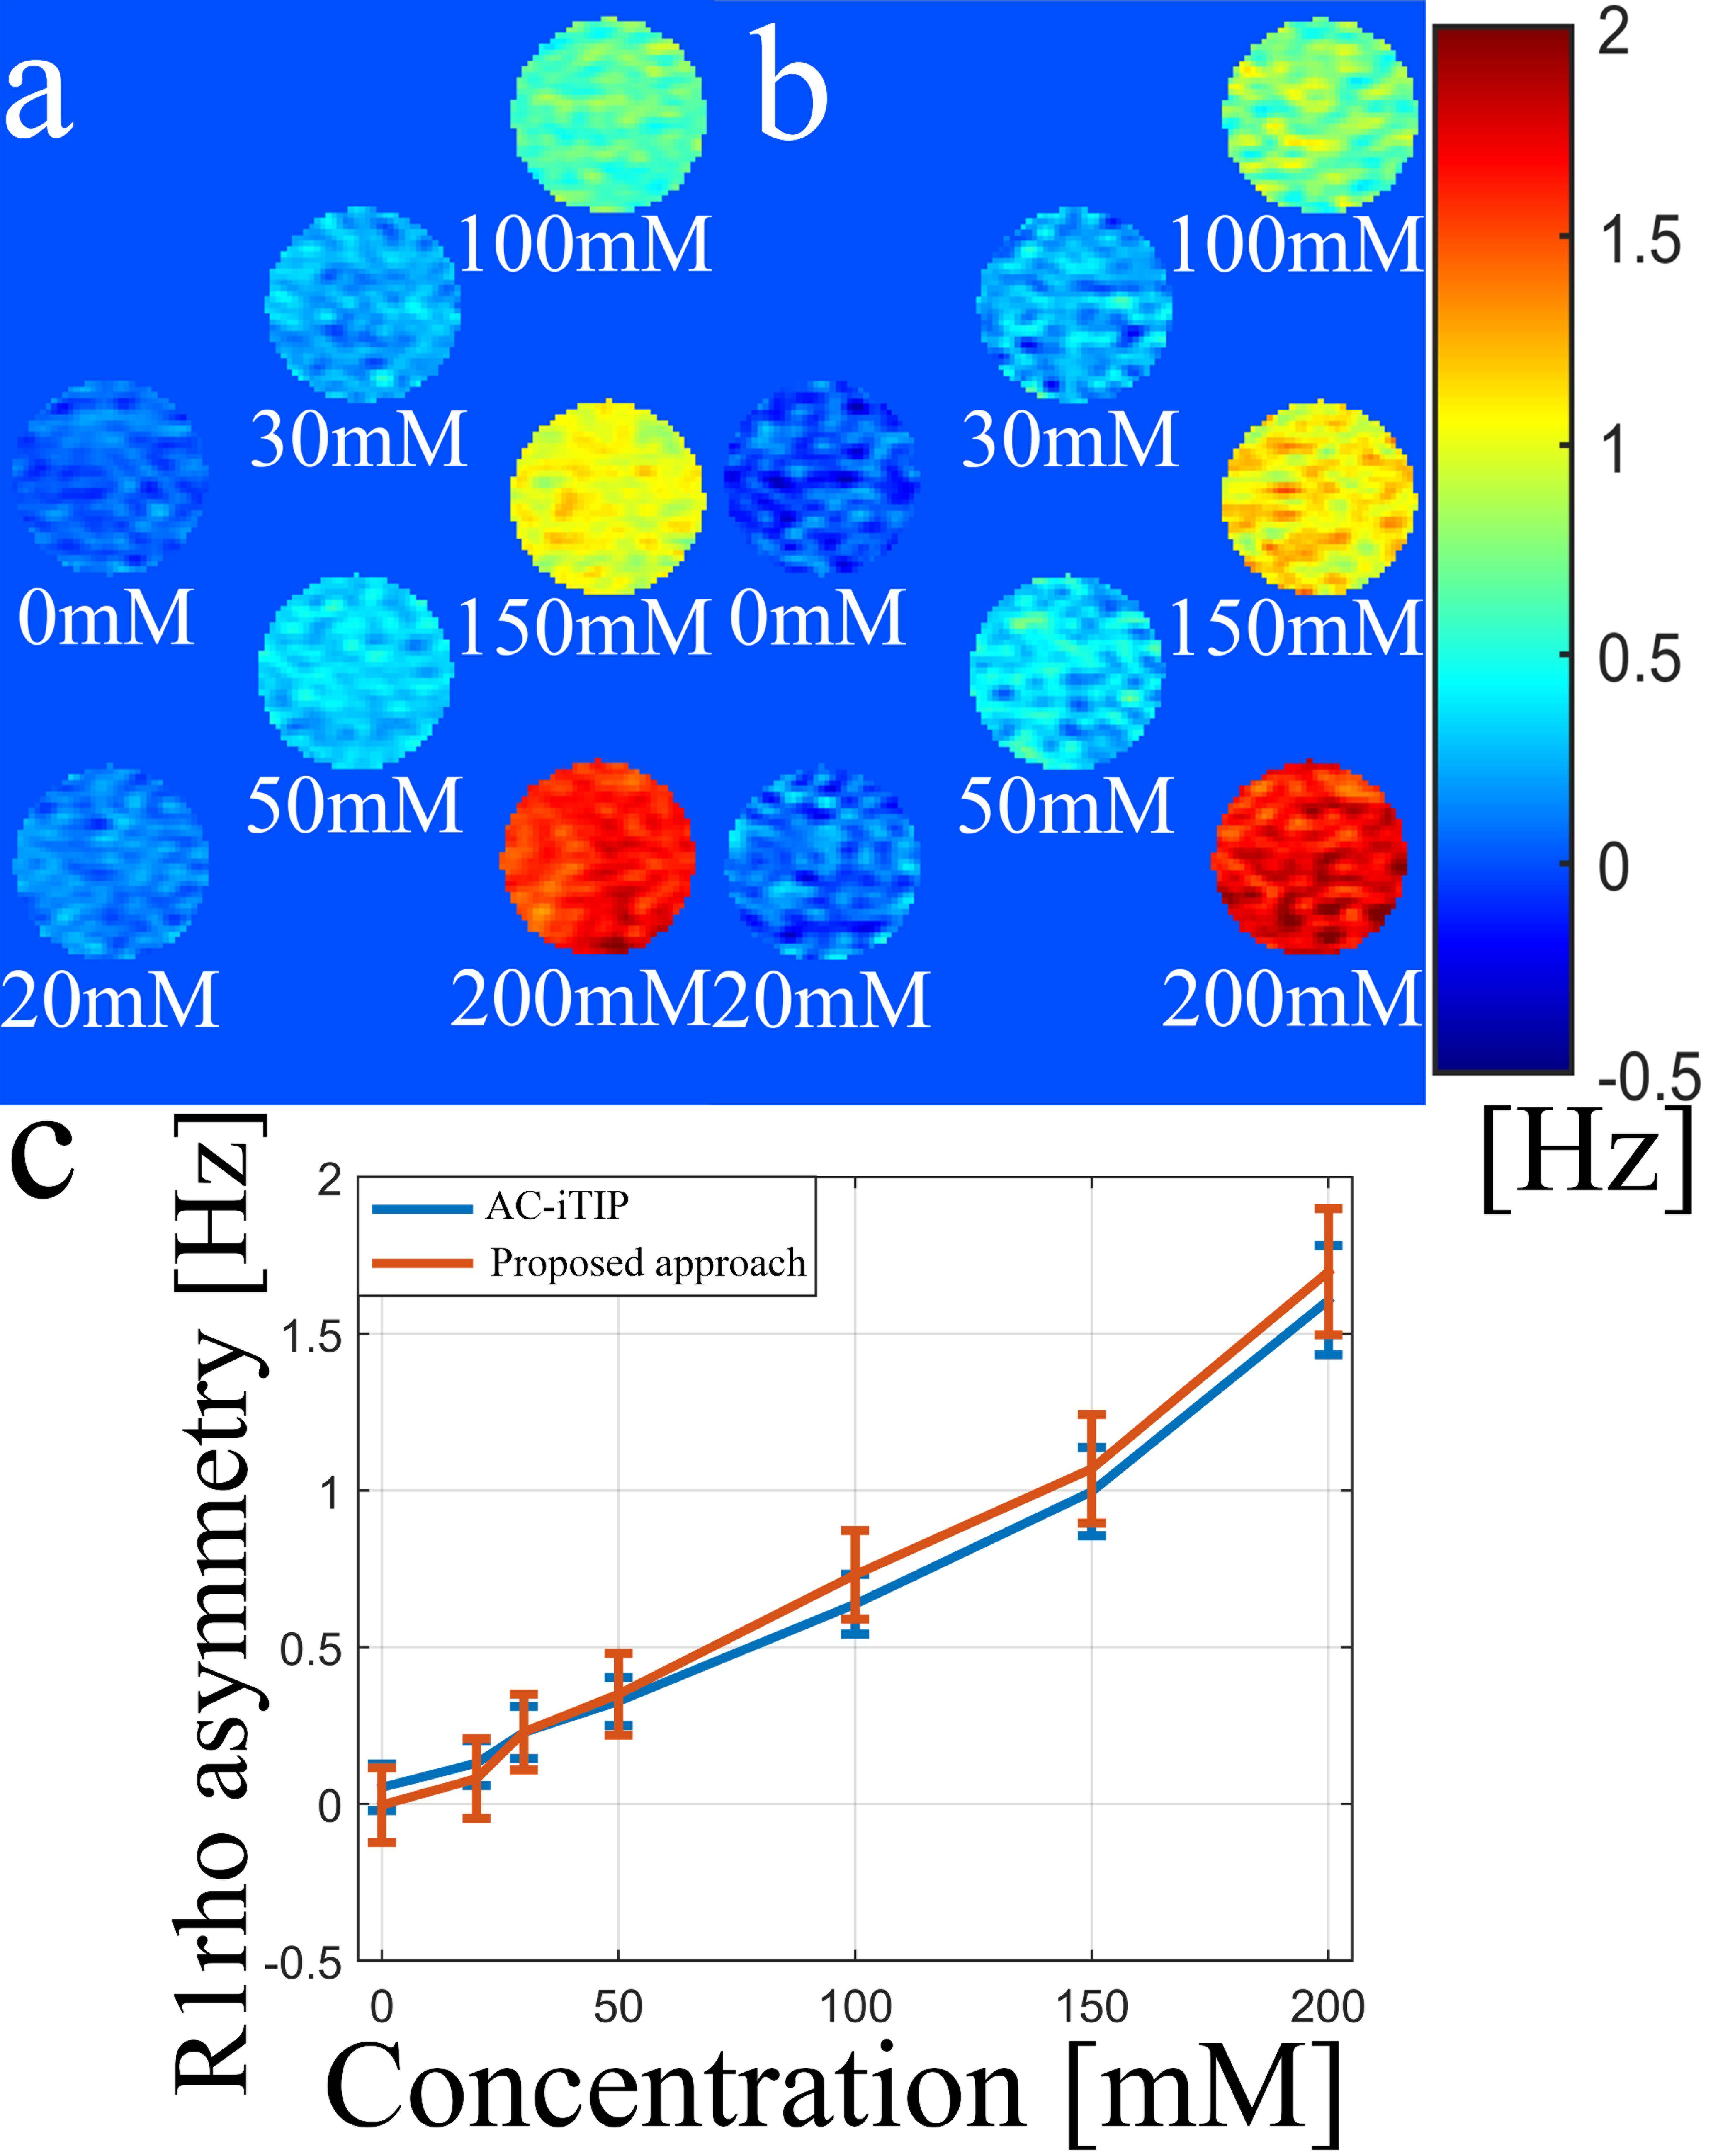
Figure 4. Quantitative R1rho asymmetry map of myo-inositol
obtained using (a) AC-iTIP and (b) proposed approach. (c) Line plot of the
averaged R1rho asymmetry within each ROI versus the myo-inositol
concentrations. The error bars represent the standard deviations.
Figure 5. R1rho asymmetry map of in vivo articular
cartilage obtained using (a) AC-iTIP, and (b) proposed approach.