3231
Multiparameter mapping of T2, R2*, fat fraction using a combination of chemical shift imaging and phase-based T2 mapping1Radiology, University of Wisconsin-Madison, Madison, WI, United States, 2Medical Physics, University of Wisconsin-Madison, Madison, WI, United States, 3Biomedical Engineering, University of Wisconsin-Madison, Madison, WI, United States, 4Medicine, University of Wisconsin-Madison, Madison, WI, United States, 5Emergency Medicine, University of Wisconsin-Madison, Madison, WI, United States
Synopsis
A new multi-parameter method for quantitative mapping of T2, R2*, and fat fraction using CSE-MRI combined with phase-based T2 mapping was developed. This method can be performed using the RF phase-modulated gradient echo sequences that encode T2 information into the phase of the steady-state signal. A phantom study demonstrating the ability of this approach to obtain 3D high-resolution quantitative maps in reasonable acquisition time.
Introduction
Quantitative mapping in the abdomen is emerging as a means of evaluating diffuse liver disease and focal liver lesions. Chemical shift encoded MRI (CSE-MRI) is widely used for estimating the fat fraction and R2*, which are well established as biomarkers of steatosis and iron overload, respectively1,2. T2 mapping has broad applications in the assessment of iron concentration3, inflammation4, and fibrosis5. However, T2 mapping is generally performed without water-fat separation, which may lead to bias when fat is present. In addition to this, multiple acquisitions, which extends scan time, is required for multi-parameter mappings.Recently, a phase-based T2 mapping approach has been proposed to achieve rapid 3D high-resolution quantitative T2 maps6. This method can be performed using the RF phase-modulated gradient echo sequences that encode T2 information into the phase of the steady-state signal.
In this study, we propose a novel approach to perform joint parameter mapping of T2, R2*, and fat fraction using CSE-MRI combined with phase-based T2 mapping. The feasibility of this method was evaluated using iron-fat phantoms, demonstrating the ability of this approach to obtain 3D high-resolution quantitative maps in reasonable acquisition time.
Methods
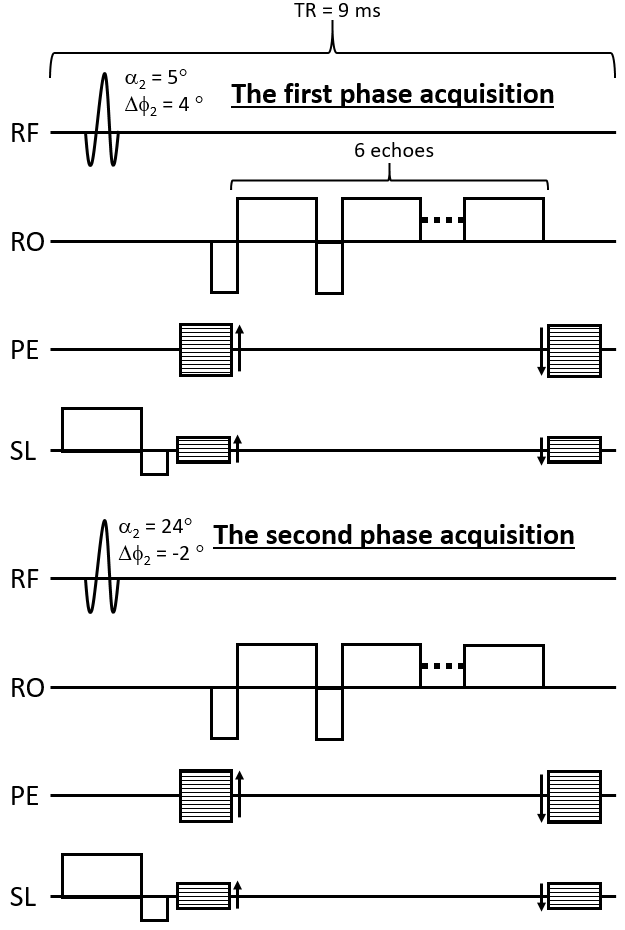
T2 was estimated using two GRE datasets acquired with different transmit RF-phase increments ($$$\Delta \phi_1$$$ and $$$\Delta \phi_2$$$) and flip angles (α1 and α2). The relationship between $$$\Delta \phi$$$ and the phase θ of the steady-state signal of GRE for a specific T1 and T2 can be expressed by the following equation6.$$\theta(\Delta \phi_1, \Delta \phi_2, \alpha, TR;T1,T2)=\angle S_1 (\Delta \phi_1, \alpha_1, TR;T1,T2) - \angle S_2 (\Delta \phi_2, \alpha_2, TR;T1,T2)$$
where S1 and S2 are a steady-state signal of the first and second acquisition, respectively. In case of longer T1 (T1 > 1000 ms), θ becomes relatively insensitive to T1, thus T2 can be estimated from the difference of phase of these two GRE datasets6. T2 estimation is then performed using lookup tables calculated using Bloch equation simulations.
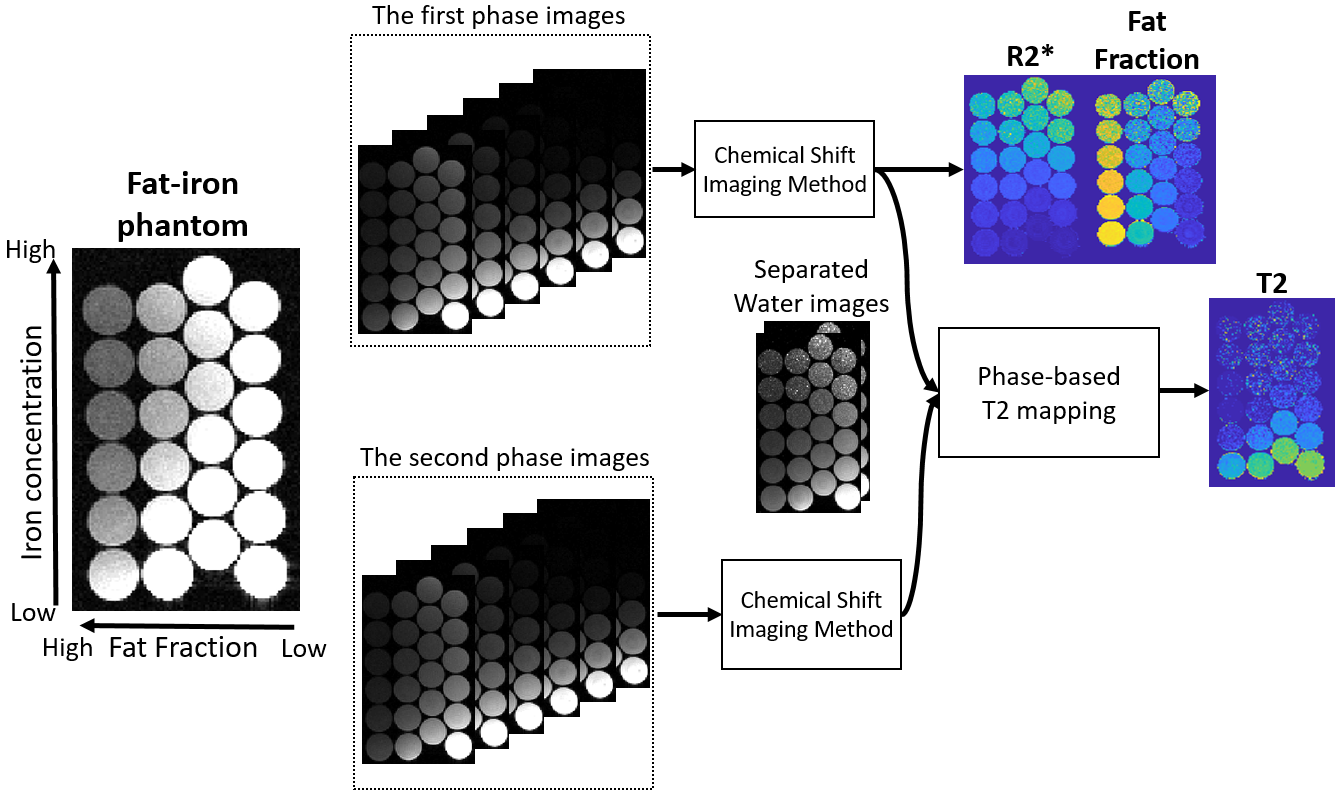
Each acquisition performed two consecutive six-echo CSE-MRIs to separate water and fat components, as shown in Fig. 1. Acquisition parameters included: TR = 9.0 ms, TE1/DTE = 1.4/1.1 ms, matrix size = 256×224×32, FOV = 30×30×9.6 cm3, $$$\Delta \phi_1$$$ = 4°, $$$\Delta \phi_2$$$ = -2°, α1 = 5°, and α2 = 24°. Each phase dataset was reconstructed using CSE-MRI with multi-peak spectral modeling of fat2. Phase-based T2 mapping was then applied to the separated water images using the phase-based method. The dataset acquired with the flip angle of 5° was used to calculate fat fraction and R2* to avoid T1 bias.
We conducted phantom experiments to validate the quantitative values estimated using our approach, as shown in Fig. 2. Multi-TR/TE STEAM and CSE-MRI (IDEAL-IQ, GE Healthcare, Waukesha, WI) acqquisitions were used to obtain T2 of water, R2*, and fat fraction for comparison. A fat-iron phantom was built, including 24 vials filled with agar-gel with vegetable oil and iron microspheres mimicking the simultaneous presence of various levels of fat and iron deposition in tissue7. The acquisition was performed on a 3.0T clinical MRI system (Premier, GE Healthcare, Waukesha, WI) with a 48-channel head coil.
Results
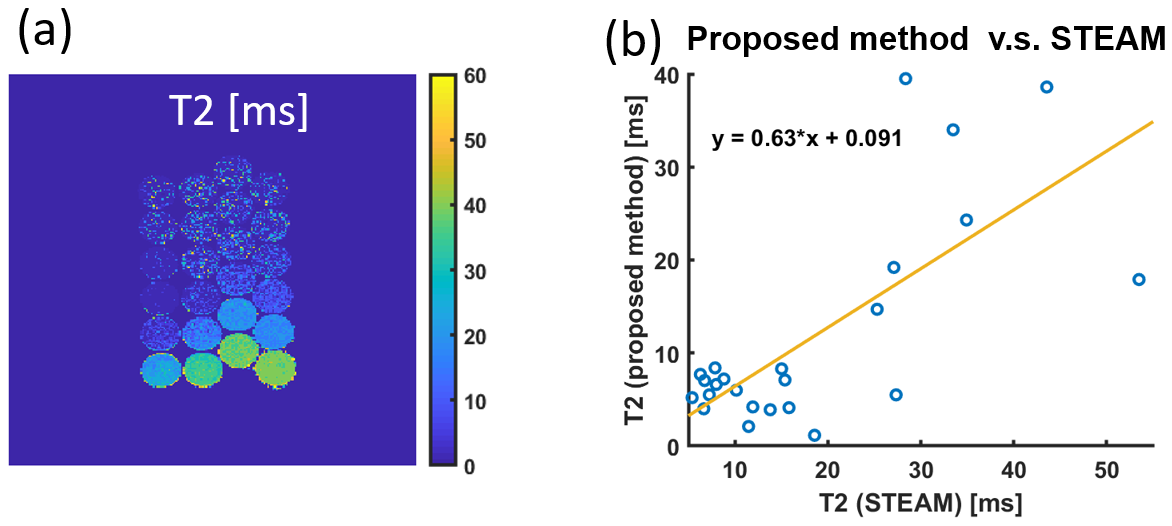
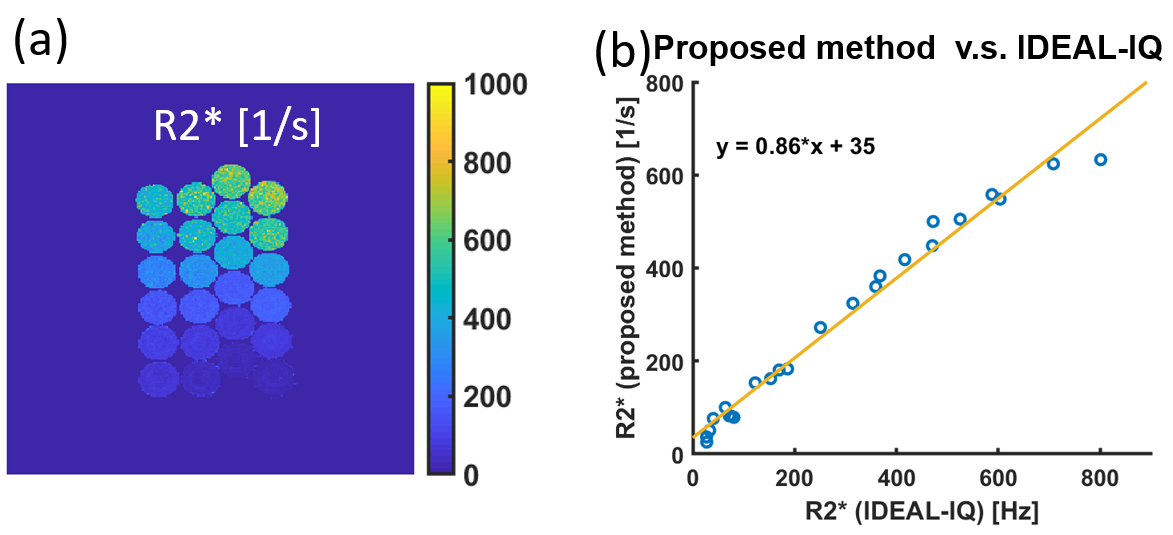
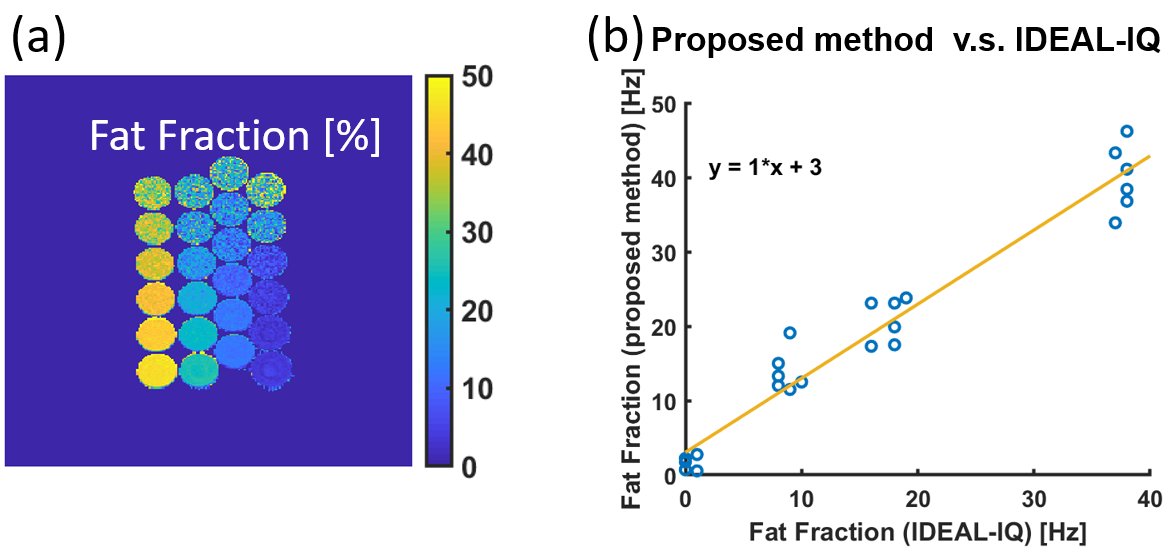
T2 of water, R2*, and fat fraction results are shown in Fig. 3-5. T2 values estimated using the proposed method showed moderate correlation (R2 = 0.52) with those estimated using STEAM, although underestimation relative to STEAM was observed, as shown in Fig. 3(b). Strong correlations in R2* (R2 = 0.98) and fat fraction (R2 = 0.95) were seen between the proposed method and IDEAL-IQ. R2* values were slightly underestimated using the proposed method, as shown in Fig. 4(b).Discussion
In this work we have developed the new multi-parameter method for quantitative mapping of T2, R2*, and fat fraction using CSE-MRI combined with phase-based T2 mapping. The phantom study was conducted to compare the quantitative values estimated using the proposed method with those estimated by conventional methods.In the phantom experiment, correlation in T2 was lower than for R2* and fat fraction. The T1 is known to affect the performance of the estimation. For the simplicity of the estimation, we assumed the fixed T1 of 1500 ms for the lookup table in this study. We hypothesize that additional T1 mapping may improve accuracy of the phase-based T2 mapping method. B1 inhomogeneity and RF slice profile are also important factors that will be considered in future work.
Fat fraction values were also biased compared to those estimated using the IDEAL-IQ. The flip angle (5°) was slightly higher than typically used with conventional IDEAL-IQ (3°). A steady-state signal using a higher flip angle becomes T1-weighted; thus, the apparent fat fraction decreased as iron concentration, which shortens T1, increases. Using a lower flip angle is a simple solution for this problem, although it may degrade T2 estimation performance.
Conclusion
In this study, a novel mapping method for simultaneous T2, R2*, and fat fraction was proposed using the combination of CSE-MRI with phase-based T2 mapping. The experimental study using the iron-fat phantoms demonstrated the feasibility of our method, although underestimation of T2 was observed using the proposed method.Acknowledgements
We wish to acknowledge support from the NIH (R01 DK083380, R01 DK088925, K24 DK102595) and from the University of Wisconsin SEED grant program. Further, we wish to acknowledge GE Healthcare and Bracco Diagnostics who provides research support to the University of Wisconsin. Finally, Dr. Reeder is a Romnes Faculty Fellow, and has received an award provided by the University of Wisconsin-Madison Office of the Vice Chancellor for Research and Graduate Education with funding from the Wisconsin Alumni Research Foundation.References
1. Reeder, Scott B., et al. "Multicoil Dixon chemical species separation with an iterative least‐squares estimation method." Magnetic Resonance in Medicine: An Official Journal of the International Society for Magnetic Resonance in Medicine 51.1 (2004): 35-45.
2. Yu, Huanzhou, et al. "Multiecho water‐fat separation and simultaneous R estimation with multifrequency fat spectrum modeling." Magnetic Resonance in Medicine: An Official Journal of the International Society for Magnetic Resonance in Medicine 60.5 (2008): 1122-1134.
3. ‐.St. Pierre, Timothy G., "Measurement and mapping of liver iron concentrations using magnetic resonance imaging." Annals of the New York Academy of Sciences 1054.1 (2005): 379-385.
4. Thavendiranathan, Paaladinesh, et al. "Improved detection of myocardial involvement in acute inflammatory cardiomyopathies using T2 mapping." Circulation: Cardiovascular Imaging
5.1 (2012): 102-110. 5. Luetkens, Julian A., et al. "Quantification of liver fibrosis at T1 and T2 mapping with extracellular volume fraction MRI: preclinical results." Radiology 288.3 (2018): 748-754.
6. Wang, Xiaoke., et al. “A Novel Phase Based T2 Mapping Technique Using Gradient Echo Imaging” ISMRM (2019): 0942 7. Zhao, Ruiyang., et al. “A Quantitative MRI Phantom to Mimic the Simultaneous Presence of Fat, Iron, and Fibrosis” ISMRM (2019): 1777
Figures