3229
Optimized fast fat-fraction mapping in the knee using Signal Profile Asymmetries for Robust multi-Compartment Quantification (SPARCQ)1Department of Diagnostic and Interventional Radiology, Lausanne University Hospital (CHUV) and University of Lausanne (UNIL), Lausanne, Switzerland, 2Department of Physics, Ecole Polytechnique Fédérale de Lausanne (EPFL), Lausanne, Switzerland, 3Advanced Clinical Imaging Technology, Siemens Healthcare AG, Lausanne, Switzerland, 4LTS5, Ecole Polytechnique Fédérale de Lausanne (EPFL), Lausanne, Switzerland
Synopsis
The Signal Profile Asymmetries for Robust multi-Compartment Quantification (SPARCQ) framework was recently developed and used to quantify water and fat content in tissues. Applying SPARCQ on bSSFP signal profiles obtained from phase-cycled acquisitions provided reliable fat fractions with a total scan time of 20:21min at low resolution. In this study, SPARCQ was accelerated and optimized for water-fat separation using numerical simulations and in vivo experiments to obtain a clinically acceptable protocol. Images and fat-fraction maps of knees at an isotropic resolution of (1.25mm)3 were obtained with a scan time of 7:12min.
Introduction
Phase-cycled balanced Steady-State Free-Precession (bSSFP) acquisitions can be used to sample bSSFP profiles, the steady-state magnetization as function of the RF phase angle. The recently developed “Signal Profile Asymmetries for Robust multi-Compartment Quantification” (SPARCQ)[1] framework enabled quantification of fat and water content using asymmetries[2] in bSSFP profiles. In prior work[1], 37 low-resolution scans were performed to sample the profile in 20min. This work aims at accelerating the SPARCQ framework and improving signal encoding to maximize the accuracy of fat-water separation with an improved resolution.Methods
TR optimization to maximize SPARCQ sensitivity for fat-water separationIn bSSFP, the magnetization vector precesses during the repetition time TR and accumulates a precession angle $$$\Phi$$$ depending on the off-resonance frequency $$$f$$$: $$\Phi=2\pi f\text{TR}$$
Depending on TR, water ($$$f=0$$$Hz) and fat ($$$f=-440$$$Hz) signals may have the same $$$\Phi$$$ and thus overlap (Figure 1A). The bSSFP signals of water and fat as a function of $$$\Phi$$$ display a periodic behaviour[3] (Figure 1AB) and their precession angle $$$\Phi$$$ as function of TR is wrapped into the range $$$[0;2\pi]$$$. Water and fat peaks accordingly wrap into the corresponding frequency range $$$[0;1/\text{TR}]$$$, with respective relative frequencies $$$f_{W,\textit{rel}}$$$ and $$$f_{F,\textit{rel}}$$$ such that: $$f_{rel}=\Phi_{[0;2 \pi]}/ 2\pi\text{TR}$$ The relative distance between the wrapped peaks was calculated as $$$\Delta f_{peak}=f_{F,\textit{rel}} – f_{W,\textit{rel}}$$$. The optimal TR was defined as the shortest TR which maximizes $$$\Delta f_{peak}$$$. To determine the effect of TR on fat-fraction quantification, spectra containing water and fat resonances with varying fat fractions FF were generated, then Bloch simulations[4] were performed to obtain bSSFP profiles, with TR $$$\in [3;11]$$$ms and T1/T2 = 5. Fat fractions were extracted from the frequency spectra fitted by the SPARCQ prototype framework[1]. The difference between simulated and estimated fat fraction was calculated.
Minimization of phase-cycled acquisitions
Simulations: The effect of reducing the amount of phase-cycles $$$N_{\phi}$$$ on SPARCQ fat-fraction estimation was tested numerically. bSSFP profiles were simulated[4] using $$$f \in [-600;200]$$$ Hz, T1/T2 = 5, FF $$$\in [0;1]$$$ and TR = 3.41ms. After noise addition (with signal-to-noise ratio SNR $$$\in [1;100]$$$), the fat fraction was estimated with SPARCQ. The error between simulated and estimated fat fraction was calculated for $$$N_{\phi} \in [2;37]$$$.
In vivo imaging: The effect of $$$N_{\phi}$$$ reduction on fat quantification was tested in knee images of three volunteers. Phase-cycled bSSFP acquisitions were performed at a 3T clinical scanner (MAGNETOM, Prismafit, Siemens Healthcare, Erlangen, Germany). 72 phase-cycled scans were acquired with 5° RF phase increments and sub-sampled into 36 subsets of length $$$N_{\phi} \in [2;37]$$$. Fat fractions were estimated in each subset. 25-pixel-wide regions of interest (ROI) were selected in bone marrow, muscle, and sub-cutaneous fat compartments. Within each ROI, the mean and standard deviation of the fat fraction were computed and compared to the fully sampled acquisition. A reference, low-resolution, non-accelerated protocol[1] was compared to the proposed protocol in one volunteer. The proposed protocol incorporated parallel imaging (GRAPPA[5]) to further enhance the acceleration. Sequence parameters are summarized in Figure 5D.
Results
The maximum relative distance between fat and water signals occurs when $$$\Delta \Phi = k\pi$$$, $$$k \in ℕ$$$ (Figure 1C) and TR = 3.41ms. Similarly, the quantification error follows a periodic pattern (Figure 2). Regions where fat-fraction quantification fails correspond to TR values yielding a similar precession angle for water and fat, i.e. where the profiles are nearly identical. A SNR ≥ 30 resulted in a consistent estimation when $$$N_{\phi}$$$ is reduced (Figure 3). Relatively small errors were observed for 16 ≤ $$$N_{\phi}$$$ ≤ 37 (Figure 3). This was corroborated in vivo, where a consistent standard deviation within each ROI was observed when $$$N_{\phi}$$$ is reduced to 16 (Figure 4). Comparing the long low-resolution protocol with the short high-resolution protocol shows that fat fractions were the same (Figure 5). Due to a misclassification of the fat peak, a signal void can be observed in the patella for both acquisitions (Figure 5).Discussion
The SPARCQ framework for water-fat separation is TR sensitive and optimal TRs can be chosen from the analysis of the bSSFP profiles by maximizing the relative distance $$$\Delta f_{peak}$$$. This is an important consideration for the use of slab-selective RF excitation pulses, or for changing the magnetic field strength. Agreement between numerical simulations and in vivo experiments indicates that a simple reduction to 16 phase cycles provides sufficient data for SPARCQ to resolve water and fat. Further acceleration could be achieved with compressed sensing[6,7]. With SPARCQ a frequency spectrum is obtained in each voxel that is independent from field inhomogeneities[1]. However, the current SPARCQ framework assigns water or fat depending on which peak is closest to on-resonance (Figure 5C). This caused the misclassification of bone marrow in the patella as water (Figure 5). Using the peak shape, in conjunction with its location, may be more suitable to classify fat and is currently being investigated.Conclusion
The SPARCQ framework to separate and quantify water and fat was optimized in terms of TR and accelerated to a total acquisition time of 7:12min with an isotropic resolution of (1.25mm)3. Simulations and in vivo experiments demonstrated the accuracy of fat-fraction quantification with the proposed accelerated SPARCQ framework.Acknowledgements
This study was supported by funding from the Swiss National Science Foundation (grant number PZ00P3_167871), the Emma Muschamp foundation, and the Swiss Heart foundation.References
[1] Rossi, Giulia M.C. A new approach to water fat separation in magnetic resonance imaging (MSc thesis) Ecole Polytechnique Fédérale de Lausanne (EPFL) (2019)
[2] Miller, K. L. Asymmetries of the balanced SSFP profile. Part I: theory and observation. Magnetic Resonance in Medicine: An Official Journal of the International Society for Magnetic Resonance in Medicine 63.2 pp.385-395 (2010)
[3] Bieri, Oliver and Scheffler, Klaus. Fundamentals of Balanced Steady State Free Precession MRI. Journal of Magnetic Resonance Imaging 38:2–11(2013)
[4] Hargreaves, Brian. Bloch Simulator, MRI Tools. http://mrsrl.stanford.edu/~brian/bloch
[5] Griswold, Mark A. et al. Generalized autocalibrating partially parallel acquisitions (GRAPPA). Magnetic Resonance in Medicine: An Official Journal of the International Society for Magnetic Resonance in Medicine 47.6: 1202-1210 (2002)
[6] Çukur, Tolga. Accelerated phase-cycled SSFP imaging with compressed sensing. IEEE transactions on medical imaging 34.1: 107-115 (2014)
[7] Lustig, Michael et al. Compressed sensing MRI. IEEE signal processing magazine 25.2: 72 (2008)
Figures
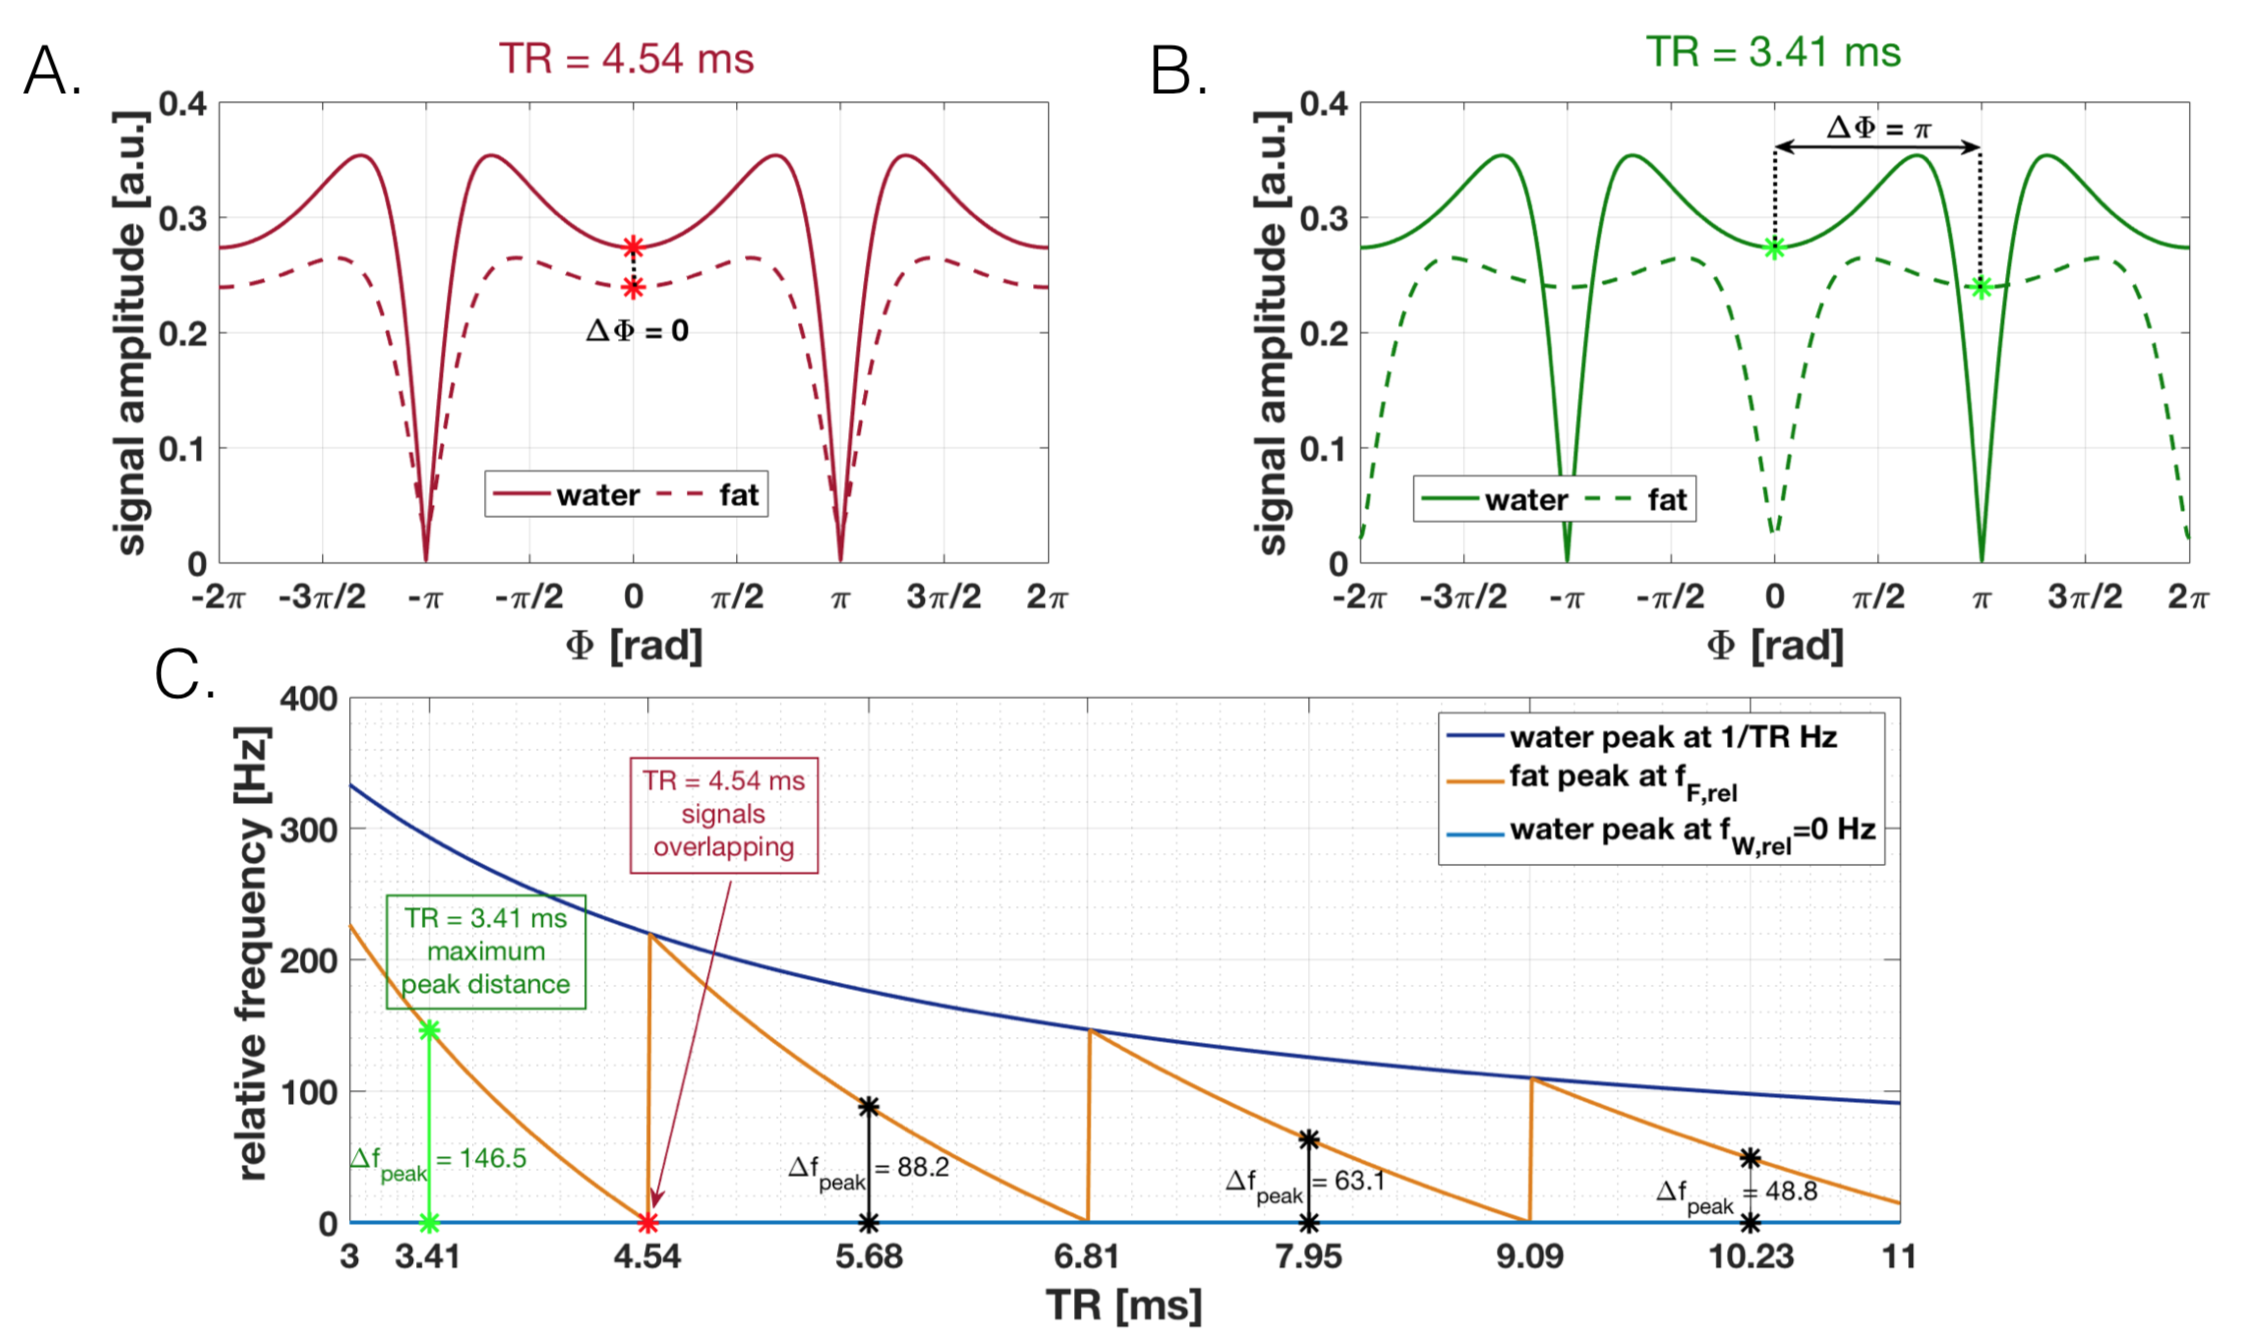
Figure 1
Top: Amplitude of the steady-state transverse magnetization vector as a function of the precession angle $$$\Phi$$$ accumulated during a TR of 4.54ms (A) and 3.41ms (B). Water is assumed to be on-resonance. Asterisks indicate the points at which peaks are read out. Bottom (C): Relative distance between the water and fat peaks wrapped into a 1/TR period. A TR that maximizes the distance $$$\Delta f_{peak}$$$ corresponds to a difference in precession angle $$$\Delta \Phi = k\pi, k \in ℕ$$$ (green). A TR choice for which signals overlap correspond to $$$\Delta \Phi = 0$$$ (red).
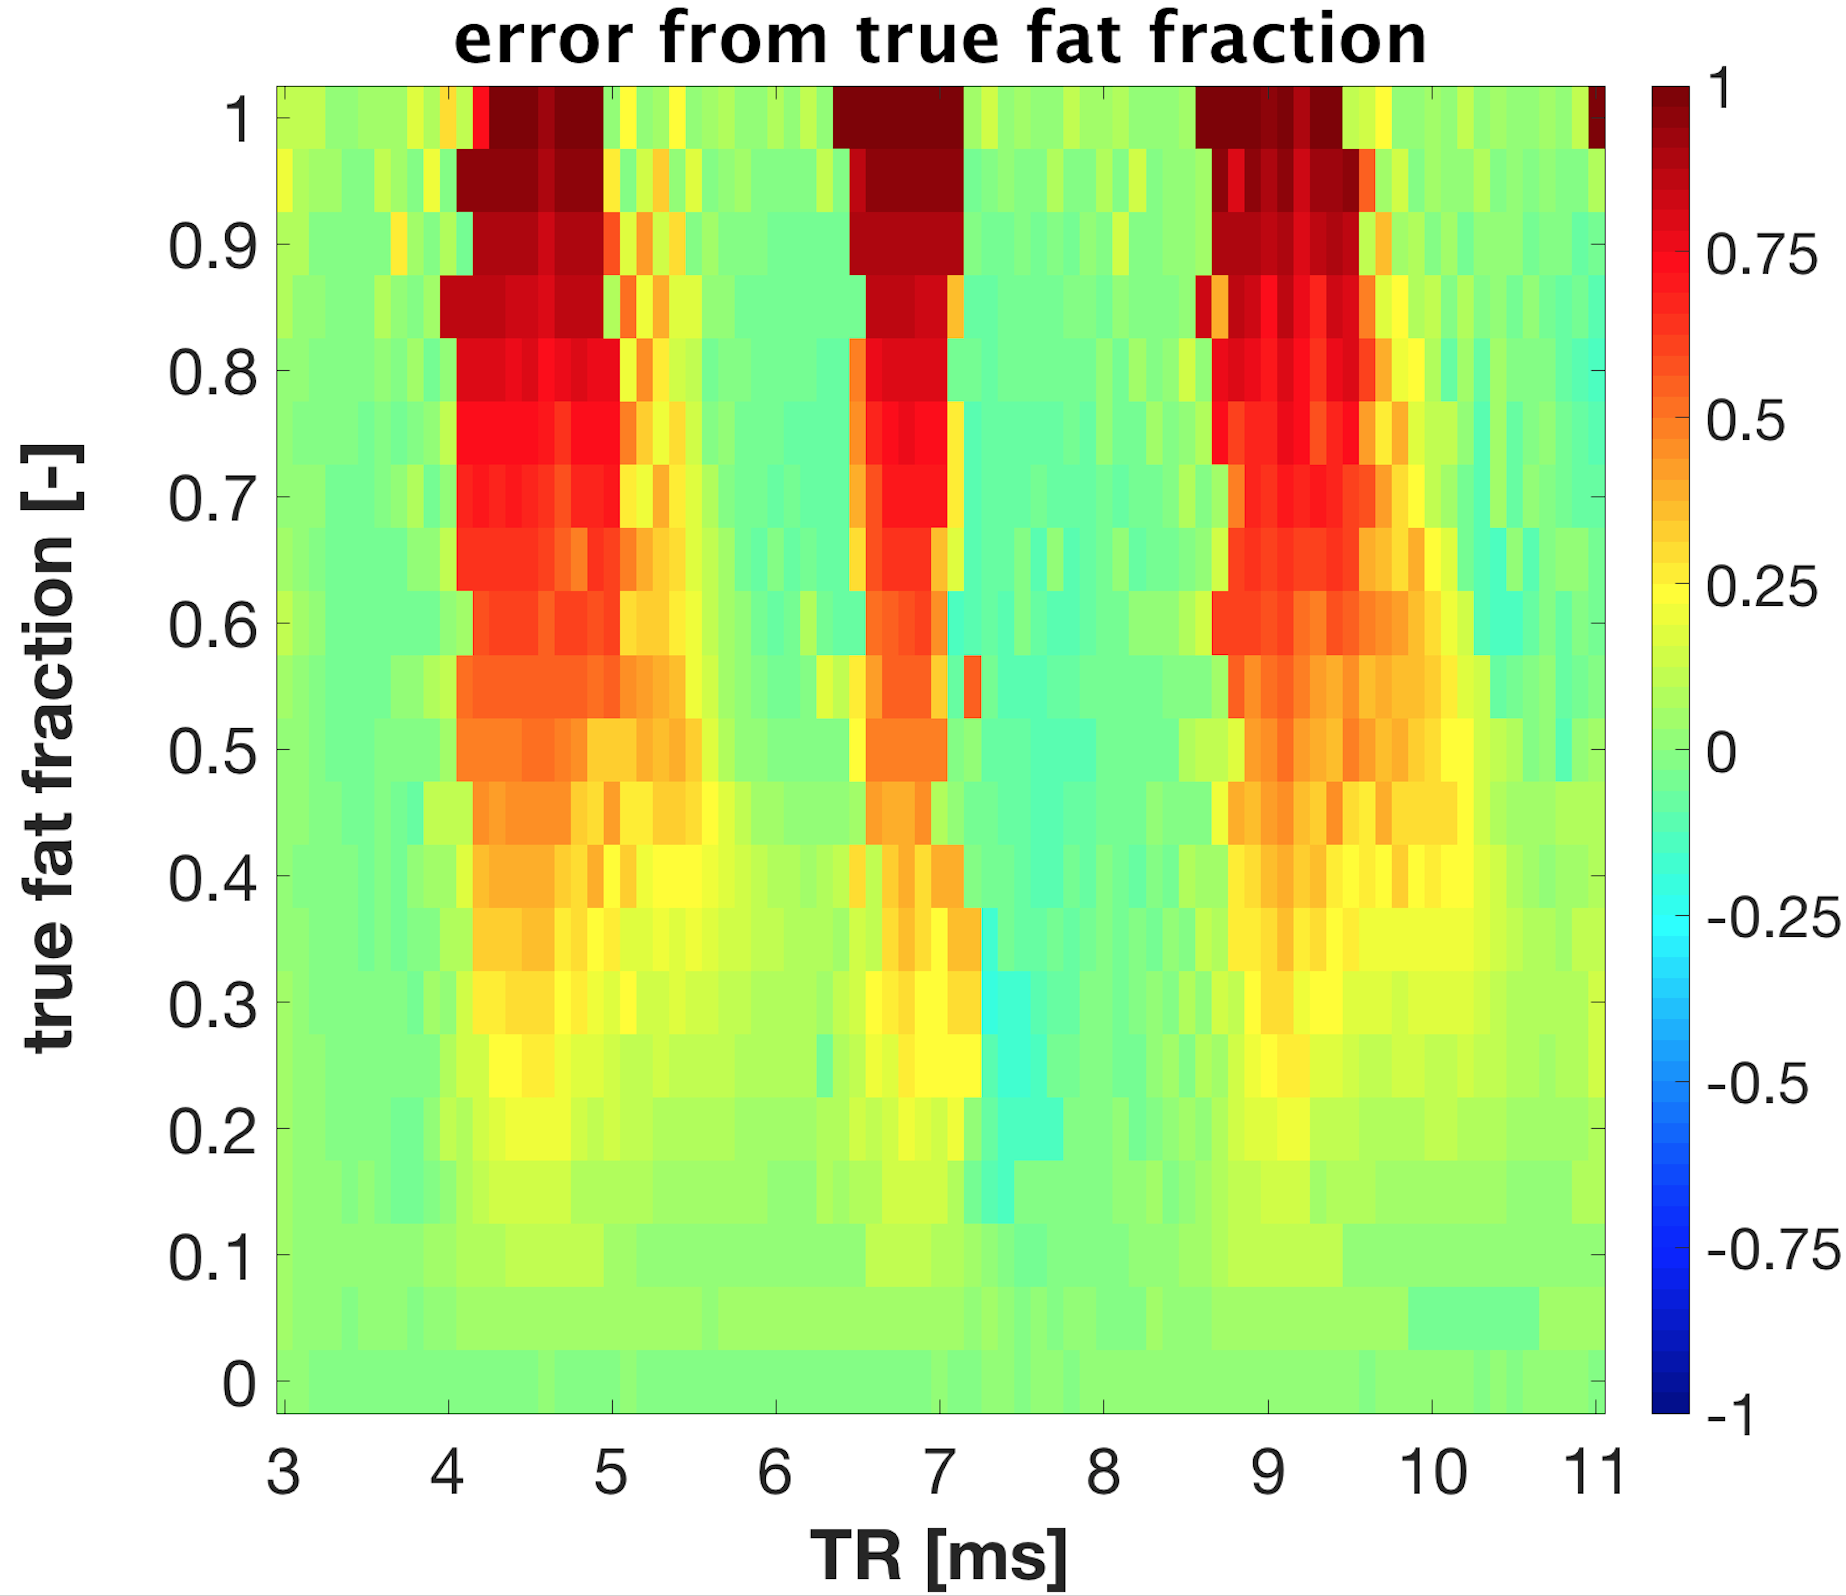
Figure 2
Error between the simulated fat fraction and the estimated fat fraction quantified by SPARCQ as a function of TR. A periodic behaviour can be observed. The error is highest for those TR values where $$$\Phi$$$ is nearly equal for both water and fat, i.e. where their bSSFP profiles are similar. The SPARCQ framework favors the estimation of the on-resonance component, i.e. water. For non-optimized TRs fat may be wrongly classified as water and this effect becomes more pronounced for higher fat fractions. Conversely, watery tissues (FF<0.25) will be correctly estimated for all TRs.
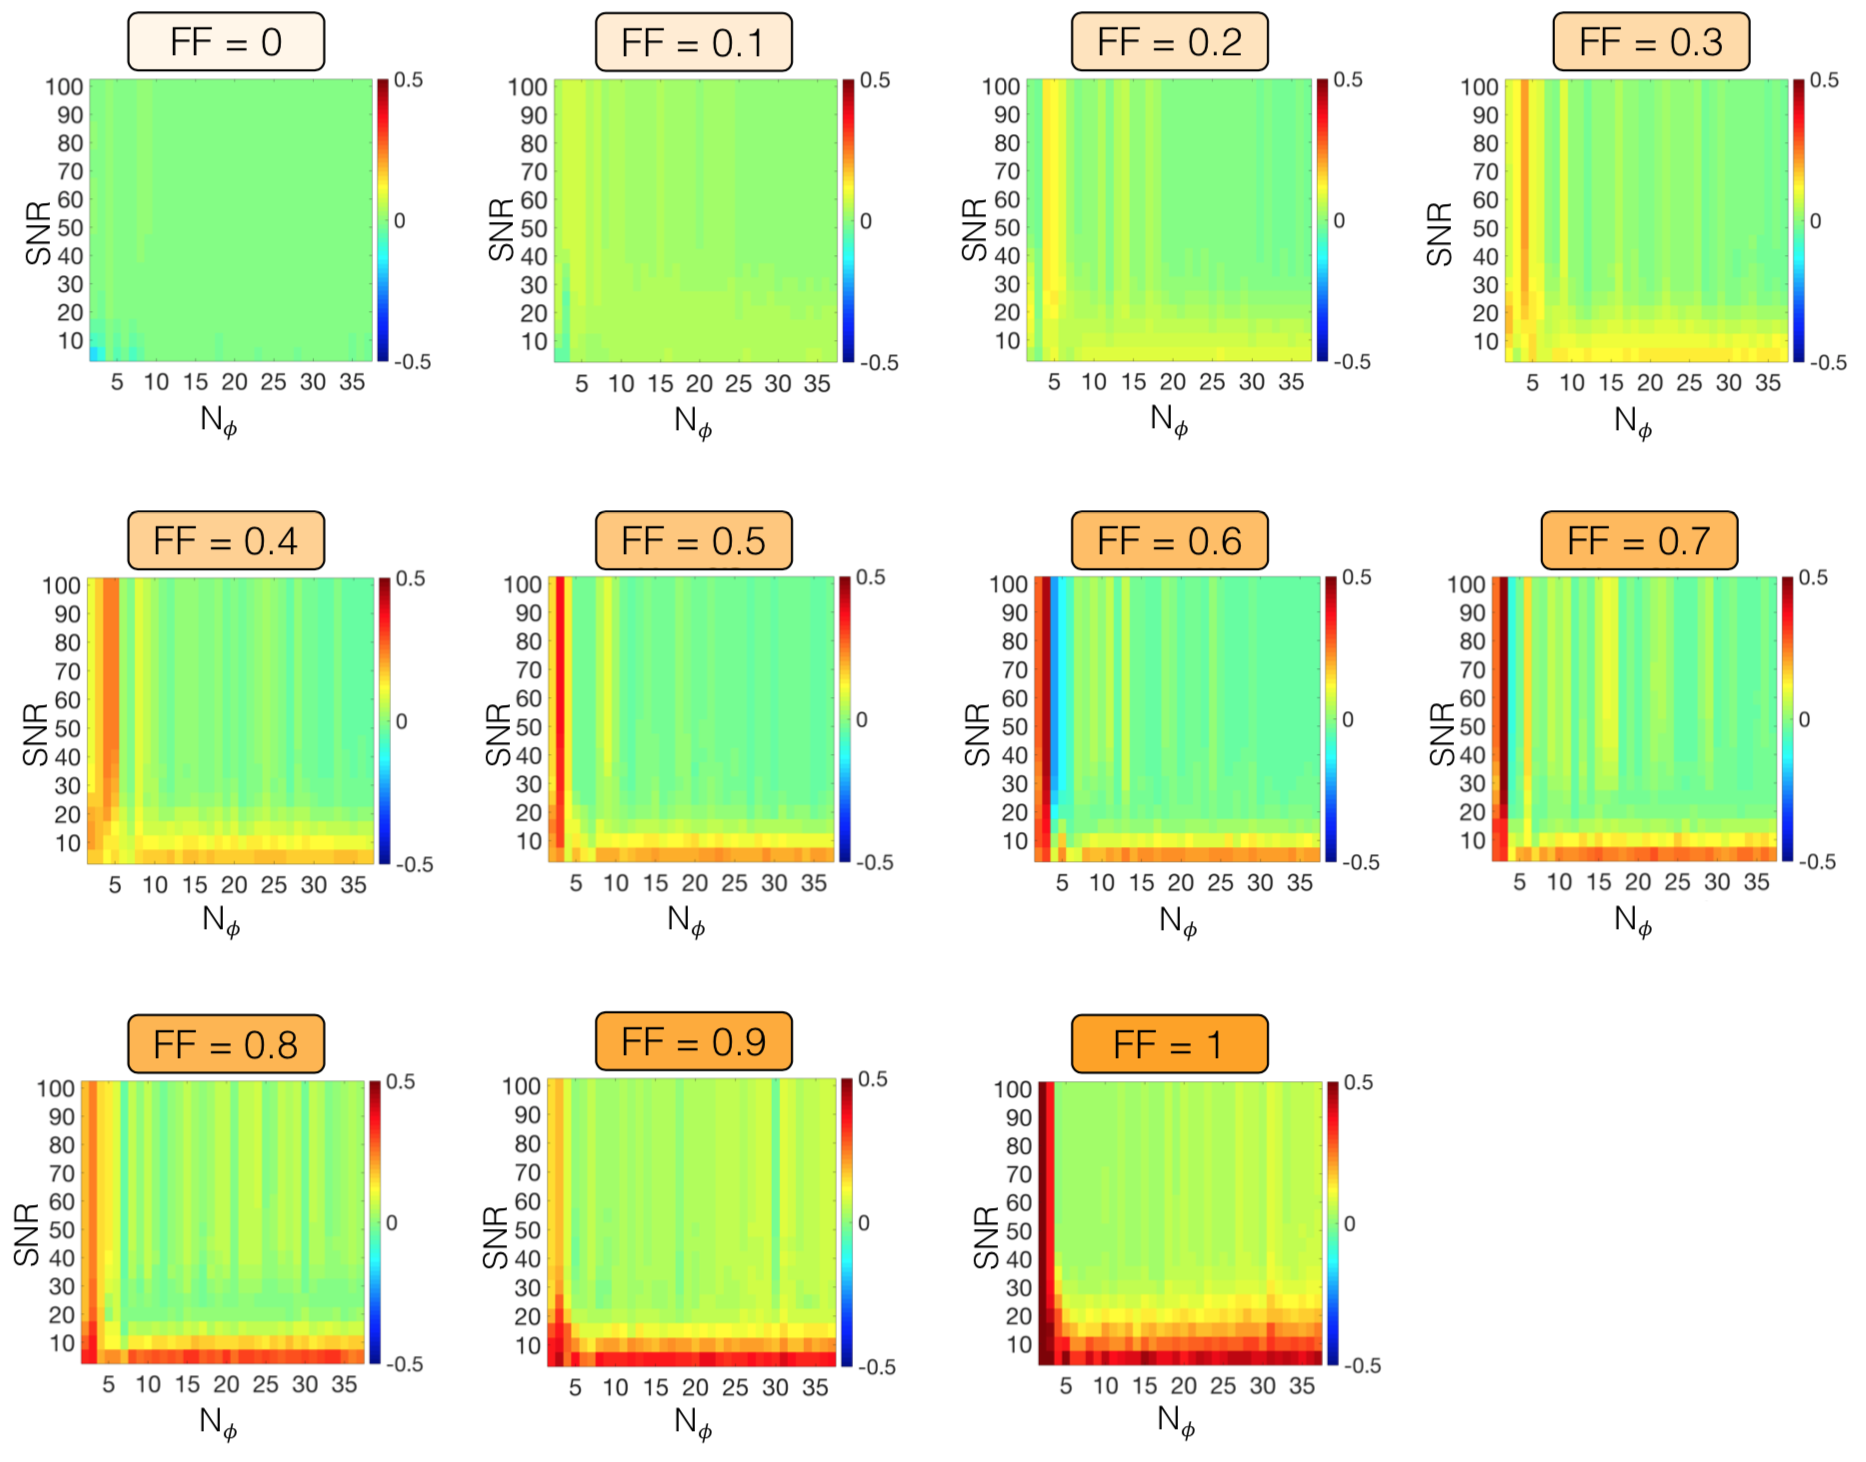
Figure 3
Mean error (over 500 repetitions) in the fat fraction estimation as a function of SNR and the number of phase-cycled bSSFP acquisitions $$$N_{\phi}$$$ at fixed simulated fat fractions FF $$$\in [0;1]$$$. The error is computed as the difference between the simulated fat fraction (treated as ground truth) and the one estimated by SPARCQ. Therefore warm tones (red) on the plot represent underestimations while cool tones (blue) represent overestimations by SPARCQ.
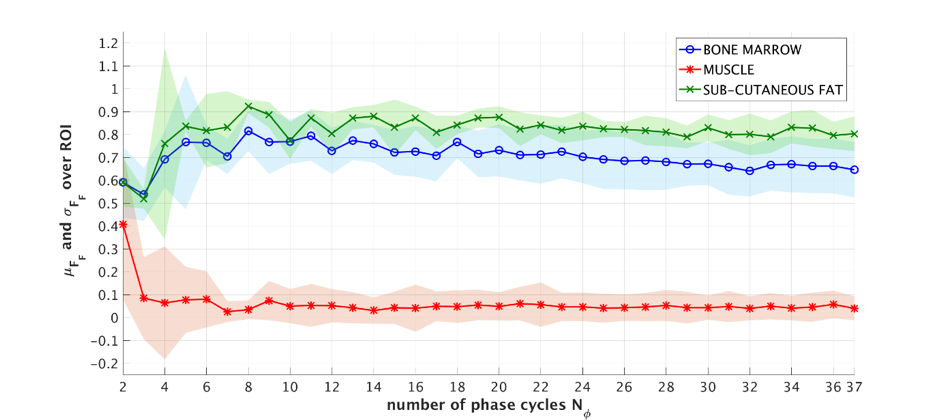
Figure 4
Mean fat-fraction estimation $$$\mu_{FF}$$$ (dotted line) and standard deviation $$$\sigma_{FF}$$$ (shaded area) calculated in three ROIs in the knee containing 25 pixels each.
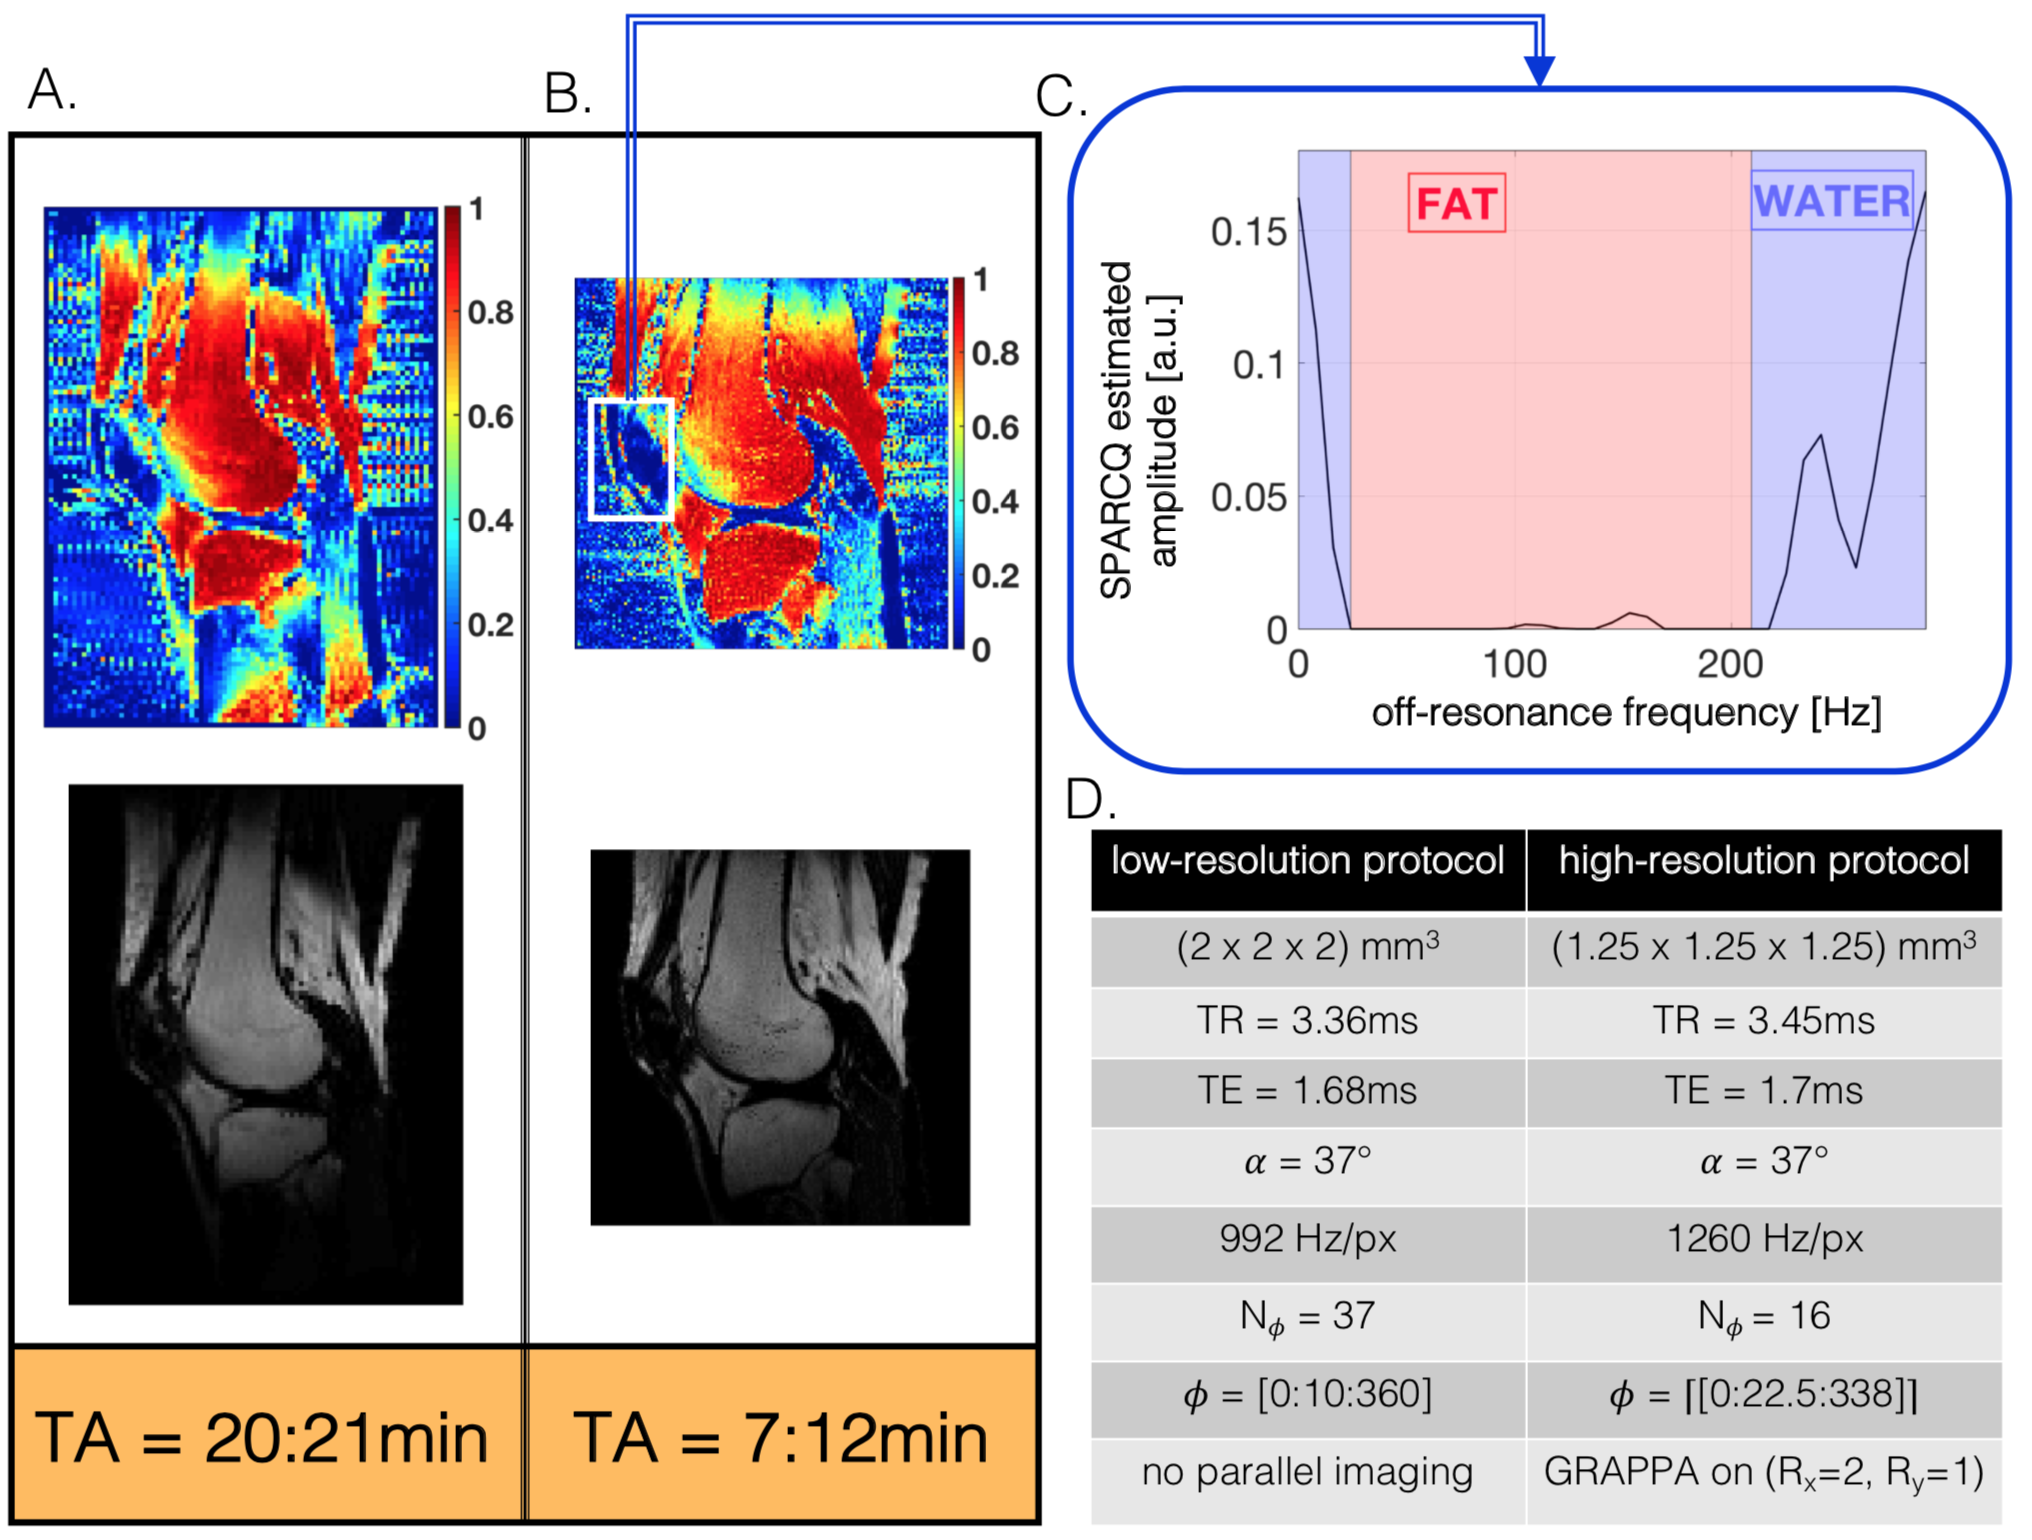
Figure 5
A and B. Comparison of the quantitative fat fraction maps (top) and the corresponding fat images (bottom) reconstructed by SPARCQ for the reference low-resolution protocol (A) and the accelerated high-resolution protocol (B). A signal void can be observed in the patella region. The SPARCQ frequency spectrum of this signal void (C) shows a misclassification of the on-resonance peak as water. Future studies will use the shape of the spectrum for classification of the water and fat signal. D. Scan and sequence parameters for both protocols.