3227
A Novel Chemical Shift-Selective Fat Saturation RF Pulse Design with Robustness to B0/B1 Inhomogeneity: A Demonstration on Breast MRI at 3T1The Russell H. Morgan Department of Radiology and Radiological Science, Johns Hopkins University, School of Medicine, Baltimore, MD, United States, 2F.M. Kirby Research Center for Functional Brain Imaging, Kennedy Krieger Institute, Baltimore, MD, United States, 3Biomedical Engineering, Johns Hopkins University, School of Medicine, Baltimore, MD, United States
Synopsis
Chemical shift-selective fat saturation (CHESS) is the most commonly used fat suppression technique for clinical MRI. Conventional Gaussian-shaped pulses are sensitive to B1 inhomogeneity and their wide transitional band can be affected by B0 off-resonance. Uniform fat saturation across a large field of view (FOV) is especially challenging for body and breast MRI at 3T. Here, we designed a novel frequency-selective RF pulse based on the optimal control theory with robustness to a targeted wide range of B0/B1 conditions. Its superior performance than the regular ones was demonstrated using T1-weighted sequences with whole-breast coverage.
Introduction
Chemical shift-selective fat saturation (CHESS) 1-3 can be added to any pulse sequence and thus is the most commonly used fat suppression technique for clinical MRI. Typically, a frequency-selective RF pulse is applied with the main fat peaks (around 3.5 ppm) in the saturation band and water frequency (0 ppm) in the pass band. However, conventional Gaussian-shaped pulses are sensitive to B1 inhomogeneity and their wide transitional band suffers from B0 off-resonance. Uniform fat saturation across a large field of view (FOV) is especially challenging for body and breast MRI at 3T 4,5. In this work, we will demonstrate a novel design of fat-sat pulse with robustness to B0/B1 inhomogeneity and compare it with the regular one for coverage of whole breast on normal volunteers.Methods
An optimized composite (OCP) fat-sat pulse was designed through numerical optimization using the optimal control theory6. Previously, we demonstrated a superior performance of OCP 10° excitation pulse in our angiography sequence 7. The desired range of immunity to the B0/B1 offset incurred in the breast at 3T is: B0 = ±200Hz and B1+ scale = ±0.3. An optimal control routine in MatPulse7,8 was utilized to generate a 12ms 90° OCP pulse with 400 components of block-shaped subpulses. Numerical simulations of the Bloch equations were performed using Matlab to examine the responses of the longitudinal magnetizations (Mz) following the OCP pulse under various B0/B1 conditions.Experiments were performed on a 3T Philips Ingenia scanner using a 16-channel breast coil for reception. Five healthy female volunteers (44±15 yo) were enrolled with informed consent and scanned with prone and feet-first position. B0 maps were obtained by a standard gradient echo sequences with two echo times and B1 maps were measured with the DREAM method9, both using vendor-provided fully automated shimming methods that take into account geometries of individual breasts.
Fat suppression using the SPIR (spectral presaturation with inversion recovery) module was compared between the OCP 90° pulse and two Sinc-Gaussian (SG) pulses with 90° and 105° respectively. The fat-sat pulse was immediately followed by a spoiling gradient and then the T1-weighted multi-shot turbo field echo (TFE) acquisition. The axial slab was acquired with left-right phase-encoding and following parameters: FOV=200x366x120mm3, acquired resolution=1x1x2mm3, reconstructed resolution=0.85x0.85x1mm3, TR/TE=3.5/1.8ms, flip angle=7°, low-high profile ordering, turbo field factor=70, shot number=91, TFE acquisition window = 245ms, TRshot=500ms, and total scan duration was 0.8min. Six-point 3D gradient echo DIXON was used to delineate water, fat masks based on a threshold of 80% tissue content. Quantitative analysis of fat, water signals were averaged from the fat, water masks respectively.
Results and Discussion
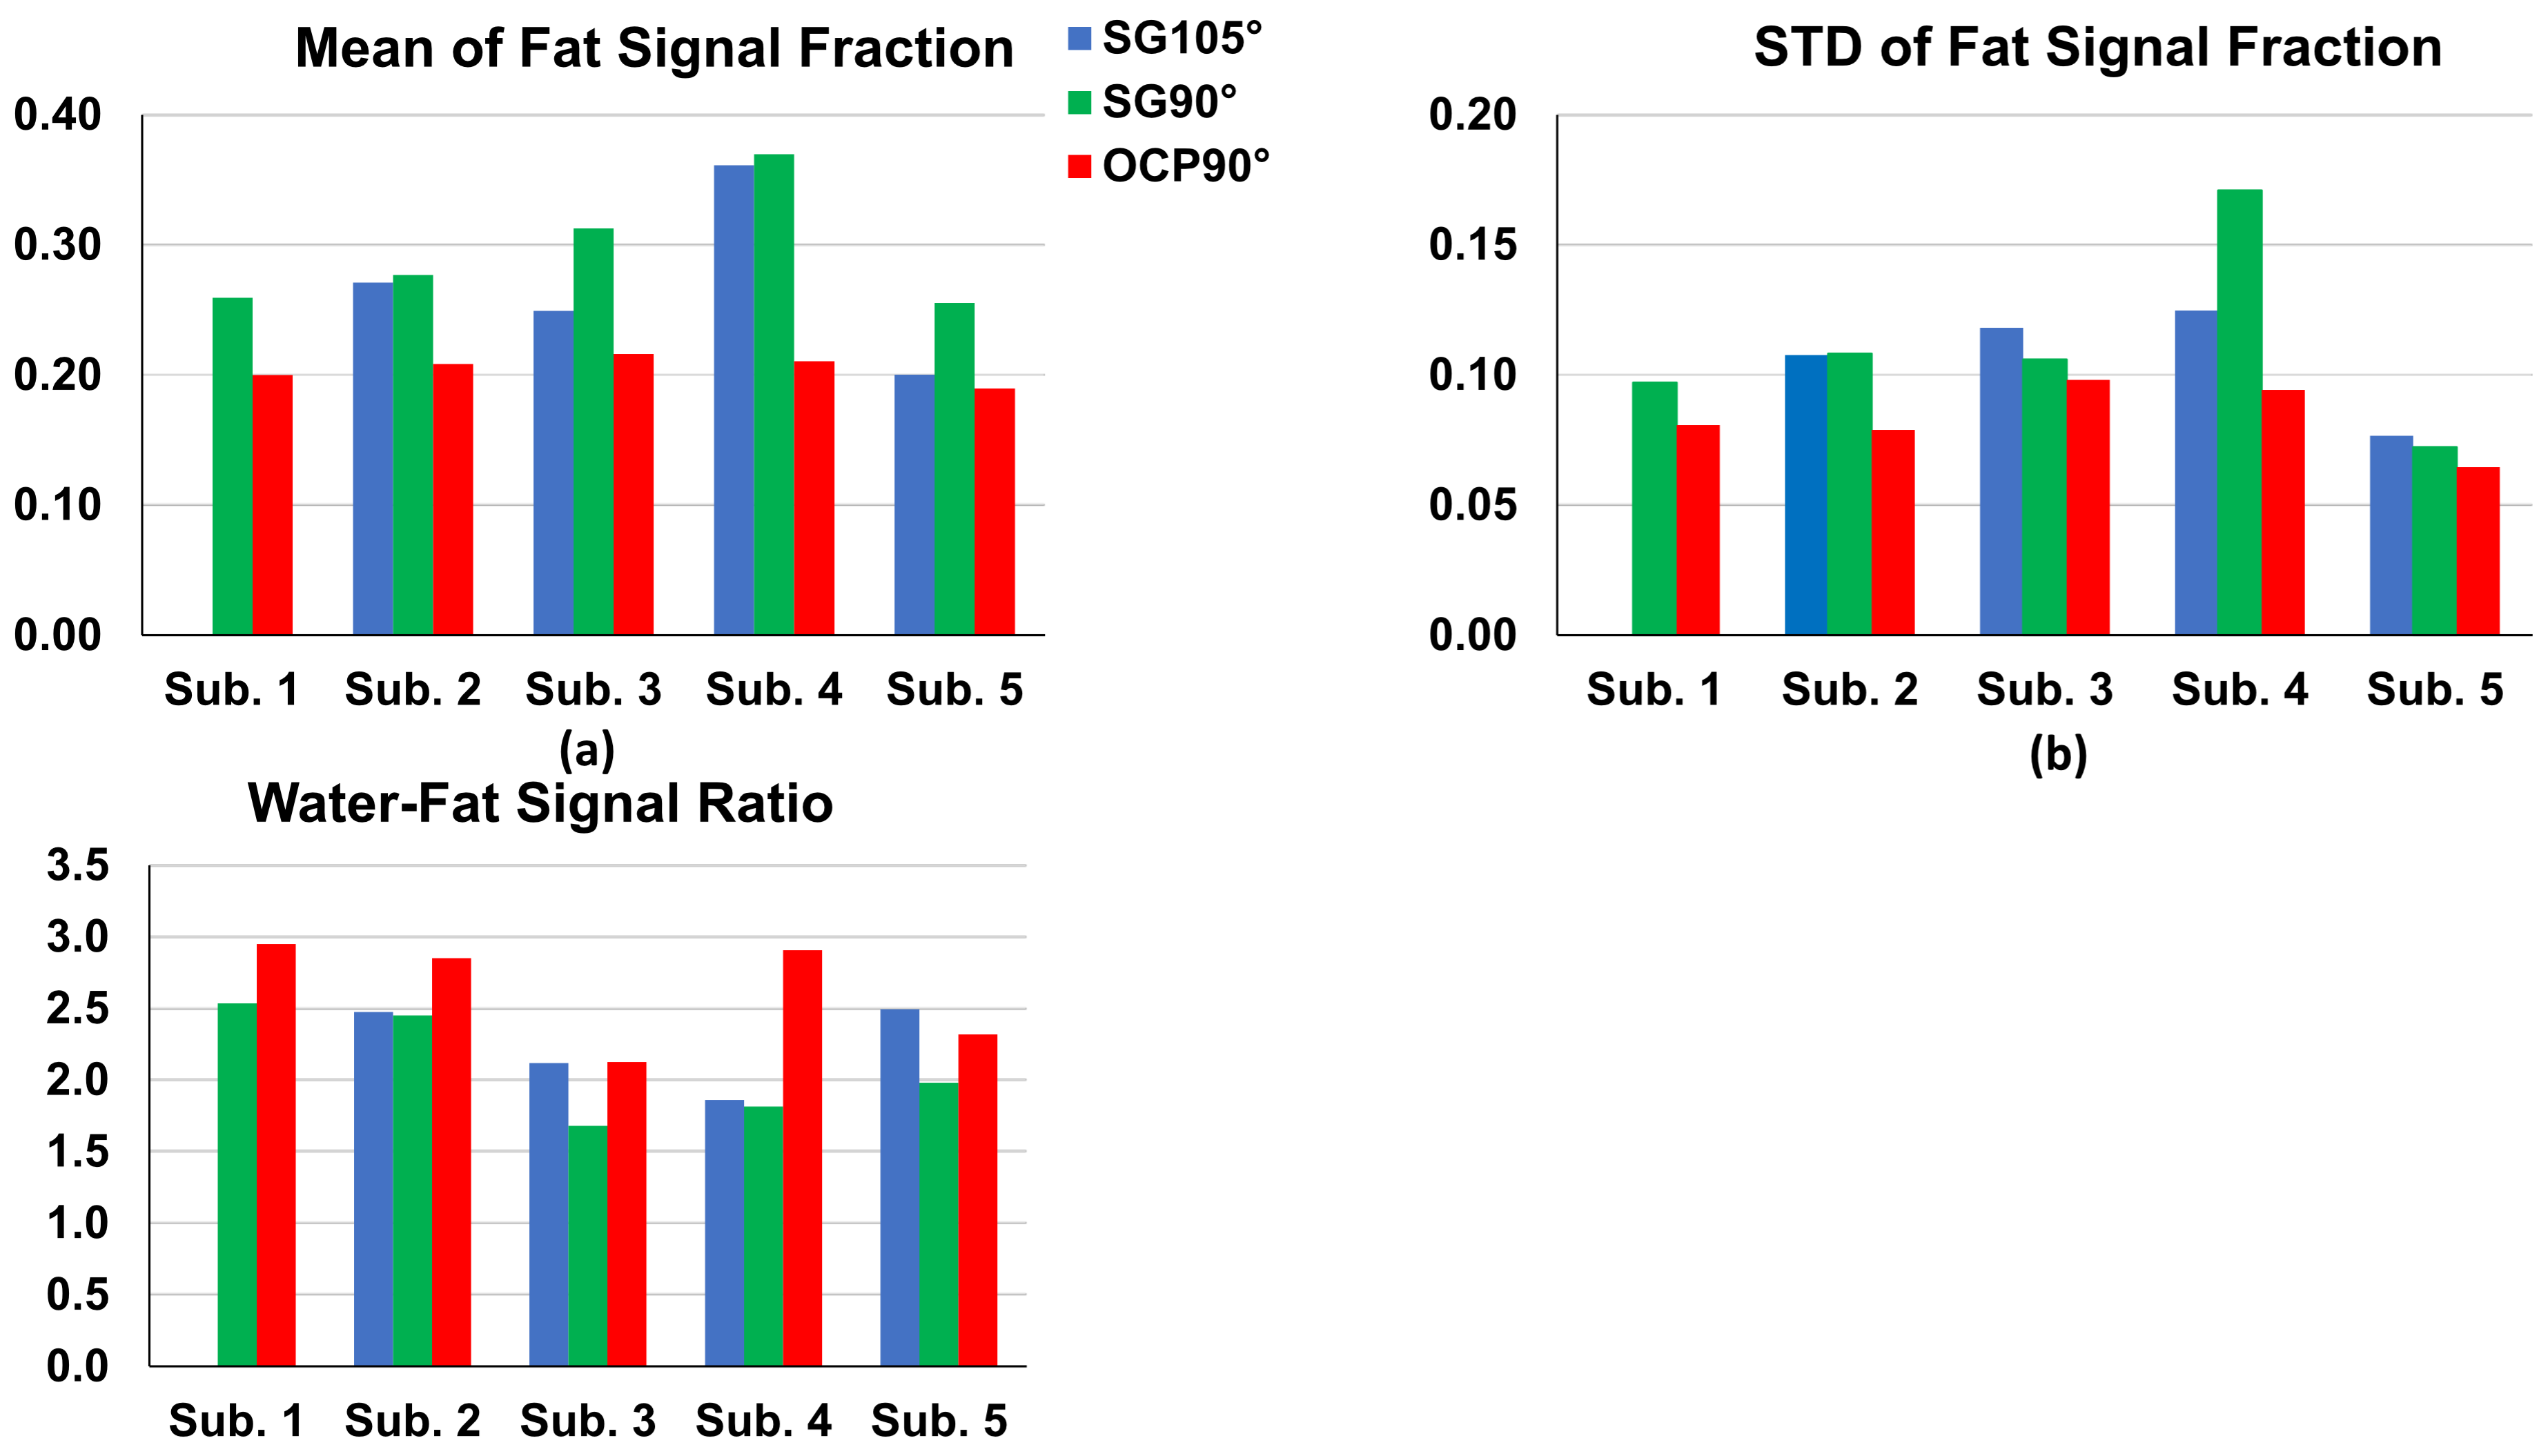
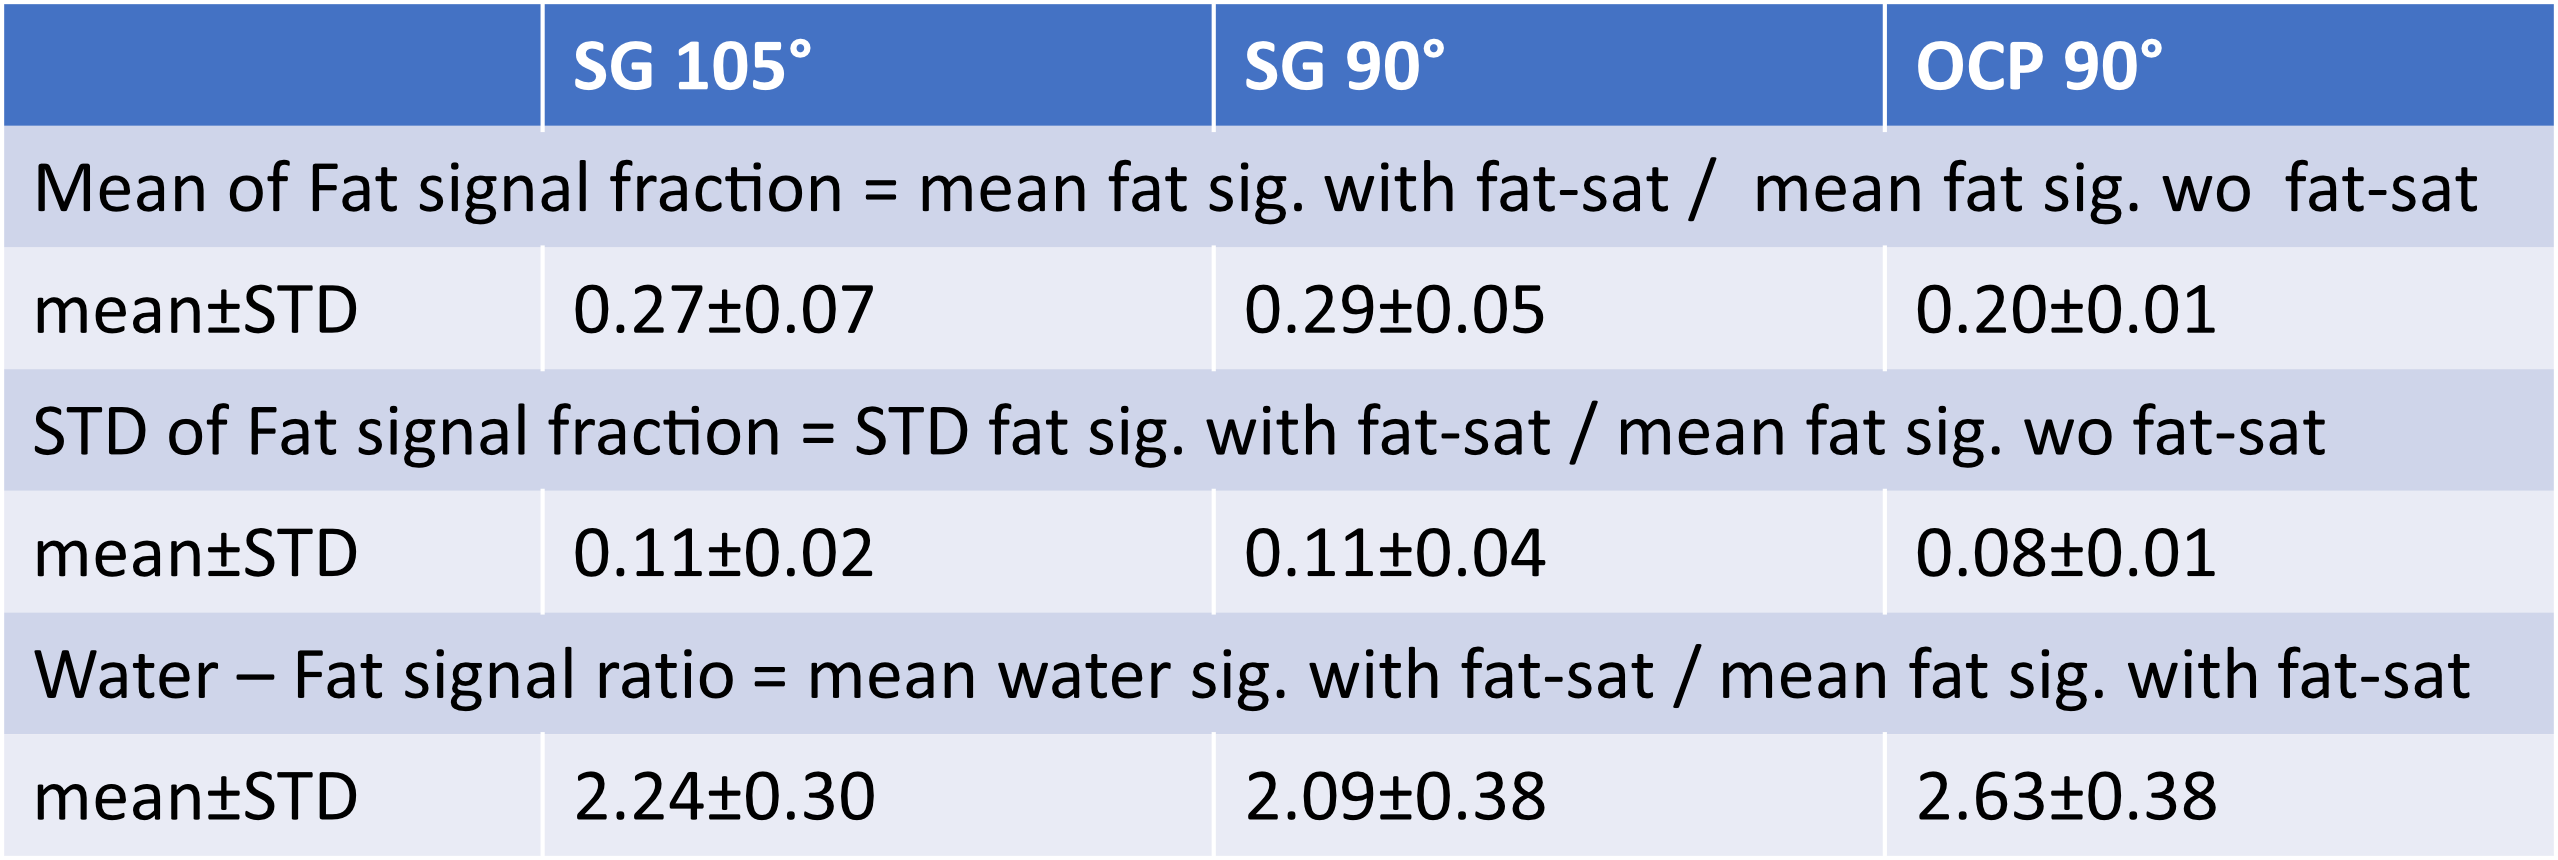
The regular SG 90° pulse shape and its simulated Mz responses over the B0 off-resonance (from -600Hz to 200Hz) at B1+ scale = 1 or from 0.7 to 1.3 are shown in Figures 1a,b,c, respectively. The waveform of the complexed OCP 90° pulse and its Mz responses over various B0/B1 variations are displayed in Figures 1d,e,f correspondingly. Compared to SG 90° fat saturation, OCP 90° pulse offers half of the transition band (95%-5%: 90Hz vs. 185Hz) and much less sensitivity to B1 inhomogeneity. The measured B0 off-resonance and B1+ scale maps of five different slice locations across the breasts of five subjects are shown in Figures 2a,b, respectively. A combined 2D histogram displays the B0 and B1+ distribution from all slices of all five subjects (Figure 2c). The region in red lines is the range of B0 off-resonance within ±200Hz and B1+ scale error within ±0.3, which contains 98% of all scattered data. The performance of OCP 90° fat sat in comparison with regular SG pulses are illustrated in three subjects with three orthogonal orientations, respectively (Figure 3). All subjects manifested partial unsaturated fat signal at different locations (arrowheads) using either SG 90° or SG 105°, indicating their sensitivity to B1 inhomogeneities. In contrast, fat signal appeared homogeneously suppressed using OCP 90° as expected. The last column of DIXON images were used as reference. Note that fat signal is partially recovered during the 245ms TFE acquisition through a blurring effect and this resulted in less ideal fat suppression. Within the 80%-threshold fat mask, the ratios of the mean and standard deviation (STD) of residual fat signal level after different fat-sat pulses relative to the averaged fat signal intensity without fat saturation of each subject are exhibited in Figures 4a,b, respectively. The contrast ratios of water to fat signal after different fat-sat pulses of each subject are shown in Figure 4c. Table 1 lists the group results of each metric. OCP 90° yields 27% and 31% lower fat signal (mean) with 27% less variation (STD) compared to SG 105° and 90° (P=0.01), and 25% higher water-fat contrast than SG 90° (P=0.02).Conclusion
A new frequency-selective fat saturation OCP pulse was designed based on optimal control theory for a targeted wide range of B0 off-resonance and B1+ scales. Examined at 3T with a whole-breast coverage, this OCP pulse was demonstrated with a significantly more robust fat suppression compared to conventional Gaussian shaped pulses. One downside is that OCP90° utilizes maximum B1 power for a longer time, which results in higher SAR.Acknowledgements
No acknowledgement found.References
1. Rosen BR, Wedeen VJ, Brady TJ. Selective Saturation Nmr Imaging. J Comput Assist Tomo 1984;8(5):813-818.
2. Frahm J, Haase A, Hanicke W, Matthaei D, Bomsdorf H, Helzel T. Chemical-Shift Selective Mr Imaging Using a Whole-Body Magnet. Radiology 1985;156(2):441-444.
3. Haase A, Frahm J, Hanicke W, Matthaei D. 1H NMR chemical shift selective (CHESS) imaging. Phys Med Biol 1985;30(4):341-344.
4. Del Grande F, Santini F, Herzka DA, Aro MR, Dean CW, Gold GE, Carrino JA. Fat-Suppression Techniques for 3-T MR Imaging of the Musculoskeletal System. Radiographics 2014;34(1):217-233. 5. Kalovidouri A, Firmenich N, Delattre BMA, Picarra M, Becker CD, Montet X, Botsikas D. Fat suppression techniques for breast MRI: Dixon versus spectral fat saturation for 3D T1-weighted at 3 T. Radiol Med 2017;122(10):731-742.
6. Liu H, Matson GB. Radiofrequency pulse designs for three-dimensional MRI providing uniform tipping in inhomogeneous B(1) fields. Magn Reson Med 2011;66(5):1254-1266.
7. Li W, Xu F, Schär M, Liu J, Shin T, Zhao Y, van Zijl PCM, Wasserman BA, Qiao Y, Qin Q. Whole-brain arteriography and venography: Using improved velocity-selective saturation pulse trains. Magn Reson Med 2018;79(4):2014-2023.
8. Matson GB. An integrated program for amplitude-modulated RF pulse generation and re-mapping with shaped gradients. Magnetic resonance imaging 1994;12(8):1205-1225.
9. Matson GB, Young K, Kaiser LG. RF pulses for in vivo spectroscopy at high field designed under conditions of limited power using optimal control. J Magn Reson 2009;199(1):30-40.
10. Nehrke K, Bornert P. DREAM--a novel approach for robust, ultrafast, multislice B(1) mapping. Magn Reson Med 2012;68(5):1517-1526.
Figures