3224
Sparsity based machine learning algorithms for oxygen extraction fraction mapping1Biomedical Engineering, Cornell University, New York, NY, United States, 2Computer Software Engineering, Kumoh National Institute of Technology, Gumi, Republic of Korea, 3Radiology, Weill Cornell Medical College, New York, NY, United States, 4Electrical and Computer Engineering, Cornell University, New York, NY, United States, 5Computer Assisted Clinical Medince, Heidelberg University, Mannheim, Germany
Synopsis
In this work, dictionary and deep learning based algorithms are developed that take advantage of sparse signal representations to improve the accuracy and speed of oxygen extraction fraction (OEF) mapping based on the QSM+qBOLD (QQ) modeling of multi-echo gradient echo data without vascular challenge. The developed dictionary learning (QQ-DL) and deep neural network (QQ-NET) algorithms are significantly faster and provide more accurate OEF maps in simulation than a current algorithm based on cluster analysis of time evolution (CAT). In ischemic stroke patients, QQ-DL and QQ-NET show OEF maps that are consistent with DWI-defined lesions.
Introduction
Quantitative mapping of oxygen extraction fraction (OEF) provides valuable assessment of brain tissue viability and function (1-3). By modeling both magnitude and phase of multi-echo gradient echo (mGRE) data, a combined model of QSM and qBOLD (QSM+qBOLD or QQ) (4), OEF can be mapped without any vascular challenge making it suitable for clinical applications. However, the non-convexity in the inversion of QQ makes OEF dependent on optimization details such as initial guess and parameter scaling. The recent cluster analysis of time evolution (CAT) algorithm (5) suggests the presence of sparsity in the QQ model of OEF and QSM + mGRE magnitude Accordingly, we investigate sparsity based dictionary and deep learning algorithms (6) to solve QQ inversion without dependency on optimization details and with faster reconstruction speed.Theory and Methods
QSM and qBOLD formulism are combined in the QQ model to estimate $$$OEF=1-\frac{Y}{Y_{a}}$$$ where $$$Y_{a}=0.98$$$ arterial oxygenation (4). The QSM-based model divides voxel-wise susceptibility into two contributions: deoxyhemoglobin in venous blood, i.e. OEF effect, and non-blood tissue susceptibility ($$$\chi_{nb}$$$), in reference to fully oxygenated arterial blood $$$\chi_{ba} = -108.3 $$$ ppb (7), $$F_{QSM}(Y,v,\chi_{nb})=\left[\frac{\chi_{ba}}{\alpha}+\psi_{Hb}\cdot\Delta\chi_{Hb}\cdot\left(-Y+\frac{1-\left(1-\alpha\right)\cdot Y_{a}}{\alpha}\right)\right]\cdot v + \left(1-\frac{v}{\alpha}\right)\cdot \chi_{nb}$$ where $$$\alpha = 0.77$$$ (8) and $$$\psi_{Hb}=0.0909$$$ assuming $$$Hct =0.357$$$ (9-12); $$$\Delta \chi_{Hb}$$$ between deoxy- and oxy-hemoglobin (13,14). The qBOLD model of mGRE magnitude signal decay is (4):$$S_{qBOLD}\left(t\right)=S_0\cdot e^{-R_2\cdot t}\cdot F_{BOLD}\left(Y,v,\chi_{nb},t\right)\cdot G(t)$$ where $$$G(t)$$$ is a macroscopic field effect (4), $$$F_{BOLD}$$$ is the deoxygenated blood effect inside the voxel: $$$F_{BOLD}\left(Y,v,\chi_{nb},t\right)=exp\left(-v\cdot f_{s}\left(\delta\omega\cdot t\right)\right)$$$ (15), where $$$f_s$$$ is the signal decay by the blood vessel network (16), and $$$\delta \omega$$$ is (4): $$$\delta \omega\left(Y,\chi_{nb}\right)=\frac{1}{3}\cdot \gamma \cdot B_{0}\cdot \left[Hct\cdot \Delta \chi_{0}\cdot \left(1-Y\right) + \chi_{ba}-\chi_{nb}\right]$$$, with $$$\gamma =267.513 $$$MHz/T, $$$B_{0}$$$ main magnetic field, $$$Hct=0.357$$$ (9), $$$\Delta \chi_{0}$$$ the susceptibility difference between fully oxygenated and deoxygenated red blood cells (17).Dictionary learning for QQ (QQ-DL)
QQ-DL consists of 1) sparse dictionary generation and 2) dictionary matching. For the sparse dictionary generation, a list of representative outputs (simulated using Eqs. 1 and 2) and inputs (QQ-CAT parameters, e.g. OEF) were generated from a sample patient dataset (6 out of 30 patients) based on the weighted L2 norm of the output difference (WLN), and the grouping of similar magnitude time courses for sparsity (3000 atoms). Dictionary matching was performed for each voxel by selecting the two nearest components in the dictionary based on WLN and performing bilinear interpolation.
Deep learning for QQ (QQ-NET)
A fully convolutional neural network (QQ-NET), processing 4-dimentional inputs (3D and model parameter), was based on an established architecture, U-net (27 layers) (18). QQ-NET was trained with simulated data based on the QQ-CAT results as ground truth using Eqs. 1 and 2 at SNR 100. The loss function was the L1 difference between the truth and the output of QQ-NET. QQ-NET was implemented using Pytorch 1.0.1 (19) on an NVIDIA TITAN Xp GPU. The minimization was performed with ADAM (20) with learning rate 10-4, 27 epochs (~ 18 hours) as the performance (validation loss) was shown to be stable.
Validation
QQ-DL and QQ-NET were compared with QQ-CAT in 1) simulated stroke brain datasets constructed in the same way as the dictionary with additional Gaussian noise (SNR 100), 2) 30 real ischemic stroke patient data in which 3D ASL (24 cm FOV, 1.9x1.9x2.0 mm3 voxel size, 1500 ms labeling period, 1525 ms post-label delay), 3D mGRE (0.47x0.47x2.0 mm3 voxel size, TE1/ΔTE/TE8 = 4.5/5/39.5 ms, TR= 42.8 ms) and DWI (0.94x0.94x3.2 mm3 voxel size, 0, 1000 s/mm2 b-values) was acquired. For comparison, QQ-CAT was also performed on the testing datasets (5).
Results
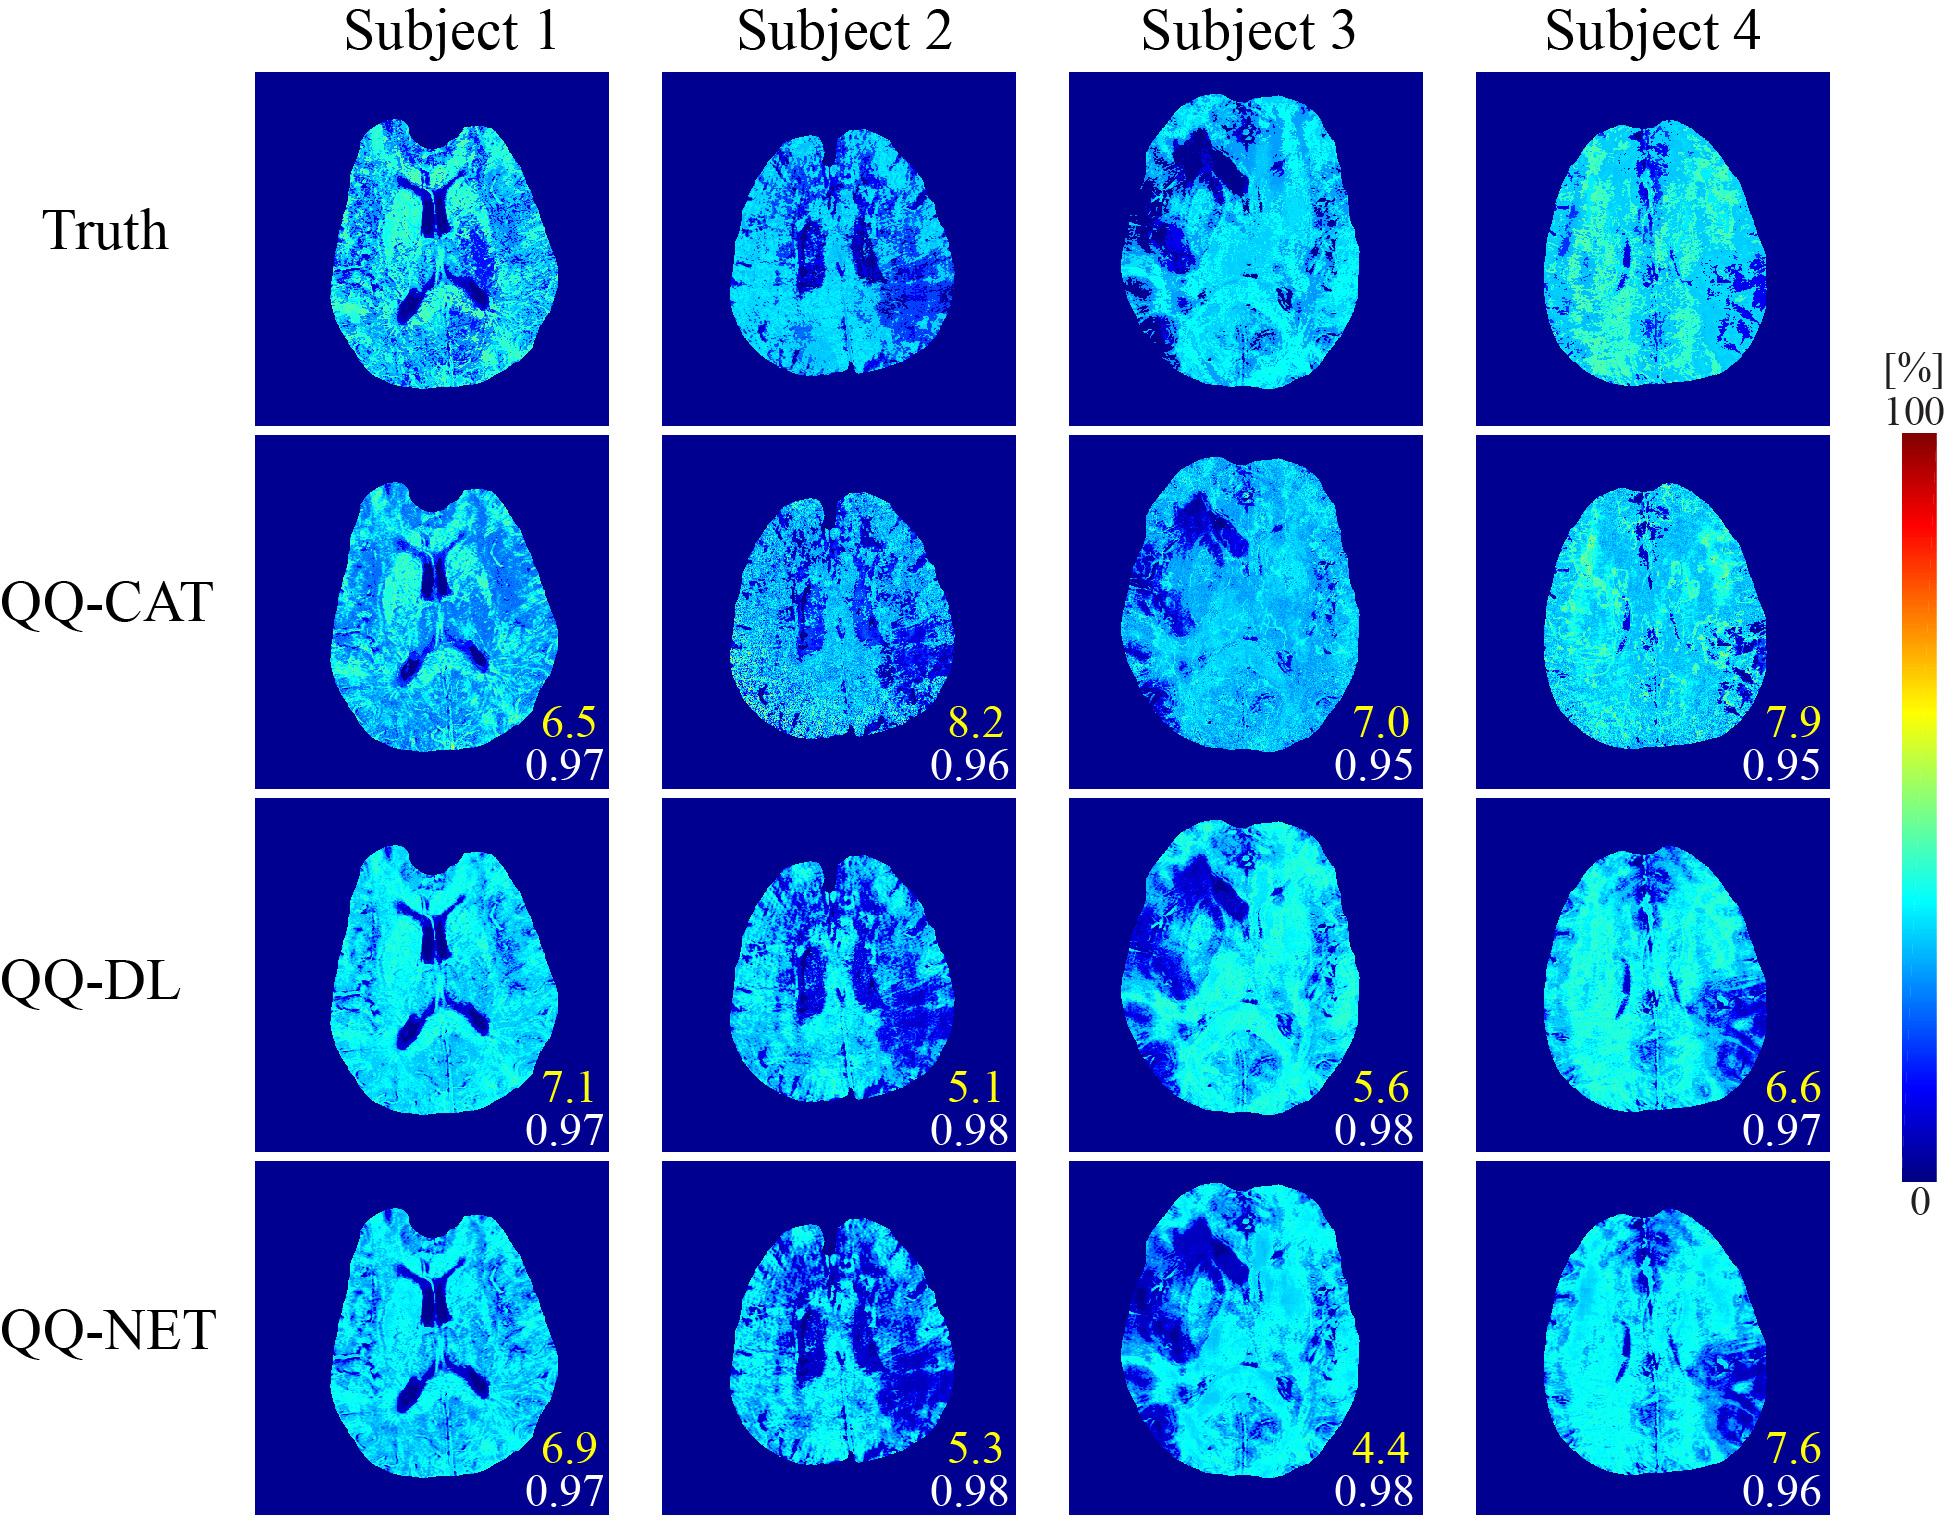
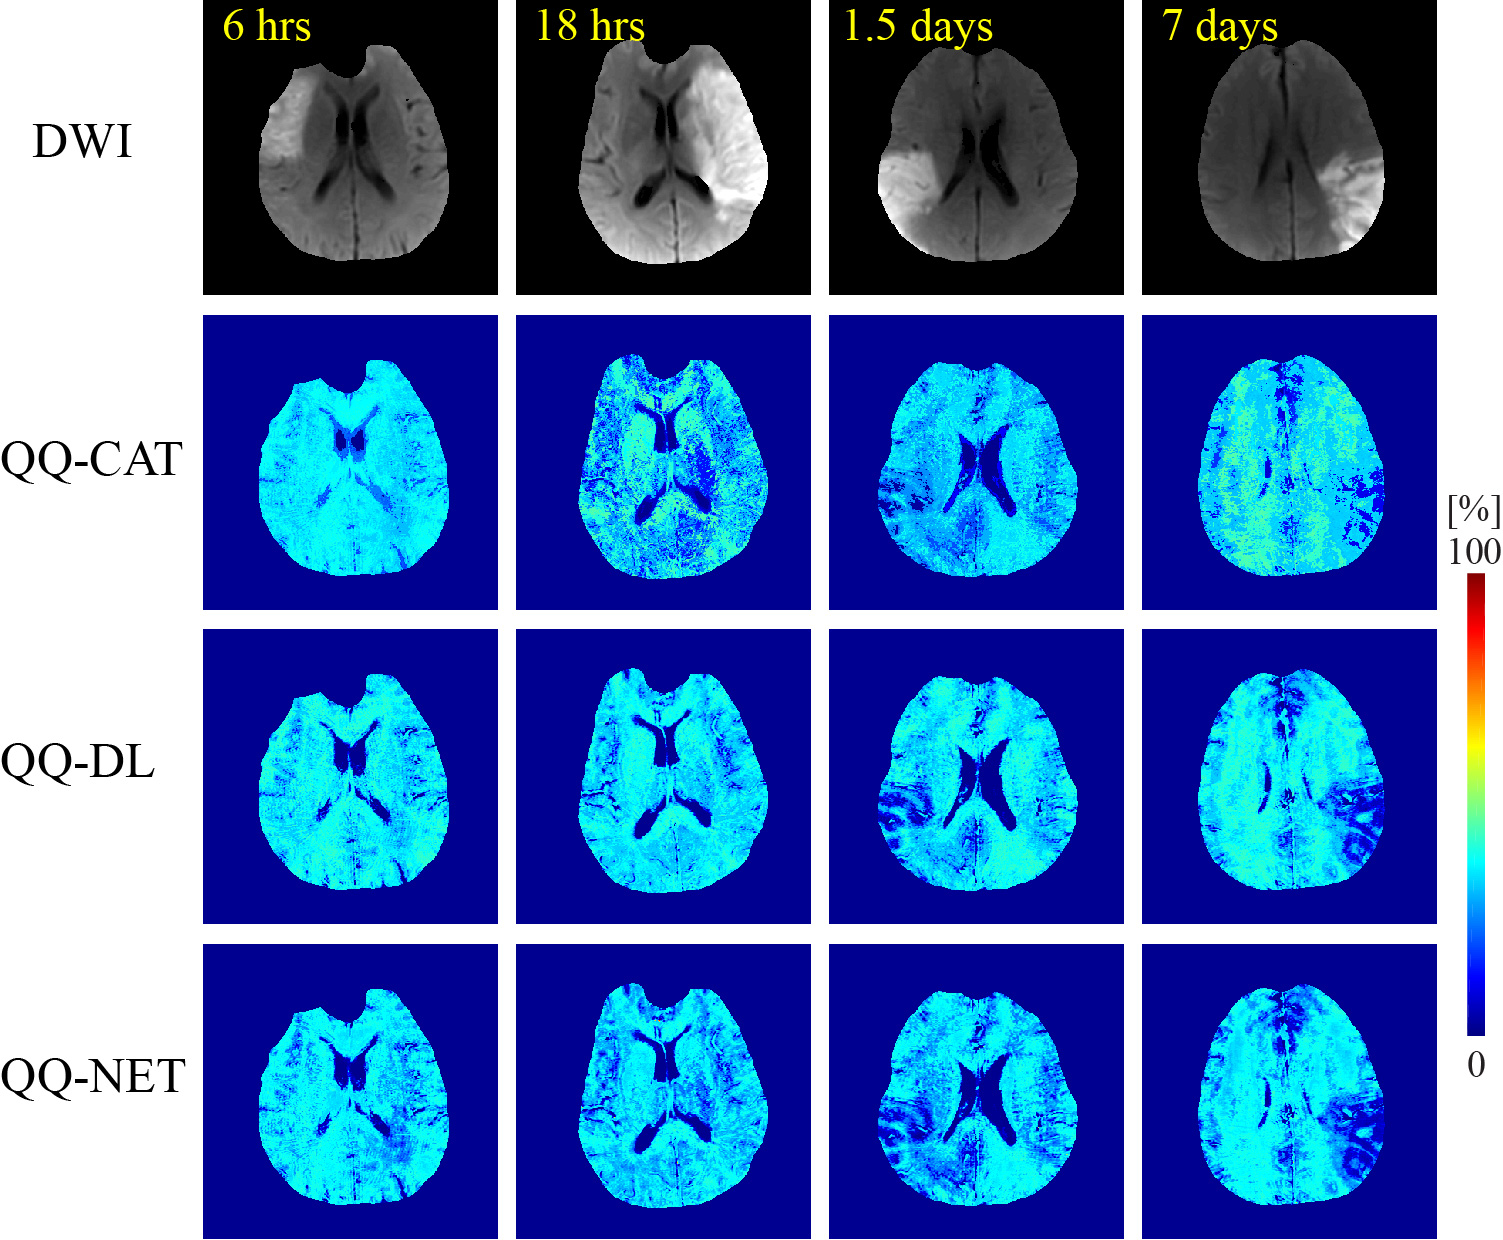
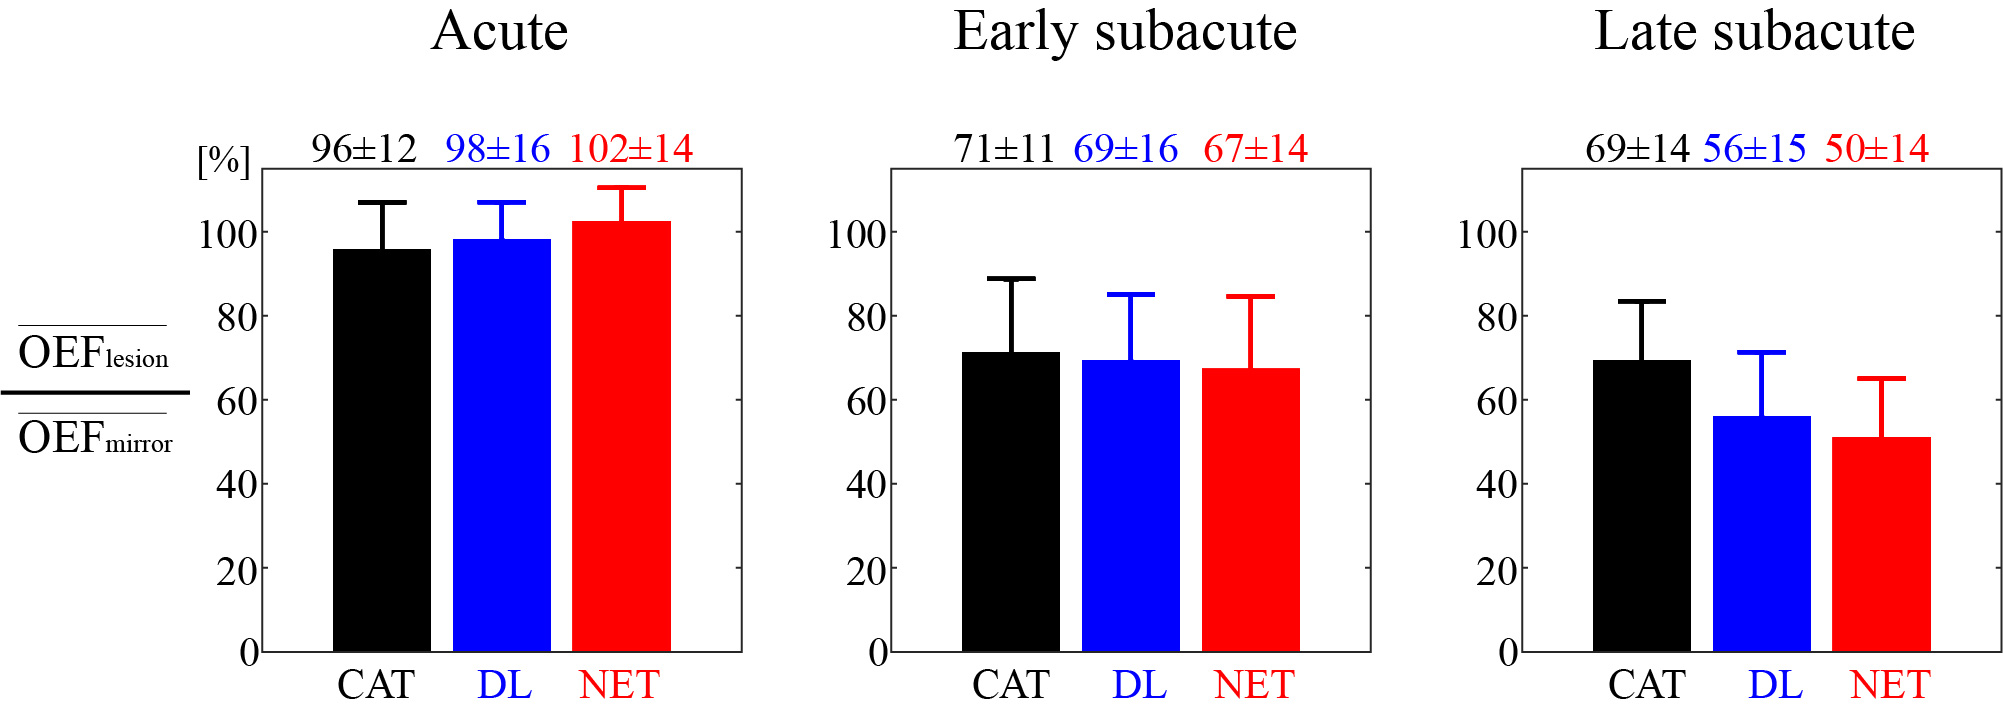
QQ-DL and QQ-NET (20 and 30 sec recon time) showed more accurate OEF results in simulation (Figure 1) with smaller RMSE values compared to QQ-CAT (30 min recon time), with average RMSE: 6.1, 6.1, 7.4 %, respectively. In the 30 stroke patients, QQ-DL and QQ-NET generally showed similar OEF maps compared to QQ-CAT (Figure 2). In the 1.5 days and 7 days post-onset cases, low OEF regions from QQ-DL and QQ-NET agreed better with DWI-defined lesion. In the 7 days post-onset, the relative volume with OEF<20% in the lesion is 26%, 33%, and 57% for QQ-CAT, QQ-DL, and QQ-NET. Figure 3 shows the post-onset time vs. the ratio of average OEF between lesion and contralateral side. Here, QQ-DL and QQ-NET showed a greater difference among different phases compared to QQ-CAT. Also, QQ-NET showed a ratio > 100% in the acute phase.Discussion
QQ-CAT, QQ-DL, and QQ-NET show generally uniform OEF except in stroke lesions (Figure 2), which is in agreement with previous PET studies (21,22). The stronger decreasing pattern of QQ-DL and QQ-NET with stroke phase progression compared to QQ-CAT may suggest better agreement with disease progression, which is exemplified in better concordance between low OEF regions and DWI-defined lesions in some cases (Figure 3). The greater ratio than 100% from QQ-NET in the acute phase is consistent with expected OEF elevation (23). With the improved accuracy and speed allowed by the use of sparsity based machine learning, QQ-DL and QQ-NET can be readily applied to investigate tissue viability in various diseases, such as Alzheimer’s disease (24,25), multiple sclerosis (26), tumor (27), and ischemic stroke (28).Acknowledgements
No acknowledgement found.References
1. Derdeyn CP, Videen TO, Yundt KD, Fritsch SM, Carpenter DA, Grubb RL, Powers WJ. Variability of cerebral blood volume and oxygen extraction: stages of cerebral haemodynamic impairment revisited. Brain : a journal of neurology 2002;125(Pt 3):595-607.
2. Gupta A, Chazen JL, Hartman M, Delgado D, Anumula N, Shao H, Mazumdar M, Segal AZ, Kamel H, Leifer D, Sanelli PC. Cerebrovascular reserve and stroke risk in patients with carotid stenosis or occlusion: a systematic review and meta-analysis. Stroke 2012;43(11):2884-2891.
3. Gupta A, Baradaran H, Schweitzer AD, Kamel H, Pandya A, Delgado D, Wright D, Hurtado-Rua S, Wang Y, Sanelli PC. Oxygen Extraction Fraction and Stroke Risk in Patients with Carotid Stenosis or Occlusion: A Systematic Review and Meta-Analysis. American Journal of Neuroradiology 2014;35(2):250-255.
4. Cho J, Kee Y, Spincemaille P, Nguyen TD, Zhang J, Gupta A, Zhang S, Wang Y. Cerebral metabolic rate of oxygen (CMRO2) mapping by combining quantitative susceptibility mapping (QSM) and quantitative blood oxygenation level-dependent imaging (qBOLD). Magnetic resonance in medicine 2018;80(4):1595-1604.
5. Cho J, Zhang S, Kee Y, Spincemaille P, Nguyen TD, Hubertus S, Gupta A, Wang Y. Cluster analysis of time evolution (CAT) for quantitative susceptibility mapping (QSM) and quantitative blood oxygen level-dependent magnitude (qBOLD)-based oxygen extraction fraction (OEF) and cerebral metabolic rate of oxygen (CMRO2) mapping. Magnetic Resonance in Medicine;0(0).
6. Papyan V, Romano Y, Sulam J, Elad M. Theoretical Foundations of Deep Learning via Sparse Representations A multilayer sparse model and its connection to convolutional neural networks. Ieee Signal Proc Mag 2018;35(4):72-89.
7. Zhang J, Zhou D, Nguyen TD, Spincemaille P, Gupta A, Wang Y. Cerebral metabolic rate of oxygen (CMRO2) mapping with hyperventilation challenge using quantitative susceptibility mapping (QSM). Magnetic resonance in medicine 2017;77(5):1762-1773.
8. Hongyu A, Weili L. Cerebral venous and arterial blood volumes can be estimated separately in humans using magnetic resonance imaging. Magnetic resonance in medicine 2002;48(4):583-588.
9. Zhang J, Cho J, Zhou D, Nguyen TD, Spincemaille P, Gupta A, Wang Y. Quantitative susceptibility mapping-based cerebral metabolic rate of oxygen mapping with minimum local variance. Magn Reson Med 2017.
10. Sakai F, Nakazawa K, Tazaki Y, Ishii K, Hino H, Igarashi H, Kanda T. Regional cerebral blood volume and hematocrit measured in normal human volunteers by single-photon emission computed tomography. Journal of cerebral blood flow and metabolism : official journal of the International Society of Cerebral Blood Flow and Metabolism 1985;5(2):207-213.
11. Savicki JP, Lang G, Ikeda-Saito M. Magnetic susceptibility of oxy- and carbonmonoxyhemoglobins. Proceedings of the National Academy of Sciences 1984;81(17):5417-5419.
12. Hoffman R. Hematology: Basic Principles and Practice: Churchill Livingstone; 2005.
13. Spees WM, Yablonskiy DA, Oswood MC, Ackerman JJ. Water proton MR properties of human blood at 1.5 Tesla: magnetic susceptibility, T(1), T(2), T*(2), and non-Lorentzian signal behavior. Magn Reson Med 2001;45(4):533-542.
14. Zhang J, Liu T, Gupta A, Spincemaille P, Nguyen TD, Wang Y. Quantitative mapping of cerebral metabolic rate of oxygen (CMRO2) using quantitative susceptibility mapping (QSM). Magnetic Resonance in Medicine 2015;74(4):945-952.
15. Yablonskiy DA, Sukstanskii AL, He X. BOLD-based Techniques for Quantifying Brain Hemodynamic and Metabolic Properties – Theoretical Models and Experimental Approaches. NMR Biomed 2013;26(8):963-986.
16. Ulrich X, Yablonskiy DA. Separation of cellular and BOLD contributions to T2* signal relaxation. Magn Reson Med 2016;75(2):606-615.
17. Sukstanskii AL, Yablonskiy DA. Theory of FID NMR signal dephasing induced by mesoscopic magnetic field inhomogeneities in biological systems. Journal of magnetic resonance (San Diego, Calif : 1997) 2001;151(1):107-117.
18. Ronneberger O, Fischer P, Brox T. U-Net: Convolutional Networks for Biomedical Image Segmentation. In: Navab N, Hornegger J, Wells WM, Frangi AF, editors2015 2015//; Cham. Springer International Publishing. p 234-241.
19. Paszke A, Gross S, Chintala S, Chanan G, Yang E, DeVito Z, Lin Z, Desmaison A, Antiga L, Lerer A. Automatic differentiation in PyTorch. Conference Proceedings 2017.
20. Kingma DP, Ba J. Adam: A Method for Stochastic Optimization. arXiv e-prints 2014:arXiv:1412.6980.
21. Mintun MA, Raichle ME, Martin WR, Herscovitch P. Brain oxygen utilization measured with O-15 radiotracers and positron emission tomography. Journal of nuclear medicine : official publication, Society of Nuclear Medicine 1984;25(2):177-187.
22. Raichle ME, MacLeod AM, Snyder AZ, Powers WJ, Gusnard DA, Shulman GL. A default mode of brain function. Proceedings of the National Academy of Sciences 2001;98(2):676-682.
23. Fan AP, Khalil AA, Fiebach JB, Zaharchuk G, Villringer A, Villringer K, Gauthier CJ. Elevated brain oxygen extraction fraction measured by MRI susceptibility relates to perfusion status in acute ischemic stroke. Journal of cerebral blood flow and metabolism : official journal of the International Society of Cerebral Blood Flow and Metabolism 2019:271678X19827944.
24. Sun X, He G, Qing H, Zhou W, Dobie F, Cai F, Staufenbiel M, Huang LE, Song W. Hypoxia facilitates Alzheimer's disease pathogenesis by up-regulating BACE1 gene expression. Proceedings of the National Academy of Sciences of the United States of America 2006;103(49):18727-18732.
25. Acosta-Cabronero J, Williams GB, Cardenas-Blanco A, Arnold RJ, Lupson V, Nestor PJ. In vivo quantitative susceptibility mapping (QSM) in Alzheimer's disease. PloS one 2013;8(11):e81093.
26. Trapp BD, Stys PK. Virtual hypoxia and chronic necrosis of demyelinated axons in multiple sclerosis. The Lancet Neurology 2009;8(3):280-291.
27. Stadlbauer A, Zimmermann M, Kitzwogerer M, Oberndorfer S, Rossler K, Dorfler A, Buchfelder M, Heinz G. MR Imaging-derived Oxygen Metabolism and Neovascularization Characterization for Grading and IDH Gene Mutation Detection of Gliomas. Radiology 2017;283(3):799-809.
28. Kudo K, Liu T, Murakami T, Goodwin J, Uwano I, Yamashita F, Higuchi S, Wang Y, Ogasawara K, Ogawa A, Sasaki M. Oxygen extraction fraction measurement using quantitative susceptibility mapping: Comparison with positron emission tomography. Journal of cerebral blood flow and metabolism : official journal of the International Society of Cerebral Blood Flow and Metabolism 2016;36(8):1424-1433.
Figures