3223
Increased sensitivity for cerebral microbleed detection on SWI compared to QSM1University of California San Francisco, San Francisco, CA, United States
Synopsis
Although susceptibility weighted imaging (SWI) has been the standard method for quantifying and evaluating cerebral microbleeds, more recently total lesion susceptibility obtained from quantitative susceptibility mapping (QSM) has been found to correlate with measures of disease burden and can provide more accurate estimates of microbleed volume. This study found that 2.5 times as many CMBs can be detected on SWI compared to QSM images, with the number of CMBs missed by QSM increasing as a function of decreasing CMB size, highlighting the importance of including SWI for a more accurate assessment of disease burden in these patients.
Introduction
Cerebral microbleeds (CMBs) appear as small hypointense lesions, with spherical shape and a maximum diameter of <10mm on T2*-weighted gradient echo (GRE) magnitude images1. Representing focal accumulations of hemosiderin deposits2 with paramagnetic properties that cause signal loss due to susceptibility effects, CMBs are commonly observed in patients with cerebrovascular and neurodegenerative diseases1 such as stroke, Alzheimer’s disease, cerebral amyloid angiopathy, traumatic brain injury (TBI), irradiated brain tumors, dementia, and also in normal aging. Quantification of CMB properties such as their number, size, and location have been associated with disease severity and neurocognitive decline. Although susceptibility weighted imaging (SWI) has been the standard method for quantifying and evaluating CMBs, more recently total lesion susceptibility obtained from quantitative susceptibility mapping (QSM) has been found to correlate with measures of disease burden3. Because QSM reconstructs the source of a local susceptibility perturbation rather than the resulting dipole field, the technique can also provide more accurate estimates of CMB size compared to SWI. Although prior studies have directly compared CMB diameter measurements from QSM and SWI images from CMBs that were large enough to be visualized on QSM images3,4, we hypothesize that smaller CMBs may go undetected on QSM without the “blooming” effect that is inherent in the magnitude images underlying the SWI. The goal of this study was to directly compare the number of CMBs detected on QSM and SWI images and assess whether a relationship exists between CMB conspicuity and size.Methods
Subjects: A total of ten patients with radiation-induced CMBs due to prior radiation therapy of a glioma between 2 and 15 years prior were scanned on a GE MR950 7T scanner. A subset of these patients also underwent 3T MR imaging on the same day with a similar protocol. This mixed population allowed for a wide range of CMB locations, contrasts, and sizes, thus creating a broad spectrum of detection sensitivities from which the QSM and SWI images could be compared.MRI Protocol: At 7T, a 3D multi-echo gradient-recalled sequence (4 echoes, TE = 6/9.5/13/16.5ms, TR=50ms, FA=20°, bandwidth=50kHz, 0.8x0.8x1mm resolution, FOV=24x24x15cm) was performed for SWI using a 32-channel phase-array coil. GRAPPA-based parallel imaging with an acceleration factor of 3 and 16 auto-calibration lines was adopted to reduce the scan time. At 3T, an 8-echo scan was used (TE1/ΔTE/TE8= 14/3.4/37.8ms, TR=56ms, 0.9x0.9x2mm resolution).
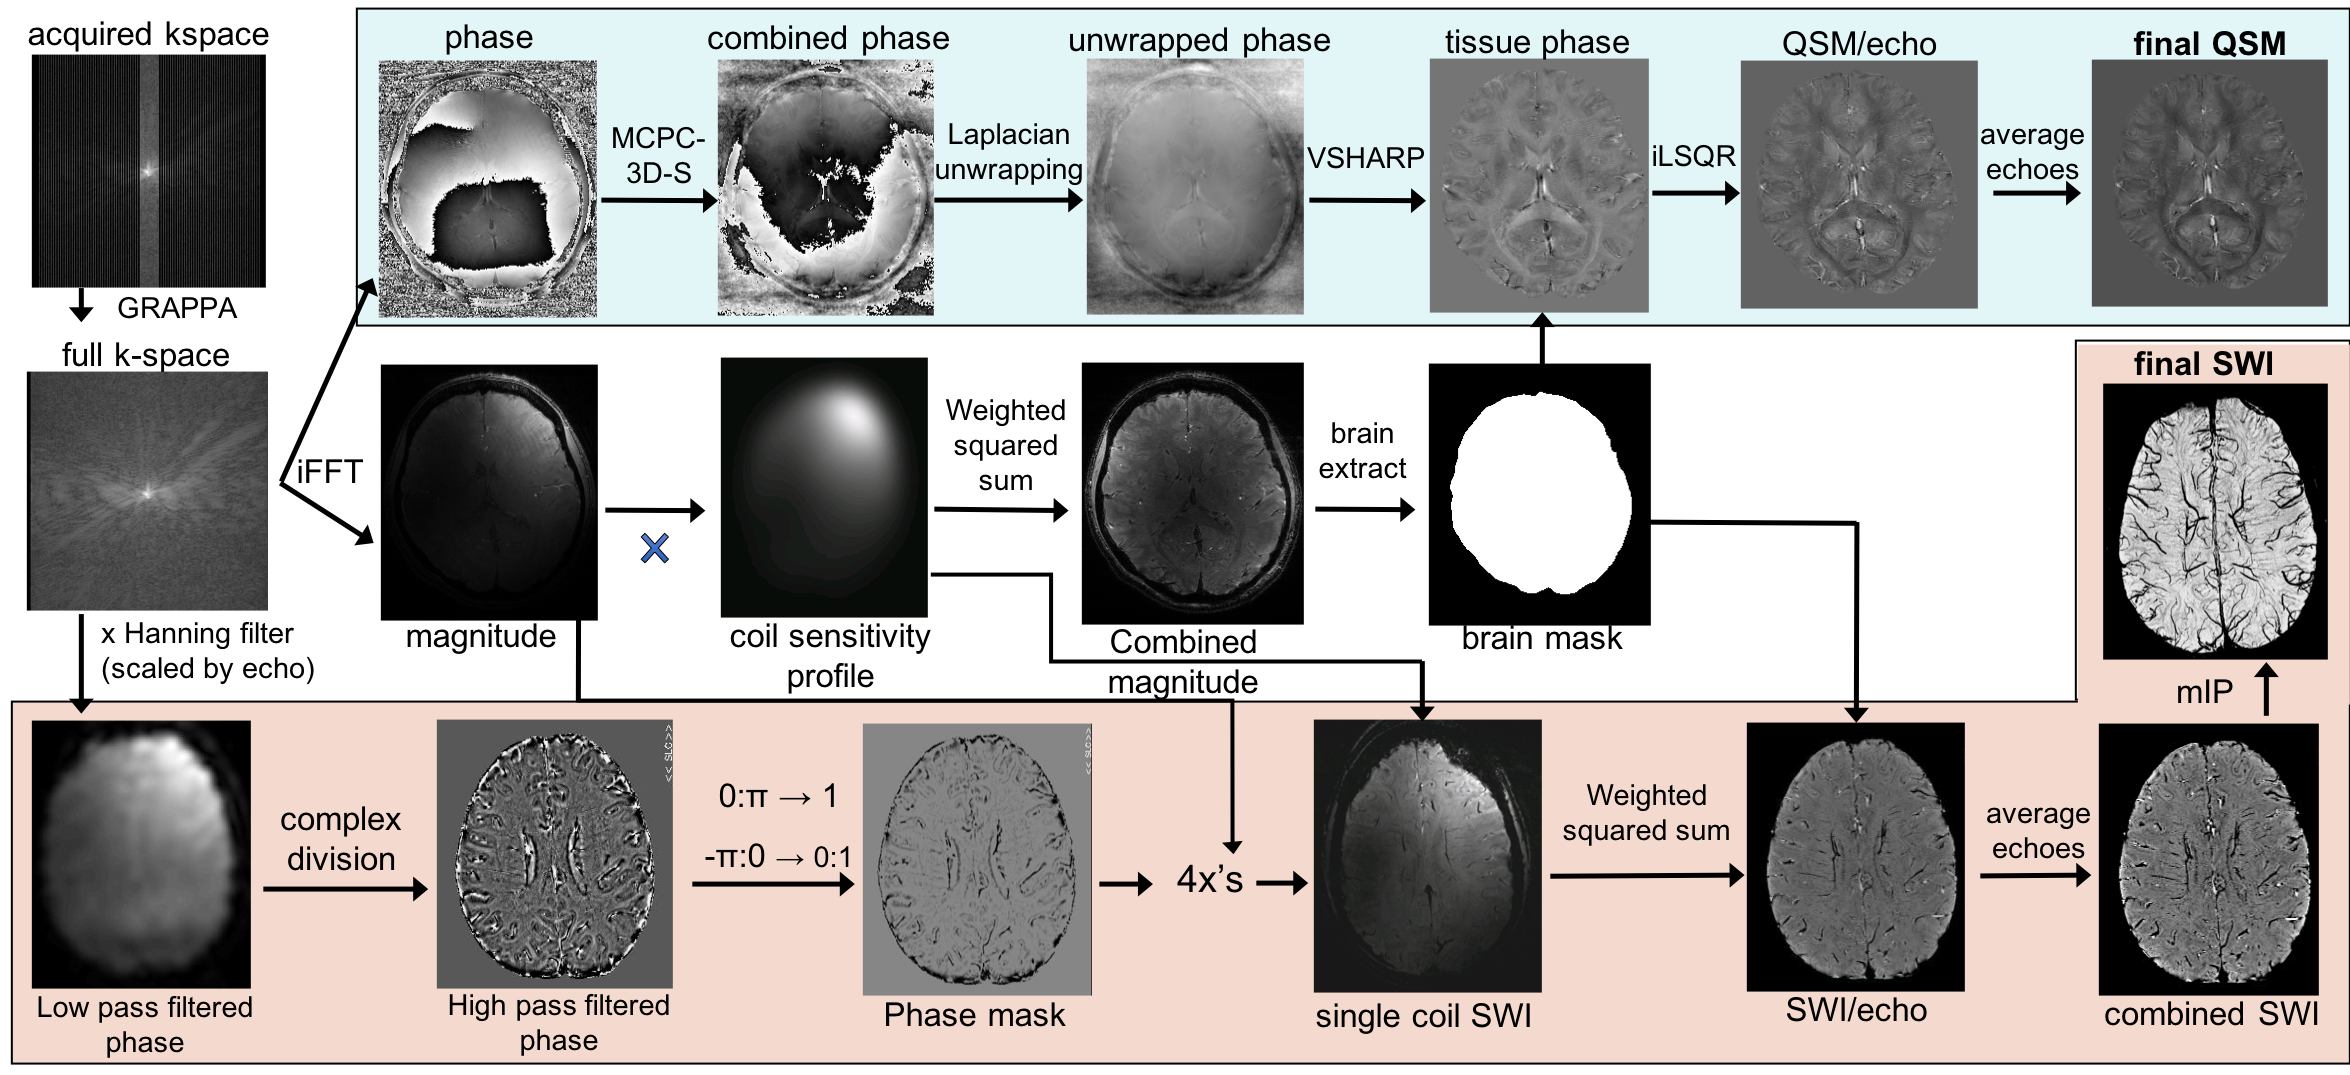
Image Processing: SWI and QSM images were reconstructed according to the pipeline in Figure 1. SWI processing utilized in-house software,5 while QSM processing employed existing algorithms: a 3D Laplacian-based method for phase unwrapping6, V-SHARP7 for background field removal, and iLSQR8 for dipole field inversion and reconstruction of the susceptibility maps. CMBs were manually labeled on QSM images by an experienced rater, whereas a semi-automatic algorithm developed previously9,10 was used to segment CMBs on SWI images. This algorithm provides accurate characterization of the overall CMB burden and the final output is a binary mask of individual CMBs that was then visualized by overlaying on SWI images. The number of CMBs detected from QSM and SWI images were compared using a Wilcoxon signed rank test and plotted as a function of CMB size discretized into 4 distinct bins.
Results
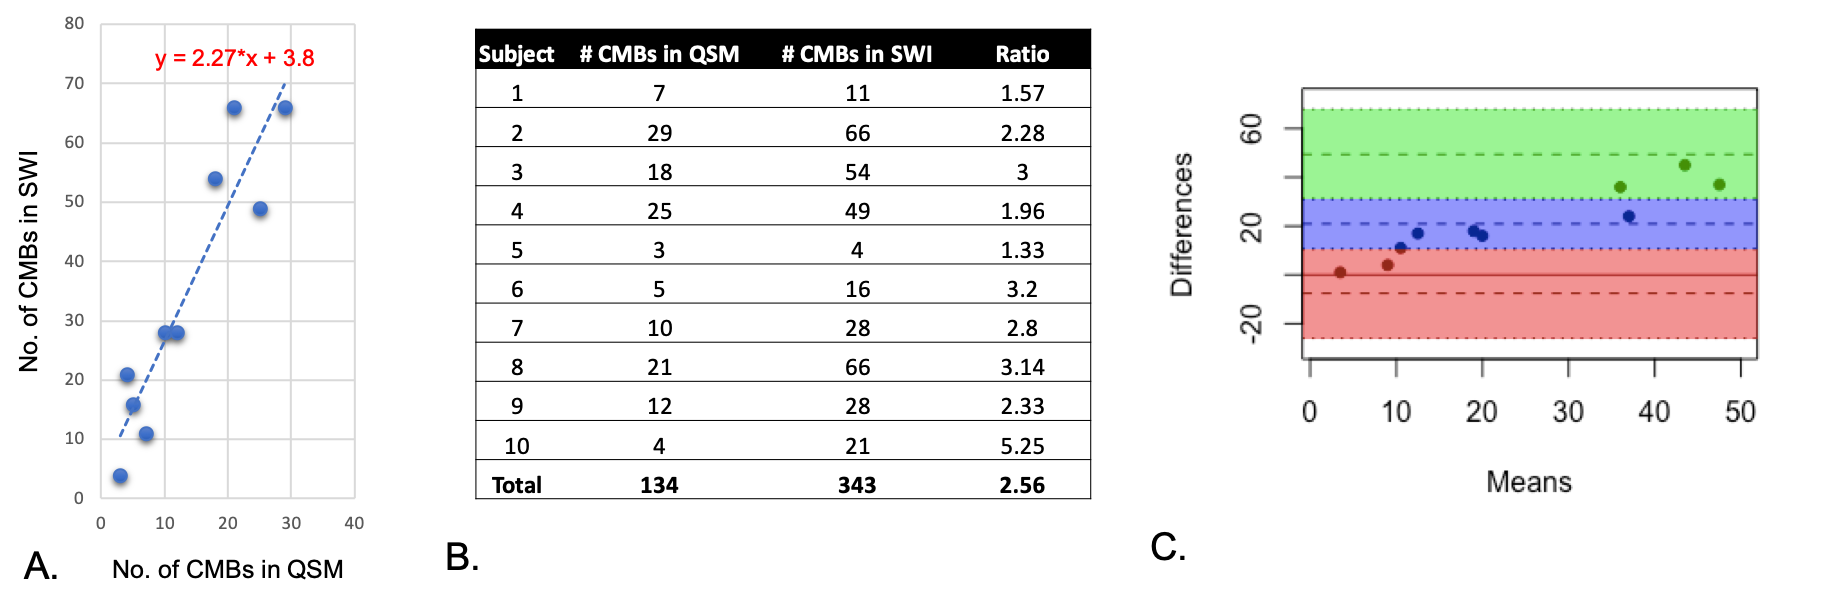
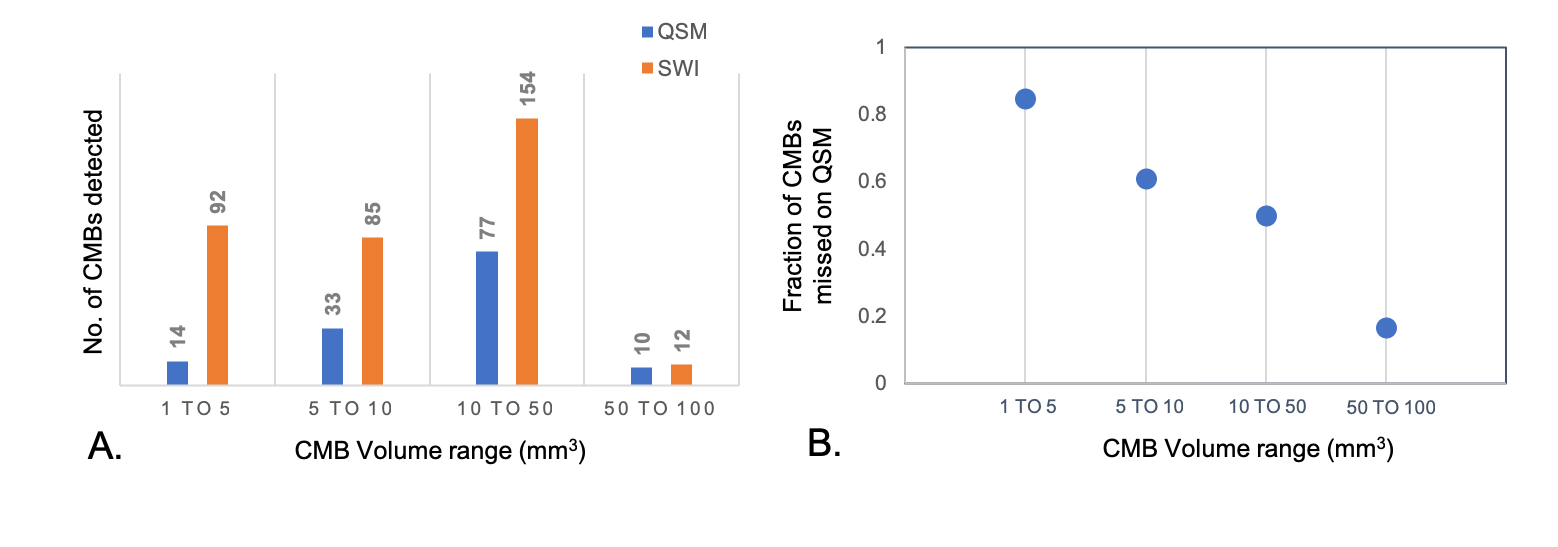
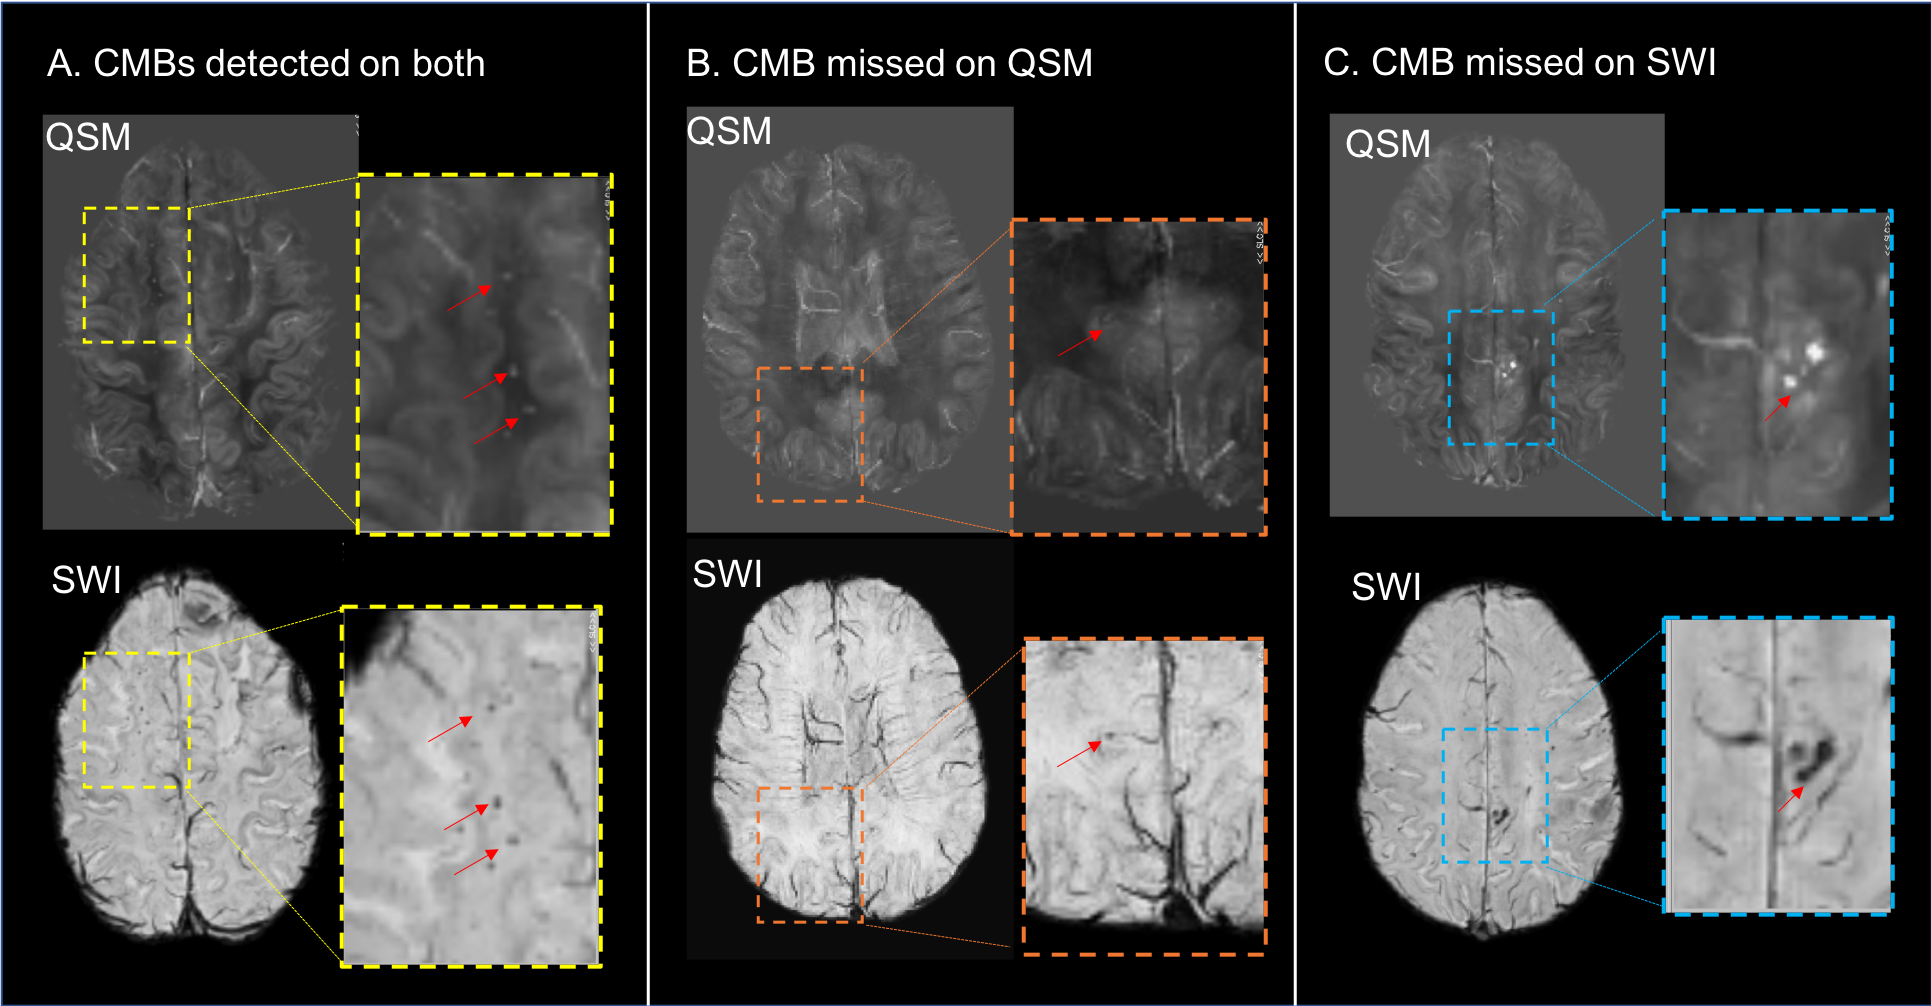
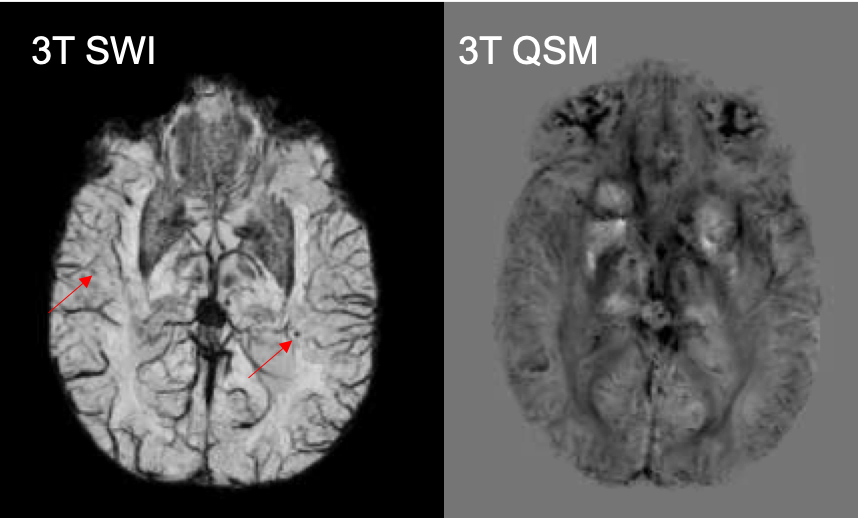
Although the number of CMBs detected on SWI and QSM were highly correlated (r=0.9025, p<0.0005), there were 2.5 times (range:1.33-5.25) as many CMBs detected on SWI compared to QSM (p<0.002; Figure 2). The total susceptibility of CMBs varied between 0.26-0.609 ppm, with a mean value of 0.45. As shown in Figure 3, for CMB volumes smaller than 5mm3, only 15% of the microbleeds were detected in QSM. The detection accuracy on QSM images then improved with increasing CMB volume, with 83% of CMBs larger than 50mm3 detected. Figure 4 depicts representative examples of CMBs detected on both QSM and SWI, only SWI and not QSM, and two that were mislabeled as a vein on SWI but correctly identified as two CMBs on QSM. All of the CMBs that were detected on the QSM images were also present on the SWI, except for the example in Figure 4C. Reviewing the subset of patients who had 3T scans as well revealed even fewer CMBs on QSM images, an example of which is shown in Figure 5.Discussion & Conclusions
Although QSM is beneficial for the evaluation of CMB susceptibility and for accurate volume quantification, SWI is more sensitive to detecting smaller CMBs due to the blooming effect, regardless of field strength. However, if many larger CMBs are present close enough together, this same enhancement can incorrectly cause these CMBs to be misclassified as a vessel on SWI. For studies that require QSM to evaluate total susceptibility of small lesions, an approach that first uses SWI for identifying lesions would provide a more accurate assessment of disease burden in these patients.Acknowledgements
The authors would like to acknowledge the support received from the following grant R01HD079568.References
1. Charidimou A, Werring DJ. Cerebral microbleeds: detection, mechanisms and clinical challenges. Future Neurology. 2011;6:587–611.
2. Fazekas F, Kleinert R, Roob G, et al. Histopathologic analysis of foci of signal loss on gradient-echo T2*-weighted MR images in patients with spontaneous intracerebral hemorrhage: evidence of microangiopathy related microbleeds. AJNR Am J Neuroradiol. 1999;20(4):637–642.
3. Liu T, Surapaneni K, Lou M, Cheng L, Spincemaille P, Wang Y. Cerebral microbleeds: burden assessment by using quantitative susceptibility mapping. Radiology. 2012;262(1):269–278.
4. Cronin MJ, Wang N, Decker KS, Wei H, Zhu WZ, Liu C. Exploring the origins of echo-time-dependent quantitative susceptibility mapping (QSM) measurements in healthy tissue and cerebral microbleeds. Neuroimage. 2017;149:98–113.
5. Bian W, Hess CP, Chang SM, Nelson SJ, Lupo JM. Susceptibility-weighted MR imaging of radiation therapy-induced cerebral microbleeds in patients with glioma: a comparison between 3T and 7T. Neuroradiology. 2014;56(2):91–96.
6. Li W, Wu B, Liu C. Quantitative susceptibility mapping of human brain reflects spatial variation in tissue composition. Neuroimage. 2011; 55: 1645– 1656.
7. Wu B, Li W, Guidon A, Liu C. Whole brain susceptibility mapping using compressed sensing. Magn Reson Med. 2012;67:137–147
8. Li W, Wang N, Yu F, Han H, Cao W, Romero R, Tantiwongkosi B, Duong TQ, Liu C. A method for estimating and removing streaking artifacts in quantitative susceptibility mapping. Neuroimage. 2015; 108: 111– 122.
9. Bian W, Hess CP, Chang SM, Nelson SJ, Lupo JM. Computer-aided detection of radiation-induced cerebral microbleeds on susceptibility-weighted MR images. NeuroImage Clin. 2013; 2:282–290.
10. Morrison MA, Payabvash S, Chen Y, et al. A user-guided tool for semi-automated cerebral microbleed detection and volume segmentation: Evaluating vascular injury and data labelling for machine learning. NeuroImage Clin. 2018; 20:498–505.
Figures