3222
Reduced QSM values in the caudate and amygdala of first episode mania patients1Physics and Astronomy, University of British Columbia, Vancouver, BC, Canada, 2Pediatrics, University of British Columbia, Vancouver, BC, Canada, 3Medicine (Neurology), University of British Columbia, Vancouver, BC, Canada, 4Laboratory of Molecular Psychiatry, Centro de Pesquisas Experimentais, Hospital de Clínicas de Porto Alegre, Porto Algre, Brazil, 5Mood Disorders Centre, University of British Columbia, Vancouver, BC, Canada, 6Psychiatry, University of British Columbia, Vancouver, BC, Canada
Synopsis
Bipolar I disorder is characterized by recurrent manic and depressive episodes. Both, dopamine and oxidative stress, resulting from mitochondrial dysfunction, have been implicated in BD and volumetric and metabolic changes have been reported. Nevertheless, it remains unknown whether changes result from treatment or ongoing disease, or if they are present at first episode mania. We used R2* and quantitative susceptibility mapping (QSM) to assess differences in brain iron and myelination in a cohort of first episode mania patients compared to controls. Patients exhibited lower QSM values than controls in the caudate and amygdala, possibly linked to iron loss or hypermyelination.
Introduction
Bipolar I disorder (BD) is characterized by recurrent manic and depressive episodes, which are interspersed by euthymic periods. The typically adolescent onset significantly impacts patient's lives, leaving them prone to substance abuse1 and suicide2. The etiology of BD remains unknown, although genetic and environmental factors are believed to play a role. Volumetric3-5 and metabolic changes6,7, increased dopamine receptor density8 and decreased presynaptic dopamine metabolism with treatment9, have been reported. However, it is unclear whether these findings express neurobiological changes that initiated before or at the time of the first episodes or if these are the result of ongoing disease or treatment. Recently, mitochondrial dysfunction has been implicated in BD10,11 as part of a potential oxidative stress cascade, which may contribute to neuroprogression12. Quantitative susceptibility mapping (QSM)13,14 and R2*15 allow to assess tissue iron concentrations that could amplify oxidative stress levels, but also yield information about the role of iron and myelin in brain health. Here, we assessed QSM and R2* in first episode mania (FEM) patients compared to age and sex-matched healthy individuals in brain regions previously implicated in BD16,17.Methods
30 euthymic FEM patients (15 male/15 female, age 23.8±5.3 years) and age and sex-matched healthy controls (age 24.4±5.5 years) were scanned at 3T (Philips Achieva) using an 8-channel head coil. Enrolled patients had their first manic episode within the two years prior to MRI. Average time between first episode and MRI was 3.5 month and the average number of previous episodes was 1.72±3.07, median 1. Patient co-morbidities included learning disability, anxiety, substance abuse, attention deficit hyperactivity disorder (ADHD) and obsessive-compulsive disorder. MRI included a 3DT1 at 1 mm3 isotropic resolution and a 3D gradient-echo, five echoes, TE1/ΔTE/TR=13/7/46 ms at 0.42x0.41x1 mm3 resolution. R2* maps were computed by single exponential fitting after background field correction. QSM maps were obtained by in-house dipole inversion14, after Laplacian unwrapping and V-SHARP. Median QSM values were normalized to white matter (WM) QSM values. Regions-of-interest (ROI) included the genu, body and splenium of the corpus callosum, the anterior and posterior cingulate gyrus, frontal pole, thalamus, caudate, putamen, globus pallidus, superior temporal gyrus, precuneus cortex, nucleus accumbens, ventral striatum, hippocampus and amygdala16,17. These were obtained by FSL FIRST18 and MNI atlas registration (Harvard-Oxford, striatal, JHU DTI WM) to age-specific group templates, created from the acquired control data using ABSORB19. Group differences were assessed by mixed effects modelling (R), including the effects of ROI volumes, age, sex, co-morbidities, time since first episode and number of previous episodes. P-values <0.025 were considered significant, Bonferroni-adjusted for the use of QSM and R2* in this hypothesis-generating study.Results
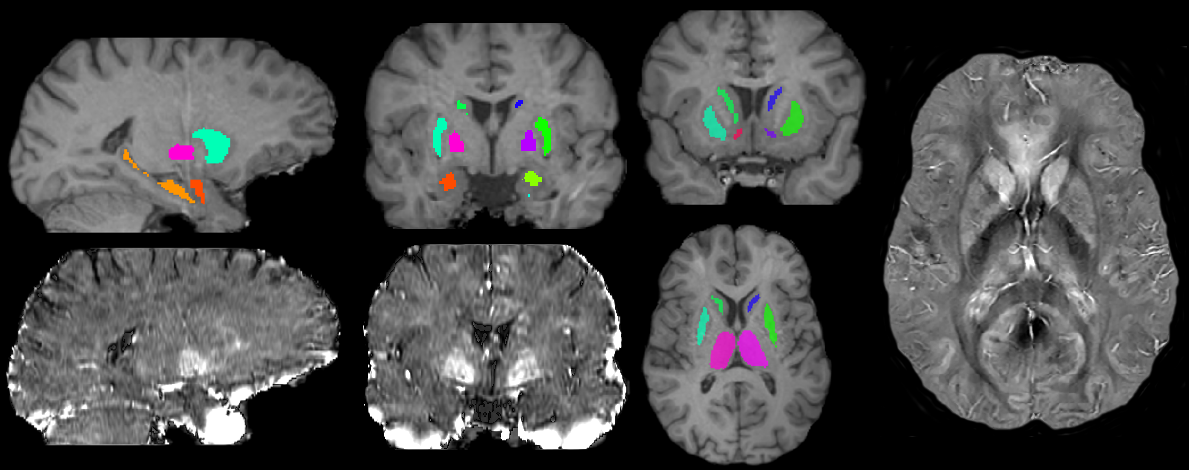
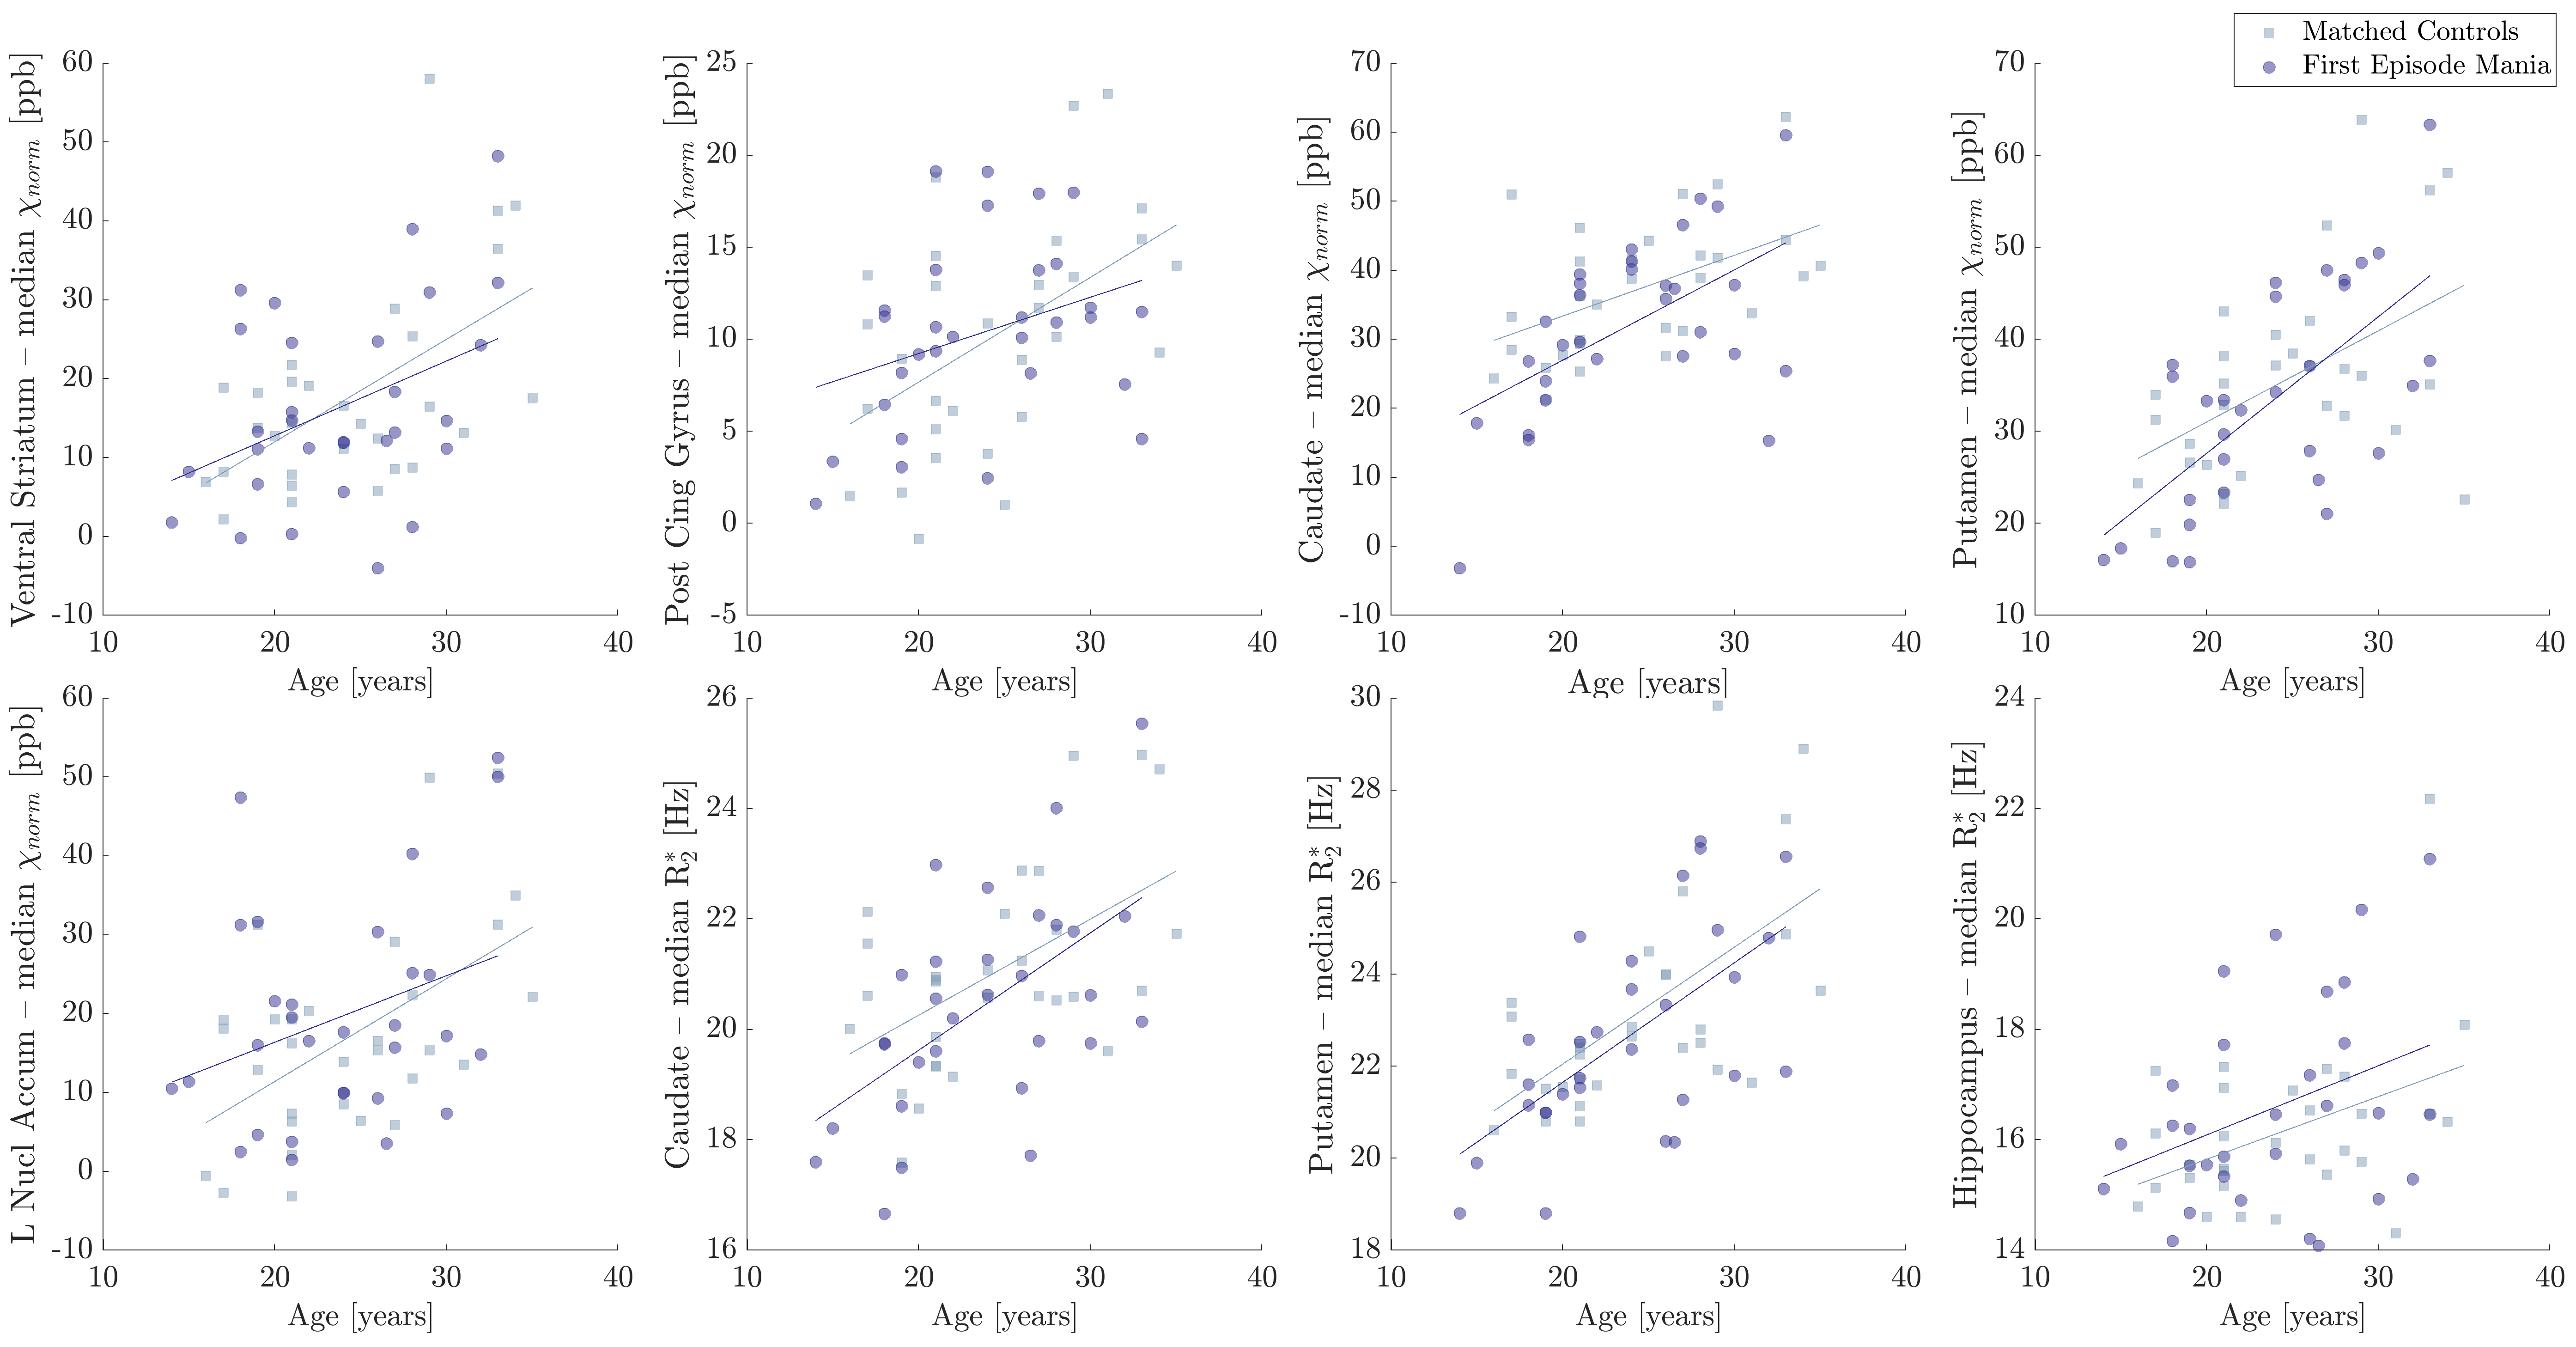
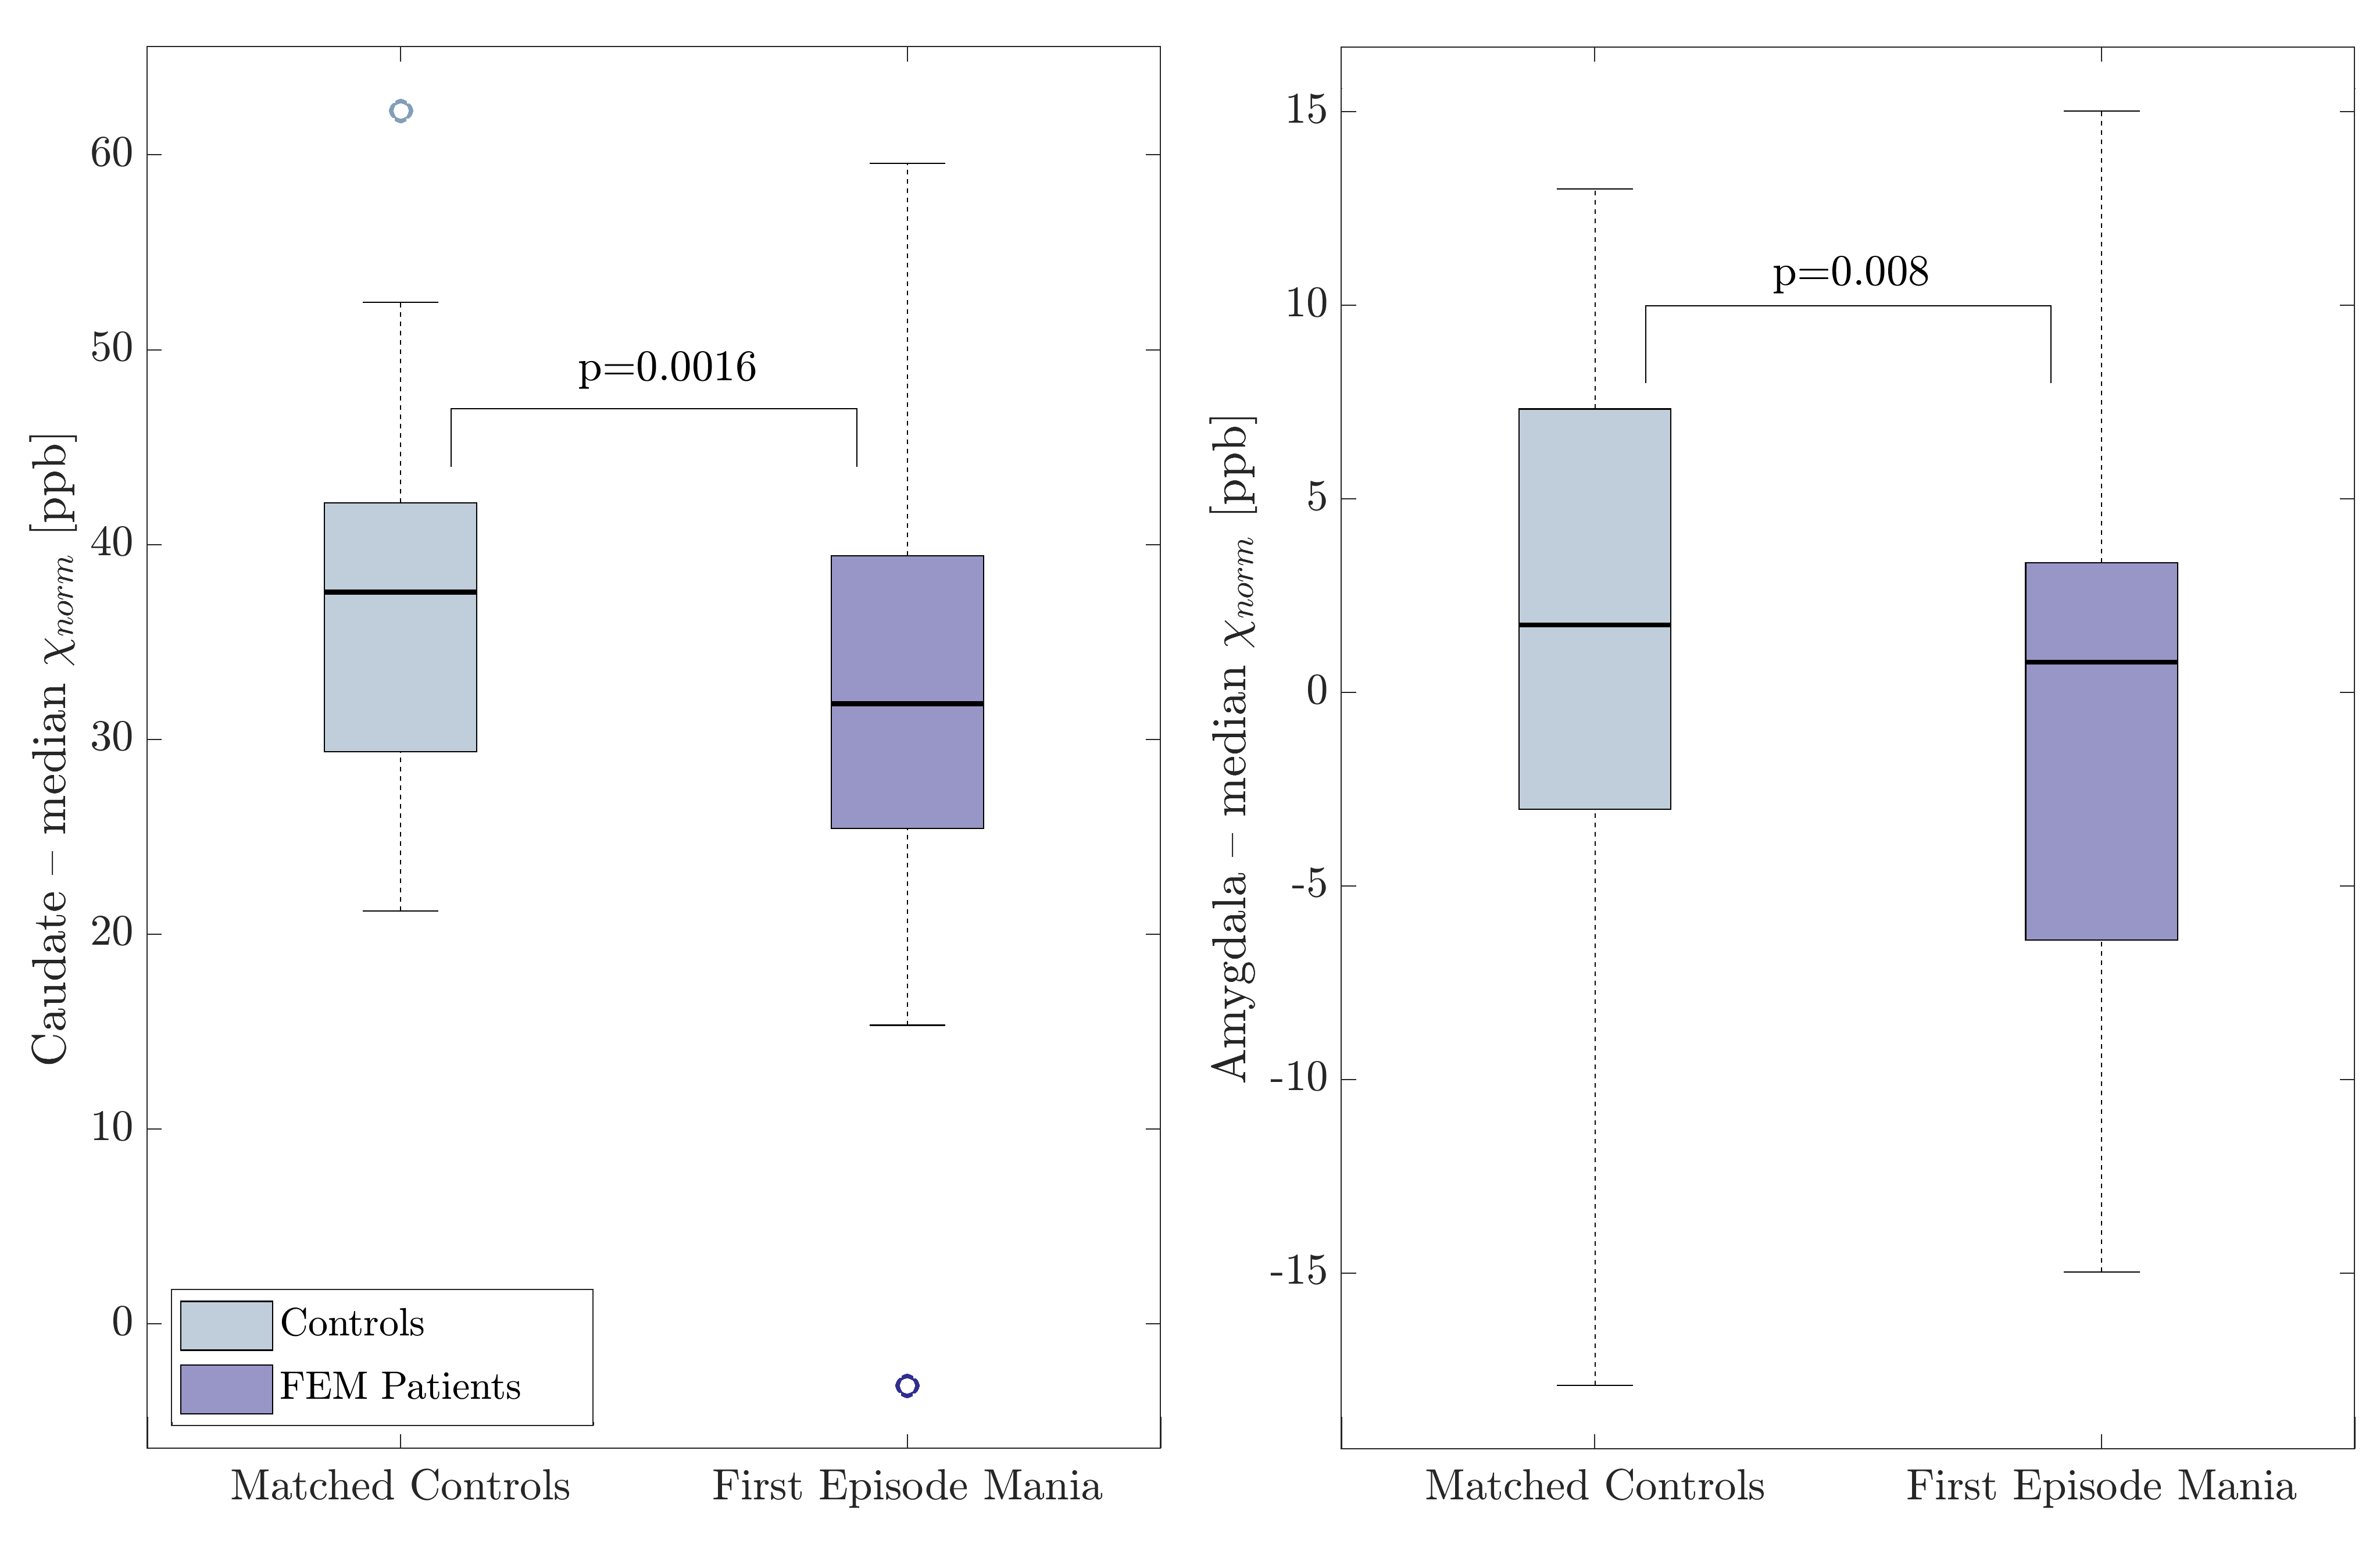
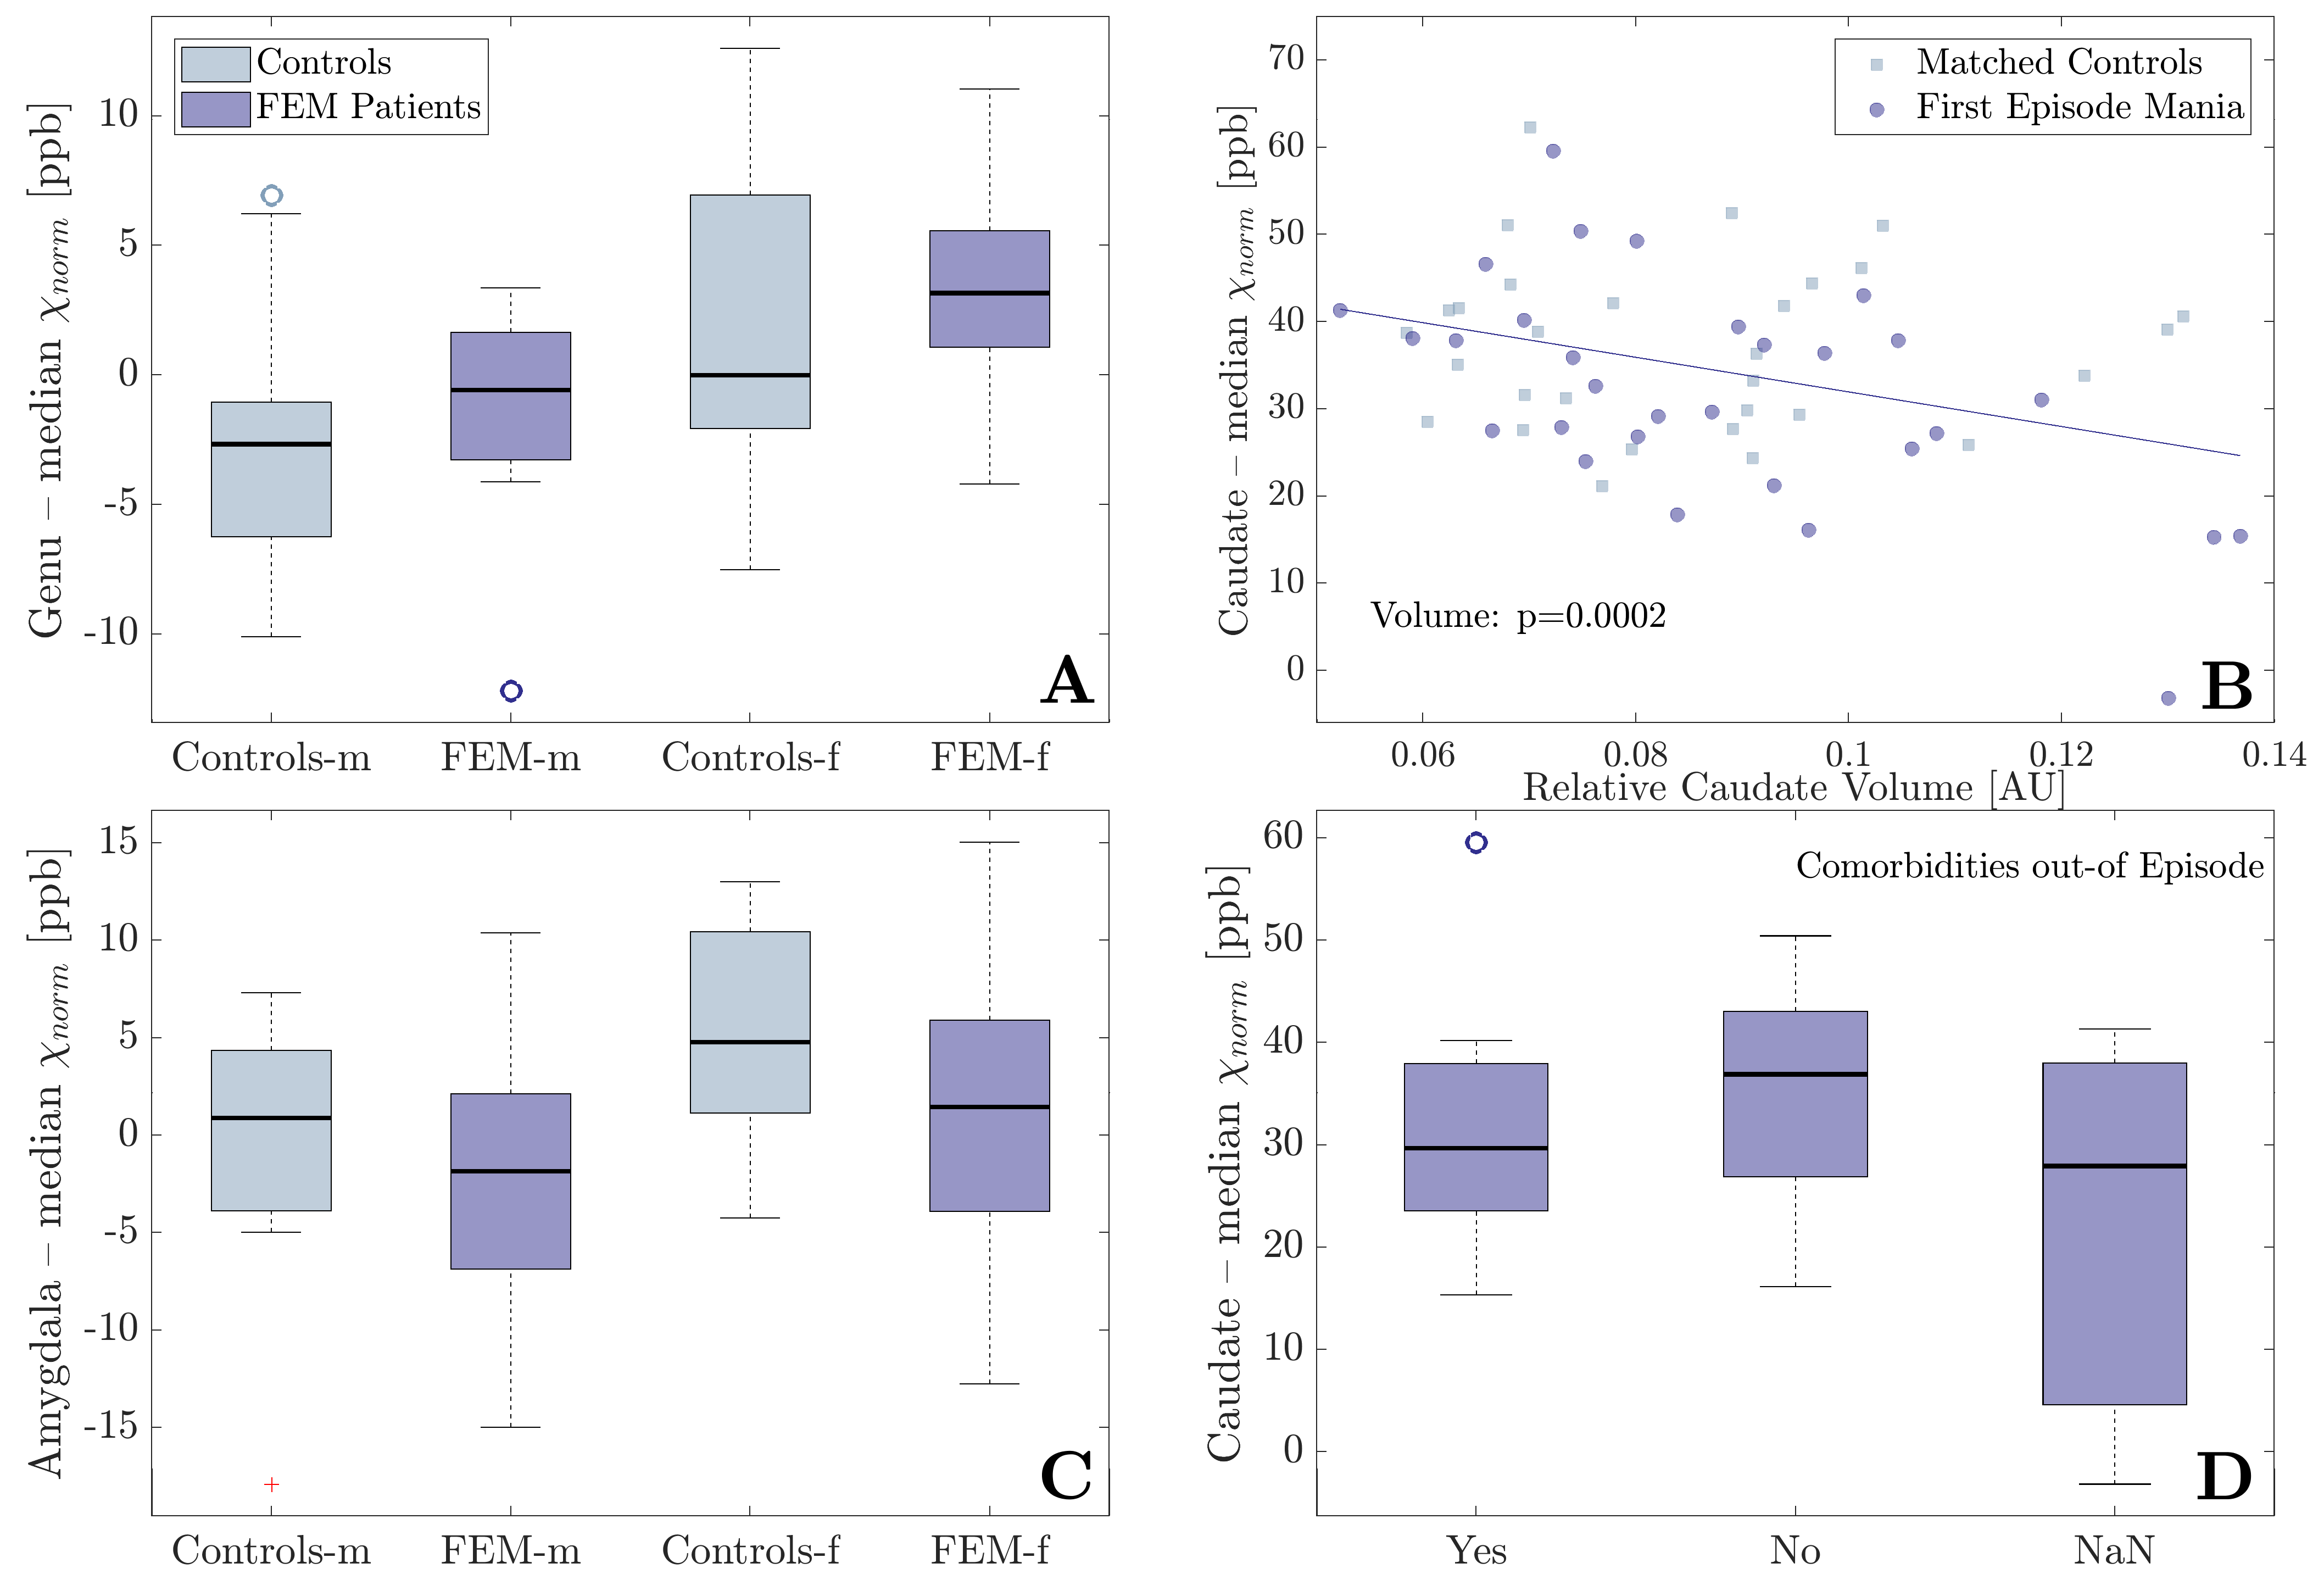
Example QSM, R2* and T1w images from one patient, indicating some ROIs, are displayed in Fig. 1. The number of previous episodes correlated positively with R2* in the amygdala, but not with QSM. Time since first episode had no significant effect on R2* nor QSM. Both, R2* and QSM, correlated positively with age in most regions, without a significant group-by-age interaction (Fig. 2, p>0.027). The linear regression model detected significantly lower QSM values in the caudate (p=0.0016) and the amygdala (p=0.008) of FEM patients compared to controls, after adjusting for sex, age, co-morbidities and ROI volume differences (Fig. 3). There were no significant group-by-sex, group-by-age or group-by-volume interactions. However, the amygdala and the genu showed significant sex differences, demonstrating higher QSM values in females than males (Fig. 4A &C). Moreover, the caudate QSM values were significantly linked to caudal volumes (p=0.0002, Fig. 4B). No significant group differences were found for R2* (p>0.08). Although neither in- nor out-of-episode co-morbidities directly affected R2* and QSM measurements when all regions were considered (p > 0.4), the mixed effects model showed a decrease in caudal QSM values in patients with co-morbidities (Fig. 4D).Discussion
Reduced QSM values in patients compared to controls may indicate lower iron concentrations, due to either iron loss, or dilution of iron by structural enlargement. The reduction was independent of age, suggesting differences may be present at FEM, not developing with disease duration. Enlargement of the amygdala and caudate has been reported in some studies20,21. However, the lack of group-by-volume interactions on R2* and QSM measurements suggests that tissue changes other than volume contribute to the observed group differences, although some link between caudal volume and caudal QSM exists. Iron deficiency has been described in restless leg syndrome22, ADHD23 and in patients suffering from migraines, depression and anxiety24 and may relate to a downregulation of dopaminergic activity. Independent of iron, our findings may also be explained by hypermyelination. Studies have reported increased activity in both the caudate and amygdala25,26, which is believed to link to WM integrity and myelination, although the relationship is not fully understood.Conclusion
We observed localized QSM reductions in the amygdala and caudate of patients following their first manic episode, compared to matched healthy controls. Both of these regions are frequently implicated in BD and have important functions in the pathways of emotional behaviour. The reduction in QSM values may suggest iron deficiency or hypermyelination in FEM patients. Both of these hypotheses find support in existing literature20-26, but further work is needed to discern them.Acknowledgements
This study was funded by a Canadian Institute of Health Research (CIHR) operating grant. VW has been supported by the MS Society of Canada. AR is supported by Canada Research Chairs.References
[1] Wilens et al. Further evidence for smoking and substance use disorders in youth with bipolar disorder and comorbid conduct disorder. J Clin Psychiatry 2016;77(10):1420-1427.
[2] Brent et al. Risk factors for adolescent suicide. A comparison of adolescent victims with suicidal inpatients. Arch Gen Psychiatry 1988;45(6):581-588.
[3] Lisy et al. Progressive neurostructural changes in adolescent and adult patients with bipolar disorder. Bipolar Disord 2011;13(4):396-405.
[4] DelBello et al. Magnetic resonance imaging analysis of amygdala and other subcortical brain regions in adolescents with bipolar disorder. Bipolar Disord 2004;6(1):43-52.
[5] Strakowski et al. Structural brain abnormalities in first-episode mania. Biol Psychiatry 1993;33(8-9):602-609.
[6] Atmaca et al. Hippocampal 1H MRS in first-episode bipolar I patients. Prog Neuropsychopharmacol Biol Psychiatry 2006;30(7):1235-1239.
[7] Öngür et al. Abnormal glutamatergic neurotransmission and neuronal-glial interactions in acute mania. Biol Psychiatry 2008;64(8):718-726.
[8] Pearlson et al. In vivo D2 dopamine receptor density in psychotic and nonpsychotic patients with bipolar disorder. Arch Gen Psychiatry1995; 52:471-477.
[9] Yatham et al. PET study of [18F] 6-fluoro-L-dopa uptake in neuroleptic-and mood-stabilizer-naive first-episode nonpsychotic mania: effects of treatment with divalproex sodium. Am J Psychiatry 2002;159(5):768-774.
[10] Clay et al. Mitochondrial dysfunction in pathology in bipolar disorder and schizophrenia. Int J Dev Neurosci 2011;29(3):311-324.
[11] Scaini et al., Mitochondrial dysfunction in bipolar disorder: evidence, pathophysiology and translational implications. Neurosci Biobehav Rev 2016,68:694-713.
[12] Berk et al. Pathways underlying neuroprogression in bipolar disorder: focus on inflammation, oxidative stress and neurotrophic factors. Neurosci Biobehav Rev 2011;35(3):804-817.
[13] Li et al., Quantitative susceptibility mapping of human brain reflects spatial variation in tissue composition. NeuroImage 2011;55(4):1645-1656.
[14] Kames et al., Rapid two-step QSM without a priori information. NeuroImage 2018;167:276-283.
[15] Sedlacik et al., Reversible, irreversible and effective transverse relaxation rates in normal aging brain at 3 T. NeuroImage 2014;84:1032-1041.
[16] Hibar, et al. Subcortical volumetric abnormalities in bipolar disorder. Mol Psychiatry 2016;21(12):1710-1716.
[17] Lu et al. Structural imaging biomarkers for bipolar disorder: Meta-analyses of whole-brain voxel-based morphometry studies. Depress Anxiety 2019;36(4):353-364.
[18] Patenaude et al A Bayesian model of shape and appearance for subcortical brain. NeuroImage 2011;56(3):907-922.
[19] Jia et al. ABSORB; Atlas building by self-organized registration and bundeling. NeuroImage 2010;51(3):1057-1070.
[20] Strakowski et al. Brain magnetic resonance imaging of structural abnormalities in bipolar disorder. Arch Gen Psychiatry 1999;56:254-260.
[21] Wilke et al. Voxel-based morphometry in adolescents with bipolar disorder: first results. Psychiatry Res: Neuroimaging 2004;131(1):57-69.
[22] Allen R. Dopamine and iron in the pathophysiology of restless legs syndrome (RLS). Sleep Med 2004;5(4):385-391.
[23] Cortese et al. Brain iron levels in attention-deficit/hyperactivity disorder: A pilot MRI study. World J Biol Psychiatry 2012;13(3):223-231.
[24] Pamuk et al. Is iron-deficiency anemia associated with migraine? Is there a role for anxiety and depression? Wien Klin Wochenschr 2016;128(Suppl 8):576-580.
[25] Altshuler et al. Increased amygdala activation during mania: a functional magnetic resonance imaging study. Am J Psychiatry 2005;162(6):1211-1213.
[26] Blumberg et al. Increased anterior cingulate and caudate activity in bipolar mania. Biol Psychiatry 2000;48(11):1045-1052.
Figures