3221
Clinical viable QSM using accelerated, segmented 3D EPI with inline, automated QSM post-processing
Monique Tourell1,2, Ashley Stewart1,2, Jin Jin2,3,4,5, Sunil Patil6, Kieran O'Brien1,2,3, Simon Robinson1,7,8, and Markus Barth1,2,5
1Centre for Advanced Imaging, University of Queensland, Brisbane, Australia, 2ARC Training Centre for Innovation in Biomedical Imaging Technology, The University of Queensland, Brisbane, Australia, 3Siemens Healthcare Pty Ltd, Brisbane, Australia, 4Mark and Mary Stevens Neuroimaging and Informatics Institute, University of Southern California, Los Angeles, CA, United States, 5School of Information Technology and Electrical Engineering, the University of Queensland, Brisbane, Australia, 6Siemens Healthcare Pty Ltd, Malvern, PA, United States, 7High Field Magnetic Resonance Centre, Department of Biomedical Imaging and Image-guided Therapy, Medical University of Vienna, Vienna, Austria, 8Department of Neurology, Medical University of Graz, Graz, Austria
1Centre for Advanced Imaging, University of Queensland, Brisbane, Australia, 2ARC Training Centre for Innovation in Biomedical Imaging Technology, The University of Queensland, Brisbane, Australia, 3Siemens Healthcare Pty Ltd, Brisbane, Australia, 4Mark and Mary Stevens Neuroimaging and Informatics Institute, University of Southern California, Los Angeles, CA, United States, 5School of Information Technology and Electrical Engineering, the University of Queensland, Brisbane, Australia, 6Siemens Healthcare Pty Ltd, Malvern, PA, United States, 7High Field Magnetic Resonance Centre, Department of Biomedical Imaging and Image-guided Therapy, Medical University of Vienna, Vienna, Austria, 8Department of Neurology, Medical University of Graz, Graz, Austria
Synopsis
Successful translation of QSM into the clinic requires the combination of fast imaging protocols with robust, automated on-scanner processing. In this work we present clinical viable QSM: acquisition of phase data using accelerated, segmented 3D EPI in 30 seconds, and automated QSM post-processing on the scanner in under 2 minutes. The resultant susceptibility maps were of comparable quality to those obtained using a GRE sequence. Analysis of the susceptibilities measured within the caudate, putamen and pallidum demonstrates that 3D EPI with on-scanner processing produces susceptibility values in good agreement with those obtained from a GRE sequence, and offline processing pipelines.
Introduction
Quantitative Susceptibility Mapping uses phase information to produce maps of magnetic susceptibility that give insight into tissue composition and structural organization. Within the research community QSM is a rapidly advancing field, however translation of the method into the clinic is hindered by a number factors, including: (1) the long acquisition times of traditionally used gradient echo pulse sequences and (2) the necessity of exporting large amounts of raw data for QSM processing offline. Previous work has shown that 3D EPI1,2 phase data can produce high quality susceptibility maps using the total generalized variation (TGV) offline QSM processing pipeline.3 In this work, we perform a QSM acquisition and reconstruction that can be achieved as standard practice in the clinic; acquiring 3 T whole-brain images using a segmented 3D EPI sequence and performing image reconstruction, automatic brain segmentation and QSM post-processing inline on the scanner. We directly compare the resultant susceptibility maps to those obtained using a GRE sequence with the same resolution, and to offline processing.Methods
Two participants were scanned on a Siemens MAGNATOM Prisma 3T MR scanner with a 64-channel head/neck coil (software version VE11, Siemens Healthcare, Erlangen, Germany). The segmented 3D EPI images, TA = 31 s including all reference and phase correction scans, were acquired with TE/TR = 23/43 ms, EPI factor = 19, ipat = 2×1, BW = 750 Hz/Px. For comparison, a GRE sequence with TA = 6 minutes was acquired with TE/TR = 11.5/30 ms, ipat = 2, BW = 100 Hz/Px. For both sequences, FOV = 208 × 208 × 112 mm3 with an isotropic resolution of 1 mm. Reconstruction and post-processing was performed with the online QSM functor described previously,4 using the atlas-based automatic brain segmentation and TGV processing pipeline.3 Reconstruction on the scanner took under 2 minutes. For comparison, both 3D EPI and GRE data was also processed with an offline TGV QSM pipeline, implemented in Python.Results and Discussion
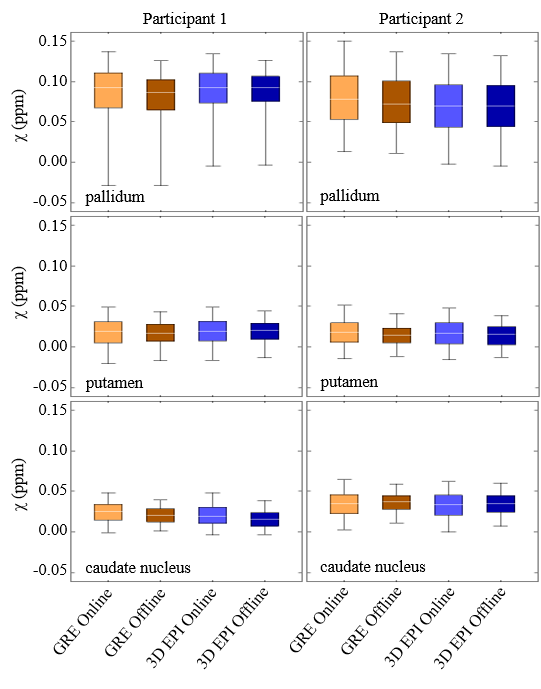
Examples of susceptibility maps for two participants derived from the 3D EPI and GRE sequences using both the online and offline TGV processing pipelines are shown in Figure 1. The difference maps between GRE and 3D EPI show good agreement between sequences, particularly in deep gray matter and the cortex, indicating that the TGV algorithm is well suited to different TEs. The largest variations in these difference maps are seen in vessels, which can be attributed to different flow compensation considerations of the two sequences. Difference maps between the offline and online processing vary slightly (by ± 0.02 ppm) in areas of large B0 change across both sequences. Since both online and offline QSM processing used images derived from the online image reconstruction, this is the result of the online/offline TGV processing alone, and will be the subject of future investigation. Analysis of the susceptibilities measured within the caudate, putamen and pallidum are shown in Figure 2. The susceptibility distributions are consistent across the sequences and processing pipelines, and are comparable to previously reported values.2 Additionally, the spread of values for each sub-cortical region is consistent across the GRE and 3D EPI sequences, indicating that the lower SNR of the 3D EPI sequence does not significantly impact the accuracy of the derived susceptibility values. The segmented 3D EPI sequence implemented here is expected to improve QSM processing compared to single shot acquisitions.3 Reducing the length of the echo train through segmentation reduces distortions and shifts in echo time, which would be expected to affect derived susceptibility values. Additionally, a segmented sequence allows more flexibility in TE while achieving the resolution necessary for QSM processing. We note that the clinically viable TA of 31s is achieved here without acceleration in the second phase encoding direction. Lower TAs, required for fMRI for example, could be easily achieved by incorporating CAIPI and acceleration in the partition dimension.1Conclusion
We have demonstrated a QSM acquisition and reconstruction that can be performed routinely in the clinic, acquiring 3D EPI data in 30 s and performing automatic QSM post-processing on the scanner in under 2 minutes. The derived susceptibility values are comparable to those obtained from a similar GRE sequence and when using offline processing. This is an essential step towards validation of QSM across a range of clinical applications and translation of the method into the clinic.Acknowledgements
This research was funded by the Australian Government through the Australian Research Council (project number IC170100035). SR is supported by Marie Skłodowska-Curie Action MS-fMRI-QSM 794298. The authors are very grateful to Aiman Al Najjar and Thomas Shaw, Centre for Advanced Imaging, for help with participant scanning.References
- B. A. Poser, P. J. Koopmans, T. Witzel, L. L. Wald and M. Barth, Neuroimage, 2010, 51, 261–266.
- D. Stäb, S. Bollmann, C. Langkammer, K. Bredies and M. Barth, NMR Biomed., 2017, 30,e3620.
- C. Langkammer, K. Bredies, B. A. Poser, M. Barth, G. Reishofer, A. P. Fan, B. Bilgic, F. Fazekas, C. Mainero and S. Ropele, Neuroimage, 2015, 111, 622–630.
- A. W. Stewart, K. O’Brien, K. Jinsuh, B. Maréchal, F. Nasrallah, M. Kean, M. Barth and S. Bollmann, in Proc. Intl. Soc. Mag. Reson. Med. 27, Montreal, 2019.
Figures
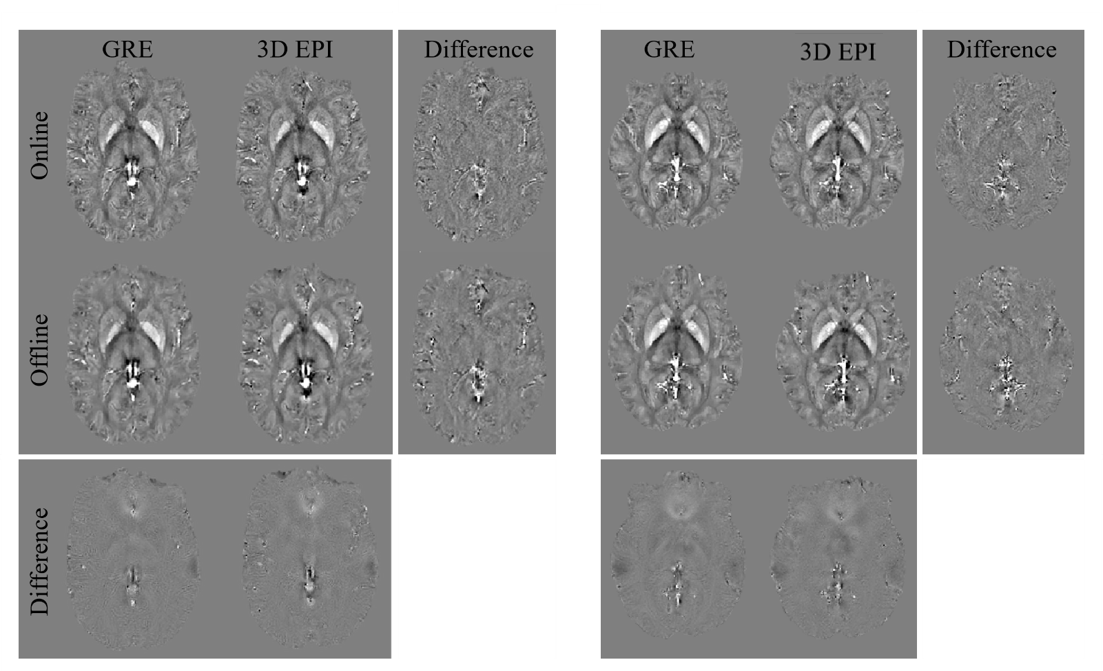
Figure 1. Susceptibility and difference maps for the GRE and 3D EPI sequences with online and offline TGV processing for participant 1
(left three columns) and participant 2 (right three columns)
Figure
2.
Susceptibility distributions for participant 1 (left column) and participant 2
(right column) of the different sub-cortical regions, pallidum, putamen and
caudate nucleus. Distributions are GRE with online processing (orange), GRE
with offline processing (darker orange), 3D EPI with online processing (blue),
3D EPI with offline processing (darker blue). Boxes indicate 25th to
75th percentiles, whiskers indicate 1st and 99th
percentiles and white lines indicate median values.