3219
Using QSM to Quantify Microbubble Concentrations1Medical Physics and Biomedical Engineering, University College London, London, United Kingdom, 2Magnetic Resonance Imaging, The Francis Crick Institute, London, United Kingdom
Synopsis
Microbubbles are a well-established intravascular ultrasound contrast agent. There is increasing interest in MRI-guided microbubble-mediated focused ultrasound treatments such as thermal surgery. MRI magnitude has a non-linear and non-local dependence on microbubble size and volume fraction, making it unsuitable for estimating microbubble concentrations. Quantitative Susceptibility Mapping (QSM) is a strong candidate for tracking microbubble concentration, destruction and clearance because the susceptibility depends linearly on the volumetric bubble concentration. Here, we show the first QSM of microbubbles in a phantom and observe that the measured susceptibility has a high SNR and is directly proportional to the microbubble volumetric concentration.
Purpose
To develop a reliable QSM method for detection and quantification of a microbubble contrast agent.Introduction
Although microbubbles are a well-established intravascular ultrasound contrast agent (1), a few studies have shown that they can enhance the image contrast in MRI (2,3). There is also increasing interest in MRI-guided microbubble-mediated focused ultrasound treatments such as thermal surgery (4) and targeted delivery of drugs, antibodies or genes (5). MRI techniques currently used to detect microbubbles exploit the local decrease in the signal magnitude due to the magnetic susceptibility difference between microbubbles and the surrounding tissues. Signal magnitude decreases not only around microbubbles but also close to veins or other strong susceptibility sources, making it difficult to separate these effects. Furthermore, the signal magnitude also has a non-linear and non-local dependence on microbubble size and volume fraction (6) making it difficult to relate signal decreases to the quantity of microbubbles at a specific location. More direct detection of microbubbles should be possible based on measuring the local magnetic susceptibility, $$$χ$$$, since it is not dependent on the size of the bubbles but on their volumetric concentration (6). This makes quantitative magnetic susceptibility mapping (QSM) a strong candidate for tracking microbubble concentration, destruction and clearance. In this work we show the first QSM of microbubbles in a phantom and investigate the dependence of $$$χ$$$ and R2* values on the microbubble concentration.Methods
Phantom preparation: Expancel microspheres (Nouryon, Netherlands) were used as their copolymer shell makes them stable over several years. Expancel microbubbles have a core gas susceptibility of $$$χ_{HC(CH3)3}$$$ = 2.2 ppb and a mean (± standard deviation) diameter d = 11.8 ± 6.0 µm. Six cylindrical sample tubes were filled with ultrasound gel containing different volumetric concentrations of Expancel: CV = [0.0, 0.4, 0.8, 1.2, 1.6, 2.0] %. These tubes were glued to the bottom of a cylindrical container (7 cm diameter) filled with saline solution (0.9% NaCl).Measurement: Experiments were performed on a 9.4T scanner (Bruker BioSpec 94/20 USR, Germany) using a transmit-receive volume coil with 86 mm inner diameter. The long axis of the sample tubes was aligned with the main magnetic field. 3D GRE was acquired with 8 bipolar echoes: TEfirst/dTE/TElast = 5.10/1.75/17.35 ms, and TR = 31 ms, receiver bandwidth = 781 Hz/pix, flip angle = 10°, matrix size = 256x256x214 and 300 µm isotropic resolution.
Data analysis: Odd and even echoes were processed separately in Matlab (MathWorks, USA) and the resulting odd and even R2* and $$$χ$$$ maps were averaged. R2* maps were obtained using linear fit to the natural log-transformed magnitude data. Field maps were obtained from a non-linear fit of the complex data (7) and both maps were unwrapped using ROMEO (8). The unwrapped field map was masked using simple thresholding of the magnitude image at TE=6.85 ms. Background fields were removed with PDF (9) and susceptibility calculation was performed with Tikhonov regularization (10) using α = 0.05.
Results
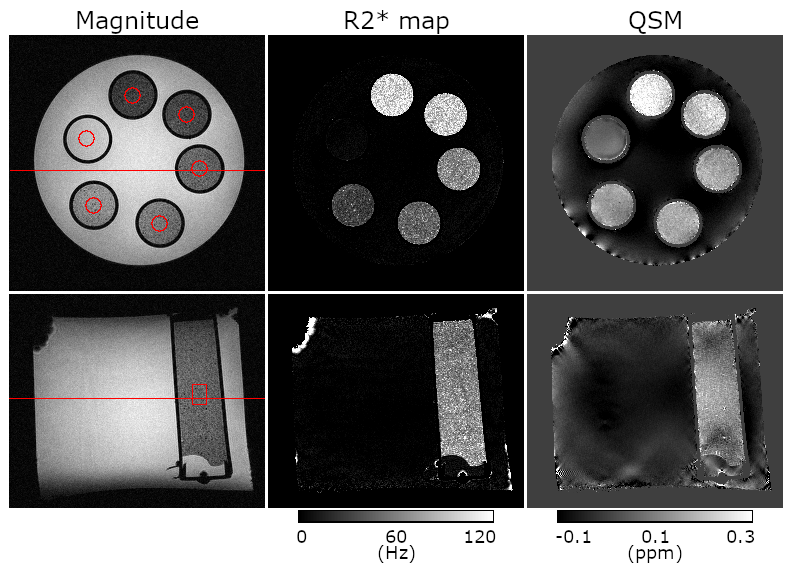
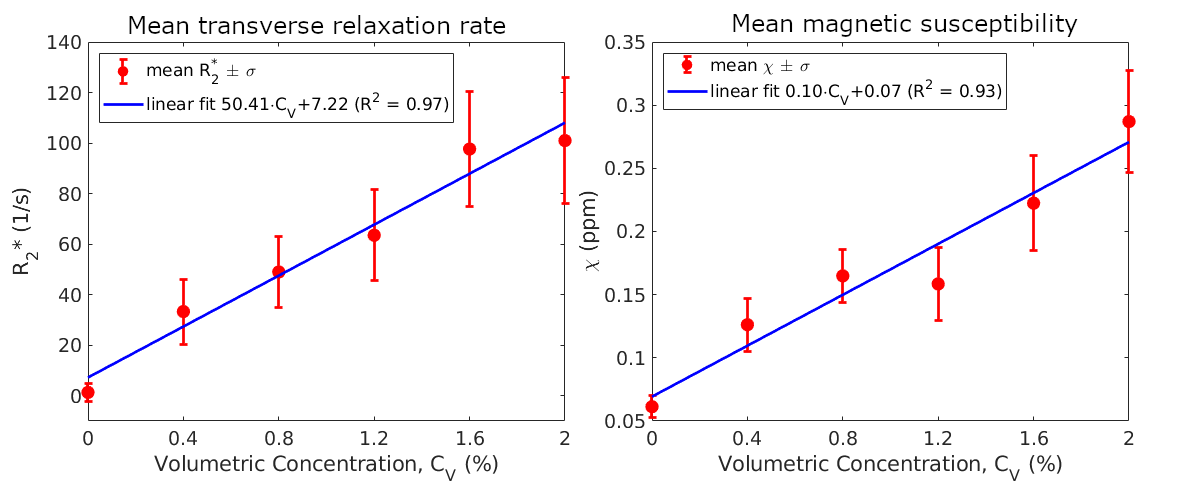
Fig.1 shows contrast differences in the magnitude image (TE = 10.35 ms), R2* map and QSM in the six tubes containing different microbubble concentrations. The darkest tube in the magnitude image and the brightest in the R2* and $$$χ$$$ maps contained the highest concentration of Expancel. Two perpendicular planes are illustrated, their relative position marked by red lines in the magnitude image. Red circles in the top row and a rectangle in the bottom row outline cylindrical regions of interest (ROI) identical in size in which mean R2* and $$$χ$$$ values were calculated and plotted in Fig. 2.Fig.2 illustrates the linear dependence of R2* and $$$χ$$$ on the volumetric concentration of microbubbles, CV. The goodness of fit was R2 = 0.97 for R2* and R2 = 0.93 for $$$χ$$$. Extrapolating to CV = 100%, the empirical susceptibility difference would be extrapolated to $$$χ$$$ = 10.07 ppm, which agrees relatively well with the susceptibility difference between the Expancel core gas and water: $$$Δχ_{HC(CH3)3-H2O}$$$=9.03 ppm. Assuming the ultrasound gel has a $$$χ$$$ similar to water, the discrepancy between these susceptibilities might be reduced if the $$$χ$$$ of the copolymer shell was known and taken into account. The contrast-to-noise ratio (CNR) in each ROI was calculated as $$$\left(\bar{S_{C_V}}-\bar{S_{0\%}}\right)\diagup\sigma_{0\%}$$$, where $$$\bar{S}$$$ is the mean R2* or $$$χ$$$ value and $$$\sigma_{0\%}$$$, is the standard deviation in the ROI drawn in pure ultrasound gel (CV = 0%), yielding: $$$CNR_{R_2^*}$$$ = [0, 8.8, 13.1, 17.1, 26.5, 27.5], $$$CNR_{χ}$$$= [0, 7.4, 11.8, 11.0, 18.3, 25.7] for all CV. The signal-to-noise ratio (SNR) in each ROI was calculated using $$$\bar{S_{C_V}}\diagup\sigma_{C_V}$$$ yielding $$$SNR_{R_2^*}$$$=[0.4, 2.6, 3.5, 3.5, 4.3, 4.0], $$$SNR_{χ}$$$=[7.0, 6.1, 7.8, 5.5, 5.9, 7.1].
Conclusions
We have demonstrated that it is feasible to obtain reliable QSM of microbubbles and to estimate their volumetric concentration based on the susceptibility values measured in a phantom. Both $$$χ$$$ and R2* show a linear dependence on the microbubble concentration. QSM had a slightly lower CNR but a greater SNR than the R2* map. Detection of microbubbles in vivo using QSM would be clinically transformative as it would greatly facilitate the use of microbubbles as a dual-modality ultrasound-MRI contrast agent.Acknowledgements
BD is supported by Marie Skłodowska-Curie Action: MRI COMIQSUM 798119. KS is supported by ERC Consolidator Grant DiSCo MRI SFN 770939. Many thanks to S. Bertazzo for giving us access to his laboratory facilities.References
1. Ferrara K, Pollard R, Borden M. Ultrasound Microbubble Contrast Agents: Fundamentals and Application to Gene and Drug Delivery. Annu. Rev. Biomed. Eng. 2007;9:415–447 doi: 10.1146/annurev.bioeng.8.061505.095852.
2. Wong KK, Huang I, Kim YR, et al. In vivo study of microbubbles as an MR susceptibility contrast agent. Magn. Reson. Med. 2004;52:445–452 doi: 10.1002/mrm.20181.
3. Cheung JS, Chow AM, Guo H, Wu EX. Microbubbles as a novel contrast agent for brain MRI. NeuroImage 2009;46:658–664 doi: 10.1016/j.neuroimage.2009.02.037.
4. Hynynen K. MRI-guided focused ultrasound treatments. Ultrasonics 2010;50:221–229 doi: 10.1016/j.ultras.2009.08.015.
5. Poon C, McMahon D, Hynynen K. Noninvasive and targeted delivery of therapeutics to the brain using focused ultrasound. Neuropharmacology 2017;120:20–37 doi: 10.1016/j.neuropharm.2016.02.014.
6. Dharmakumar R, Plewes DB, Wright GA. On the parameters affecting the sensitivity of MR measures of pressure with microbubbles. Magn. Reson. Med. 2002;47:264–273 doi: 10.1002/mrm.10075.
7. Liu T, Wisnieff C, Lou M, Chen W, Spincemaille P, Wang Y. Nonlinear formulation of the magnetic field to source relationship for robust quantitative susceptibility mapping. Magn. Reson. Med. 2013;69:467–476 doi: 10.1002/mrm.24272.
8. Dymerska B, Eckstein K, Trattnig S, Shmueli K, Robinson SD. Rapid Opensource Minimum Spanning TreE AlgOrithm for Phase Unwrapping (ROMEO). Proc. BCISMRM 2019.
9. Liu T, Khalidov I, Rochefort L de, et al. A novel background field removal method for MRI using projection onto dipole fields (PDF). NMR Biomed. 2011;24:1129–1136 doi: 10.1002/nbm.1670.
10. Kressler B, de Rochefort L, Liu T, Spincemaille P, Jiang Q, Wang Y. Nonlinear Regularization for Per Voxel Estimation of Magnetic Susceptibility Distributions from MRI Field Maps. IEEE Trans. Med. Imaging 2010;29:273–281 doi: 10.1109/TMI.2009.2023787.
Figures