3218
Liver iron content measurement in living mice with quantitative susceptibility mapping1Laboratory of Imaging Biomarkers, Center of Research on Inflammation, UMR1149 Inserm-University Paris Diderot, Paris, France, 2Department of biochemistry, University Hospital Paris Nord - Beaujon, AP-HP, Clichy, France
Synopsis
To evaluate the feasibility of quantitative susceptibility mapping (QSM) in living mice liver and the robustness of QSM and transverse relaxation rate (R2*) based liver iron quantification. We show that QSM can be accurately performed in mice liver despite respiratory motion and that magnetic susceptibility measurements correlate more strongly with inductively coupled plasma mass spectrometry (ICP-MS) based iron quantification and have smaller standard deviations and narrower Bland-Altman agreement limits than R2* measurements.
Introduction
QSM is a relatively new MR imaging method that allows for non-invasive quantification of iron and other magnetic susceptibility sources, which are more paramagnetic or diamagnetic than water (1). Although QSM was originally developed for brain imaging, applications to quantify liver iron start to appear (2,3). In small animals, a recent ex vivo study showed that liver iron content could be quantified with QSM and R2* (4). The aim of our study was to assess the feasibility and robustness of QSM for liver iron quantification in living mice liver.Methods
The experiments were approved by our Institutional Animal Care and Ethical Committee. We used 20 adult male C57BL6/J mice (Envigo, Gannat, France) divided in 4 groups. Group 1 (n=5) received an intravenous injection of saline, whereas groups 2 to 4 (n=5) received an intravenous injection of iron oxide nanoparticles (USPIO P01240, CheMatech, Dijon, France; hydrodynamic diameter 25-30 nm) with respective concentrations of 20, 50 and 100 µmol/kg (Fe / mouse body weight). MRI was performed with a Biospec 7.0T scanner (Bruker, Ettlingen, Germany) 24 hours after USPIO injection in isoflurane anesthetized mice. A three-dimensional ultrashort TE acquisition sequence was used with spatial resolution of 0.32 mm and field of view of 40 mm in all dimensions. Nine echo times from 0 ms up to 4 ms were optimized to match closely in-phase and out-phase conditions for fat and water protons. After imaging, the mice were euthanized and the livers harvested for ICP-MS (X-Series II ICP-MS, Thermo Fisher Scientific). Three mice were excluded from the analysis due to death after USPIO intravenous injection (n=1, group 1) and failure of the reference method (n=2, group 4). The R2* rate and field map were corrected for each other and for the presence of fat using a T2*-IDEAL approach (3). QSM was performed using a single-step reconstruction algorithm based on the approach developed by Bilgic et al (5). Regions with high air content (lungs and stomach) were removed from QSM reconstructions, and the susceptibility was calculated relative to the average susceptibility of spinal muscle. R2* and susceptibility average values and standard deviations were calculated on a liver ROI, avoiding large vessels. For each linear fit of data that we performed, the coefficient of determination, or the squared Pearson correlation coefficient, R2, was calculated. Regression parameters obtained in the linear fit of susceptibility and R2* versus ICP-MS iron content was used to convert susceptibility and R2* values to iron content (in mg/g). These converted values were compared with ICP-MS iron content in Bland-Altman analysis, using ICP-MS as a reference method.Results
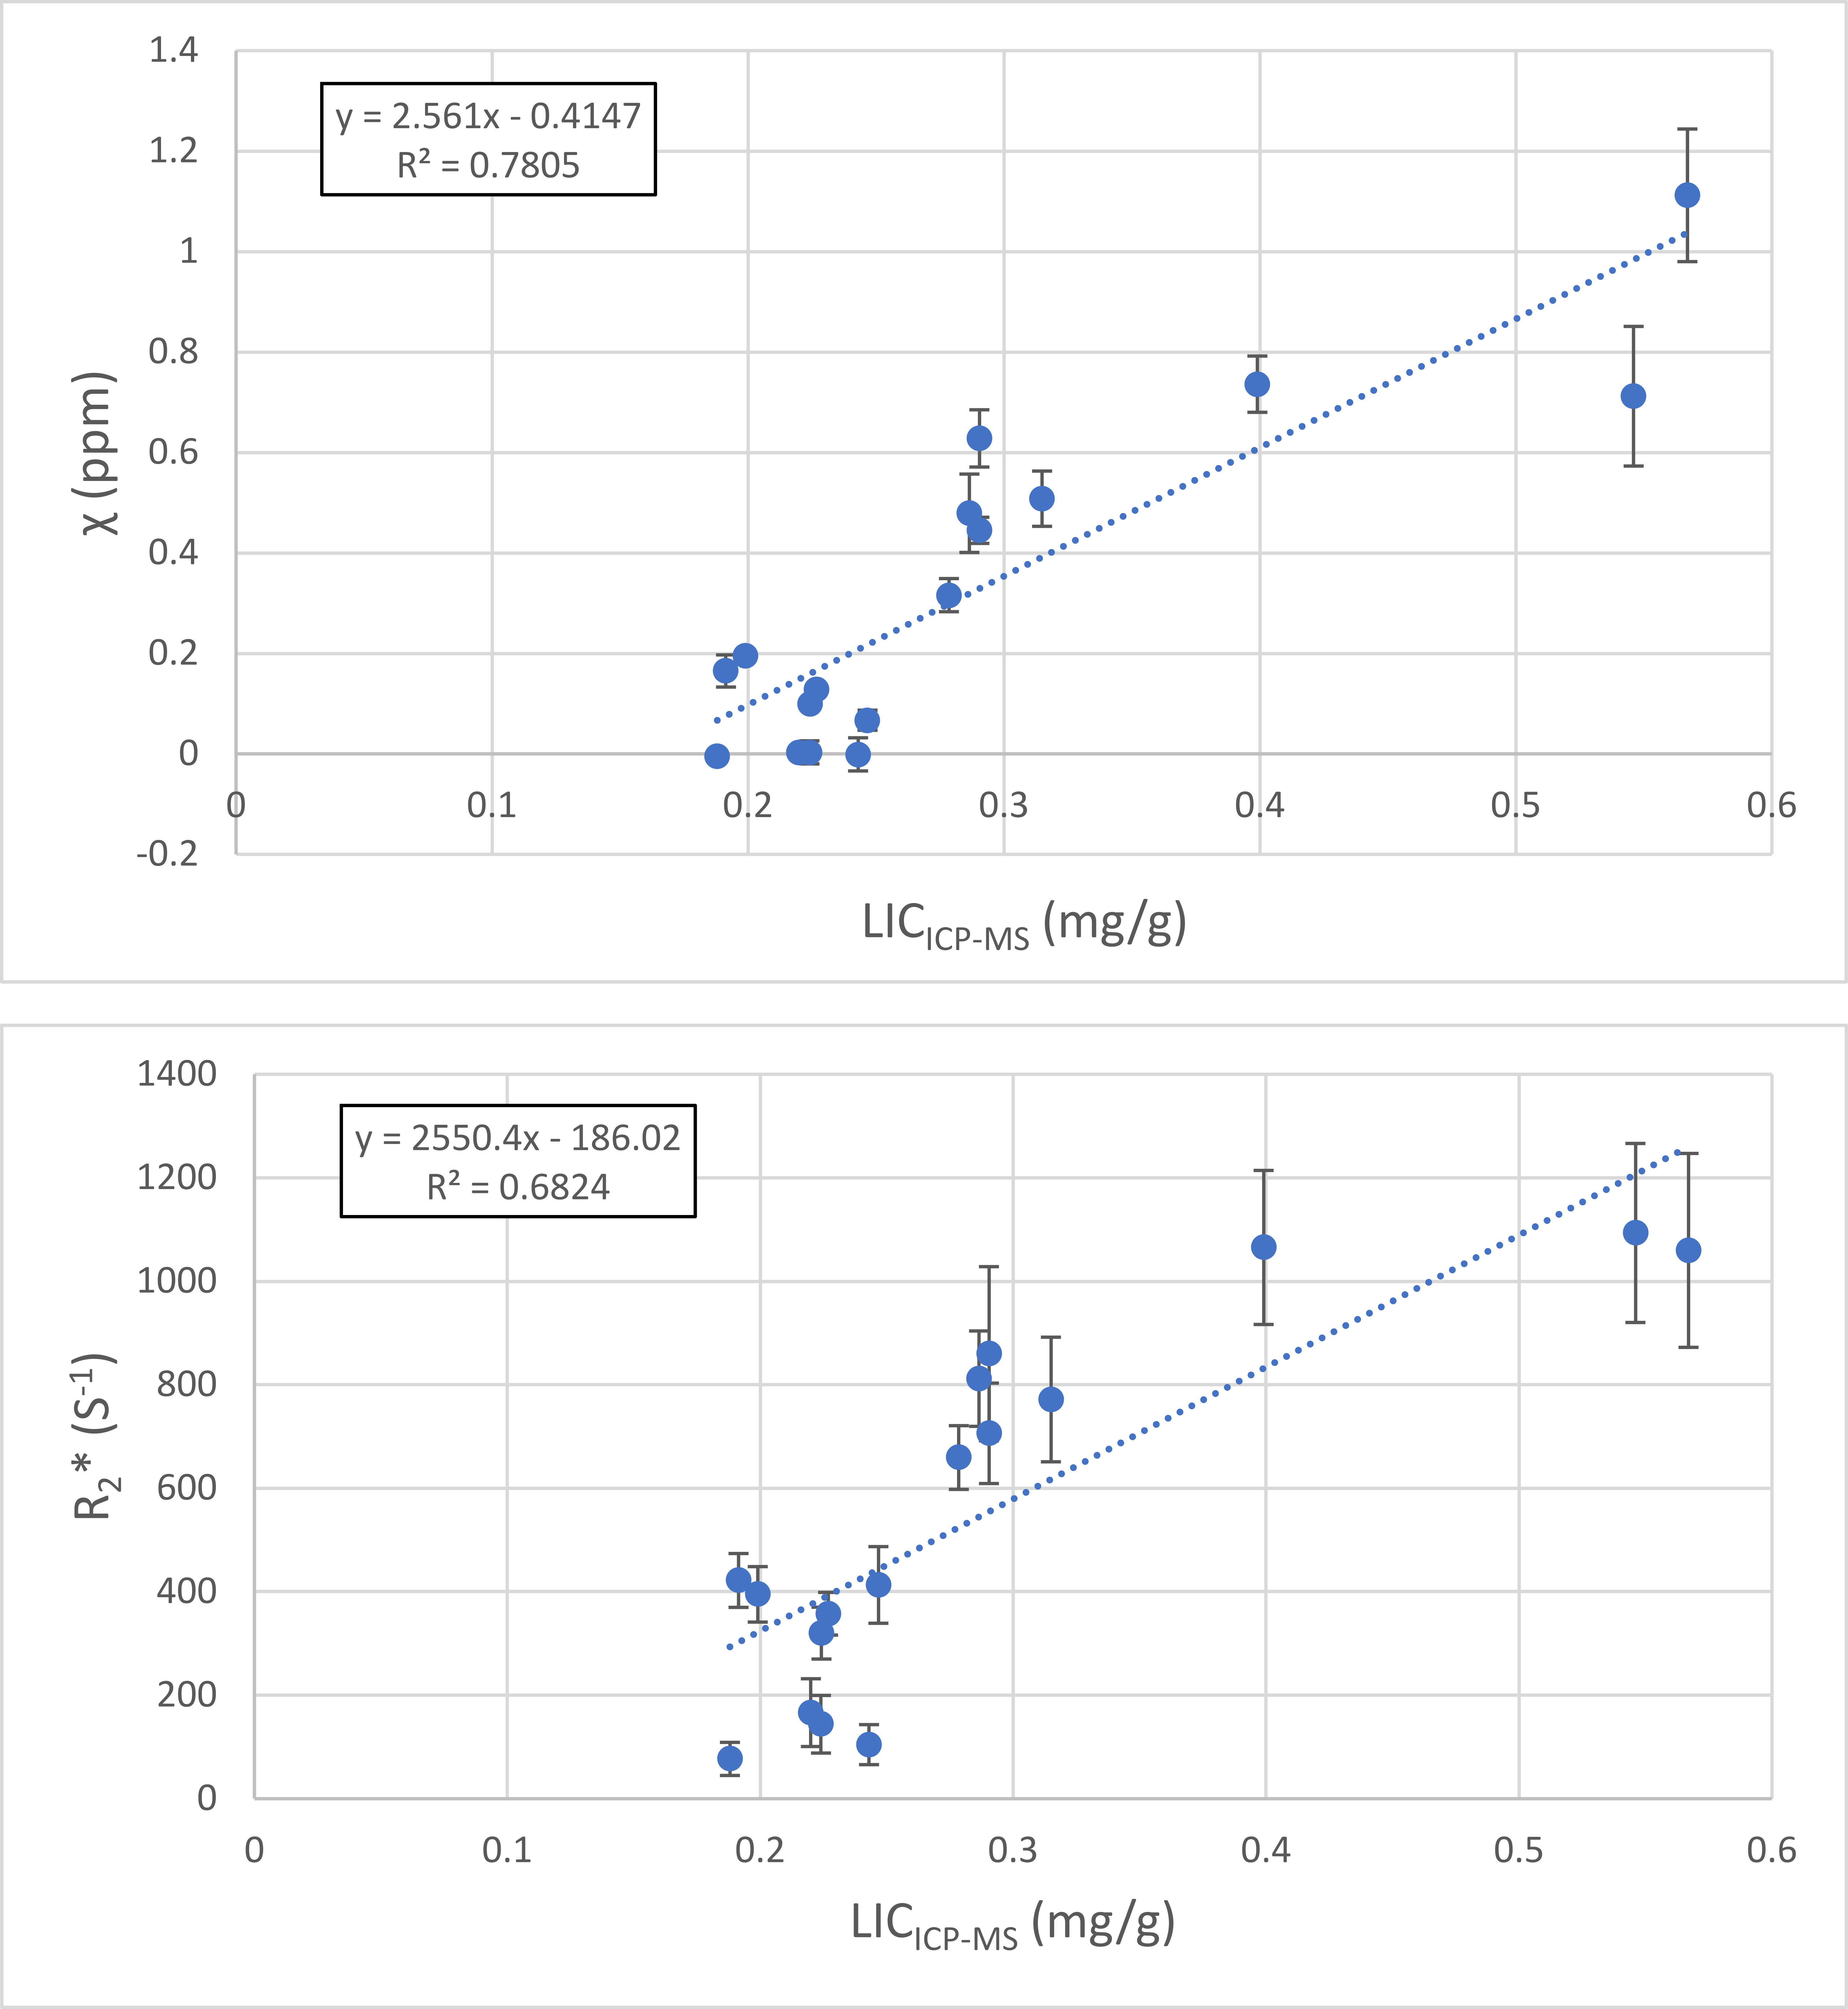
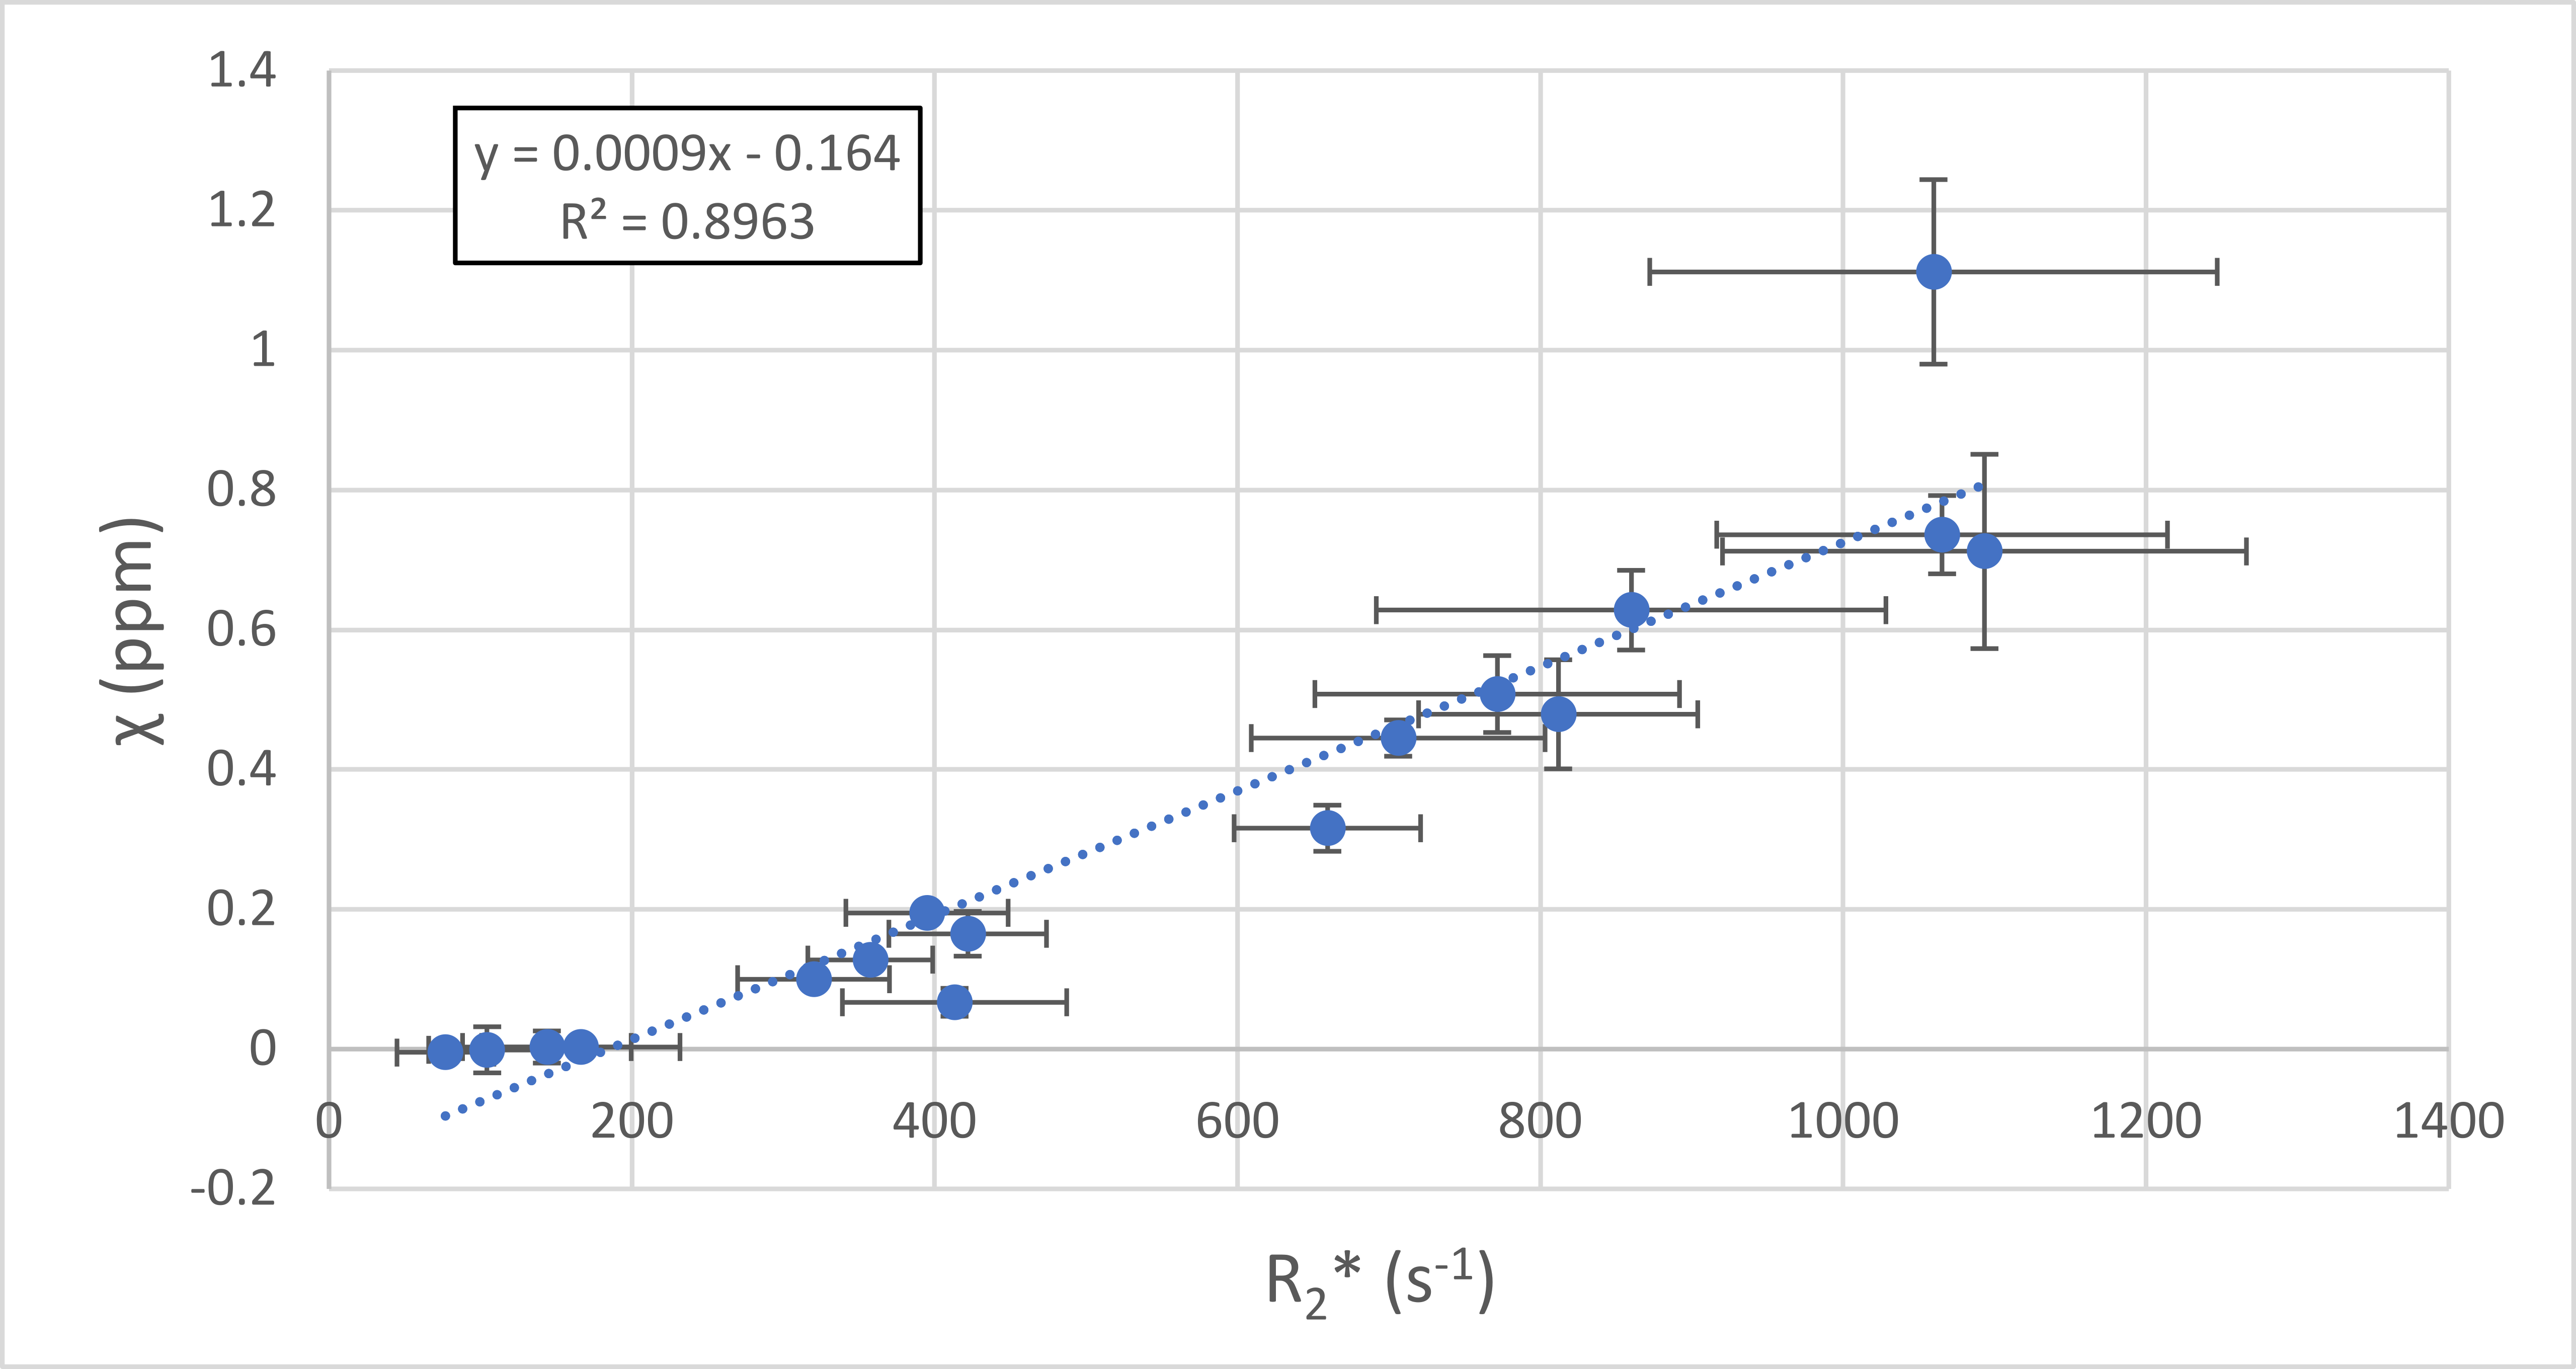
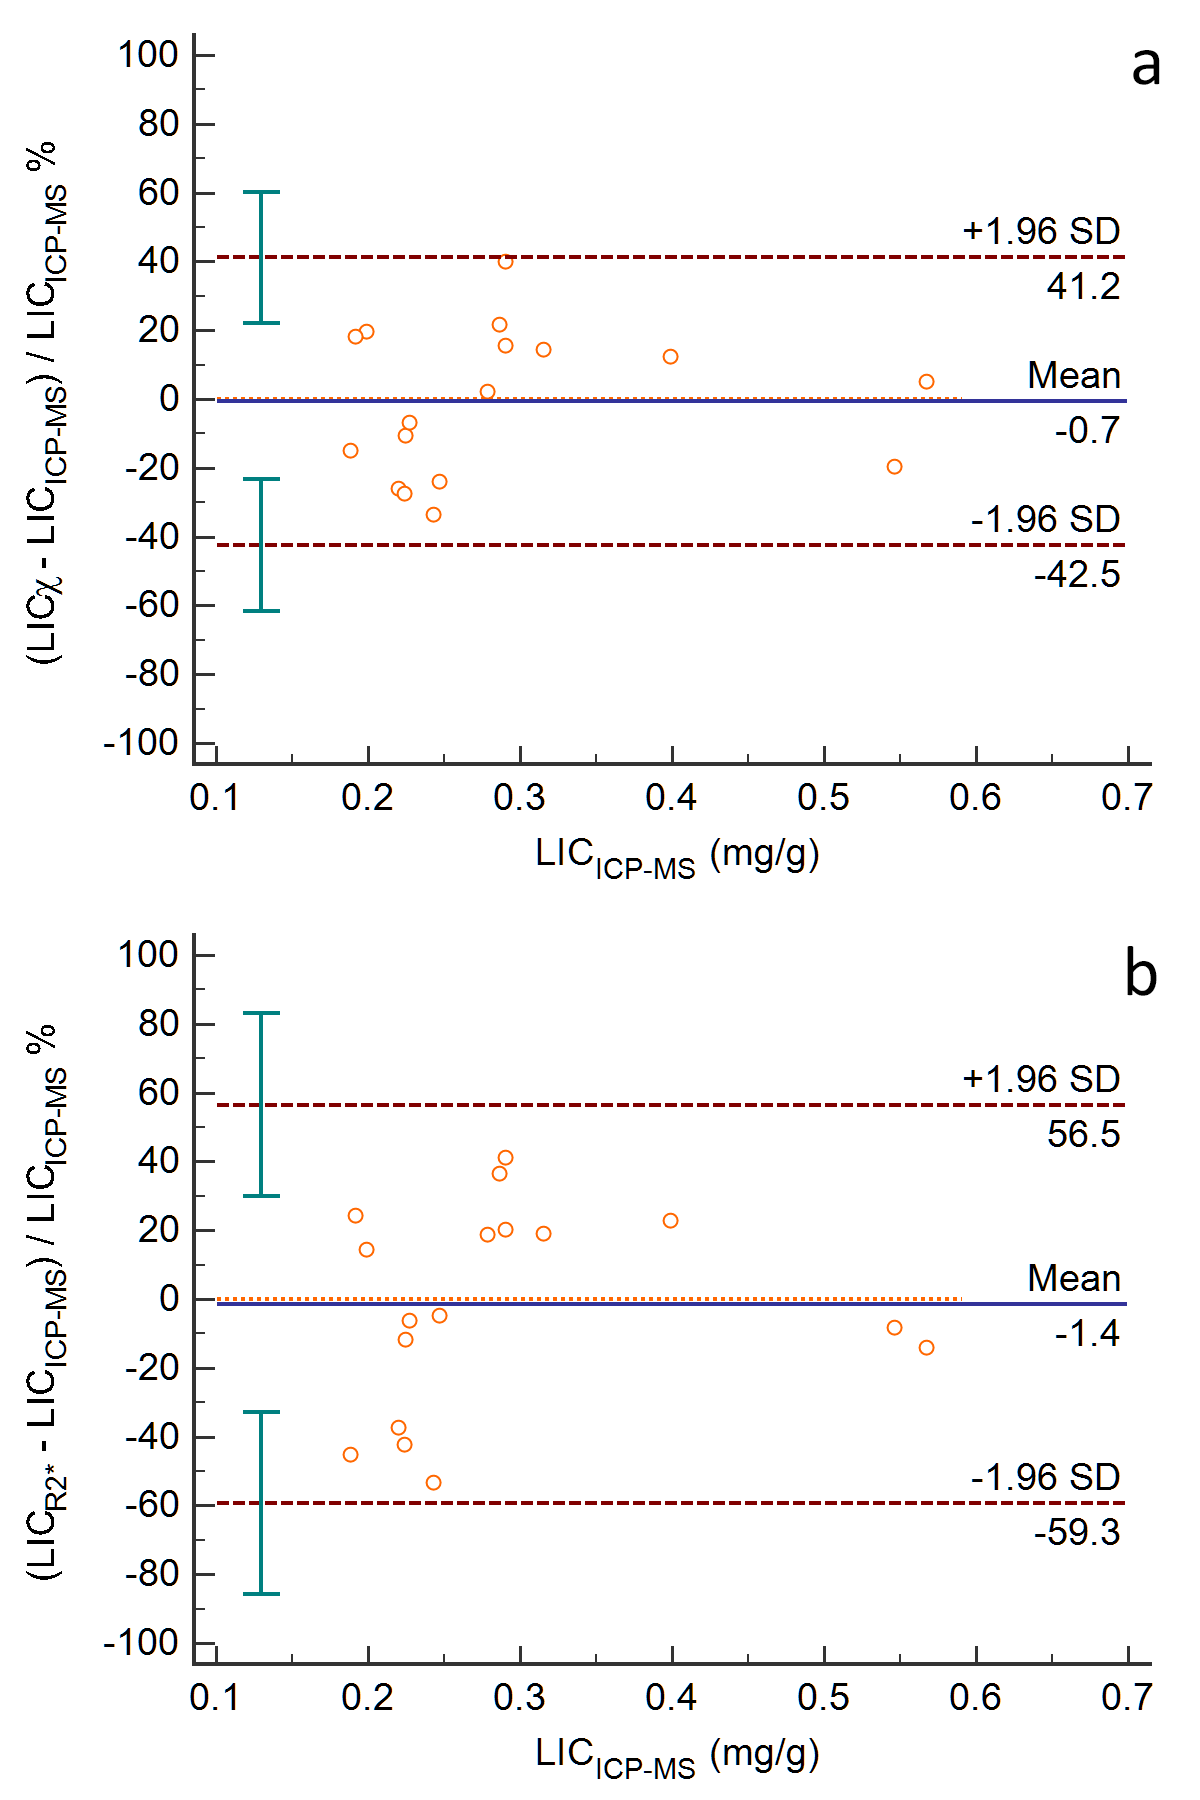
Representative magnitude images, reconstructed R2* and susceptibility maps of each mice group are shown in Fig. 1, as well as the region of interest (ROI) used to calculate average values and standard deviations. Liver iron content calculated with ICP-MS correlates well with injected USPIO concentration (R2 = 0.807, Fig. 2). We fitted both the magnetic susceptibility (χ) and R2* to the ICP-MS (Fig. 3), and obtained a better correlation (more linear relationship) between χ and ICP-MS (R2 = 0.78) than between R2* and ICP-MS (R2 = 0.68). χ). R2* values were converted to iron content values and compared against ICP-MS iron content in a Bland-Altman analysis (Fig. 5), giving advantage to the susceptibility-based iron quantification (in terms of bias and agreement limits). The correlation between R2* and χ was good (R2 = 0.89, Fig. 4). The average standard deviation of susceptibility in the liver ROI across all mice was 0.016, more than two times smaller than that of R2* (0.035).Discussion
In our in vivo study, we found that QSM had a more linear relationship with ICP-MS iron content and better precision than R2* relaxometry. Similar results were previously reported in an ex vivo study (4). We obtained smaller correlation coefficients (R2 = 0.78 for χ vs. ICP-MS and R2 = 0.68 for R2* vs. ICP-MS) than in the ex vivo study (R2 = 0.91 and 0.78, respectively). However, QSM still had more linear relationship with ICP-MS in this in vivo study, narrower agreement limits on Bland-Altman plot and an average standard deviation that is more than 2 times smaller compared with R2* relaxometry. This difference may be related to the more inhomogeneous spatial distribution of R2* in the liver, as observed in Fig. 1.Therefore, despite respiratory motion that may generate reconstruction artefacts, QSM has the potential for in vivo liver iron quantification in a preclinical setting, as a method that appears more robust than R2* relaxometry. Additional advantages of QSM relative to R2* relaxometry are its insensitivity to the spatial distribution of iron and to pure R2 effects related to cellular pathology (6–8).Conclusion
The goal of our work was to demonstrate the utility of QSM in small animal studies. We show that liver QSM is feasible in mice despite respiratory motion and that QSM is more robust than R2* for liver iron quantification in this in vivo study.Acknowledgements
This work was partly funded by France Life Imaging (grant ANR-11-INBS-0006) and by Bpifrance (grant PSPC HECAM).References
1. Wang Y, Spincemaille P, Liu Z, et al. Clinical quantitative susceptibility mapping (QSM): Biometal imaging and its emerging roles in patient care. Journal of Magnetic Resonance Imaging 2017;46:951–971 doi: 10.1002/jmri.25693.
2. Sharma SD, Hernando D, Horng DE, Reeder SB. Quantitative susceptibility mapping in the abdomen as an imaging biomarker of hepatic iron overload. Magnetic Resonance in Medicine 2015;74:673–683 doi: 10.1002/mrm.25448.
3. Jafari R, Sheth S, Spincemaille P, et al. Rapid automated liver quantitative susceptibility mapping. Journal of Magnetic Resonance Imaging 2019;50:725–732 doi: 10.1002/jmri.26632.
4. Simchick G, Liu Z, Nagy T, Xiong M, Zhao Q. Assessment of MR-based and quantitative susceptibility mapping for the quantification of liver iron concentration in a mouse model at 7T. Magnetic Resonance in Medicine 2018;80:2081–2093 doi: 10.1002/mrm.27173.
5. Bilgic B, Fan AP, Polimeni JR, et al. Fast quantitative susceptibility mapping with L1-regularization and automatic parameter selection. Magnetic Resonance in Medicine 2014;72:1444–1459 doi: 10.1002/mrm.25029.
6. Colgan TJ, Knobloch G, Reeder SB, Hernando D. Sensitivity of quantitative relaxometry and susceptibility mapping to microscopic iron distribution. Magnetic Resonance in Medicine 2020;83:673–680 doi: 10.1002/mrm.27946.
7. Li J, Lin H, Liu T, et al. Quantitative susceptibility mapping (QSM) minimizes interference from cellular pathology in R2* estimation of liver iron concentration. Journal of Magnetic Resonance Imaging 2018;48:1069–1079 doi: 10.1002/jmri.26019.
8. Girard OM, Ramirez R, McCarty S, Mattrey RF. Toward absolute quantification of iron oxide nanoparticles as well as cell internalized fraction using multiparametric MRI. Contrast Media & Molecular Imaging 2012;7:411–417 doi: 10.1002/cmmi.1467.
Figures