3217
Comparison of Background Field Removal Strategies in Joint Quantitative Susceptibility Mapping in Abdomen1Medical Physics, University of Wisconsin, Madison, WI, United States, 2Radiology, University of Wisconsin - Madison, Madison, WI, United States, 3Biomedical Engineering, University of Wisconsin - Madison, Madison, WI, United States, 4Radiology, University of Wisconsin, Madison, WI, United States, 5Sun Yat-sen University, Guangzhou, China, 6Medicine, University of Wisconsin - Madison, Madison, WI, United States, 7Emergency Medicine, University of Wisconsin - Madison, Madison, WI, United States
Synopsis
Quantitative susceptibility mapping (QSM) is a promising technique for direct measure of iron concentration in vivo. In abdominal imaging, QSM faces challenges of strong background field, presence of fat, complex anatomy, low image resolution, and rapid signal decay with high iron concentration. Many methods for background field removal utilize spherical mean value property of harmonic functions, resulting in straightforward approach with known limitations in accuracy and edge preservation. Here, we propose an alternative background field removal method based on direct implementation of the Laplace operator and compare its performance with spherical mean value kernels within the joint QSM estimation framework.
Introduction
Quantitative susceptibility mapping (QSM) may provide a direct measure of iron concentration in-vivo1. QSM was initially implemented as a sequential technique processing the $$$B_0$$$ field map to estimate local susceptibility values, with two steps: 1) background field removal and 2) dipole kernel deconvolution. Later, joint methods merged both steps into a single procedure, which permitted obtaining QSM directly from the $$$B_0$$$ field map2 or image phase3. Importantly, joint QSM approaches can readily accommodate a range of image-based and physiological constraints for improved performance. Further, joint estimation-based QSM demonstrated promise in the abdomen2, where it is challenging to implement standard QSM due to large background field, especially in high iron overload cases. Current methods for background field removal rely (directly4 or indirectly5) on the fact that the background field is described by a harmonic function, i.e., is annihilated by the Laplacian operator or, equivalently, satisfies the spherical mean value (SMV) property. Early QSM methods utilized the SMV property for background field removal due to the simplicity of implementation and computational efficiency despite its known limitations in accuracy and edge preservation6. As most joint methods naturally evolved from sequential QSM, they incorporated SMV-based background field removal as well. In this work, we evaluate the performance of SMV-based joint QSM for liver imaging including cases with high iron overload, and propose an alternative background field removal method based on the direct implementation of the Laplace operator within the joint framework.Theory
We base our evaluation on the joint QSM reconstruction proposed in7:$$\min_{\chi_L}\|WR(\psi-D\chi_L)\|_2^2+\lambda\|P\chi_L\|_2^2.$$Here, $$$\chi_L$$$ is local susceptibility, $$$D$$$ dipole kernel, $$$\psi$$$ measured $$$B_0$$$ field, $$$R$$$ background field removal operator, $$$W$$$ noise variance weighting. Parameter $$$\lambda$$$ weights the regularization term containing penalty weights $$$P$$$ for edge/fat constraints. Theoretically, choosing $$$R$$$ to be either the Laplace operator$$R_L\psi=\frac{\partial^2\psi}{\partial x^2}+\frac{\partial^2\psi}{\partial z^2}+\frac{\partial^2\psi}{\partial z^2}$$or SMV operator$$R_{SMV,r}\psi=\frac{1}{|S_r|}\int_{S_r} \psi({\bf r})d{\bf r} -\psi$$yields equivalent results for any harmonic function $$$\psi$$$ and sphere $$$S_r$$$ of radius $$$r$$$ contained within the region of interest (ROI), in which susceptibility distribution is to be determined. However, $$$R_{SMV,r}$$$ cannot be computed within $$$r$$$ voxels of ROI boundary, prompting the choice of smallest possible $$$r$$$, which in practice is confined to larger values for better SMV approximation and field removal ($$$r=5-7\,$$$voxels)8. In contrast, discretization of $$$R_L$$$ uses minimal possible kernel size, potentially minimizing ROI degradation.Methods
A realistic numerical abdominal phantom9 with moderately high level of liver iron concentration ($$$R_2^*=200\,s^{-1},\chi=1\,\rm{ppm}$$$ relative to fat) was used to simulate 3D multi-echo GRE images ($$$1.5\times1.5\times1.8\,\rm{mm}^3,\rm{SNR}=20$$$). Joint QSM was performed with $$$R_L$$$ and $$$R_{SMV,r}, r=2,4,6,8$$$. QSM was measured in right and left liver lobes relative to fat susceptibility (assumed to be zero) and compared to ground truth. In-vivo data were collected on 3T clinical scanner (Discovery MR750, GE Healthcare, Waukesha, WI USA) in patients scanned for suspected focal liver lesion (voxel size $$$1.6\times1.6\times8\,\rm{mm}^3,\rm{FOV}=40\times36\,\rm{cm}^2,\rm{TR}=4.6\,\rm{ms},6\rm{TEs},\Delta\rm{TE}=0.6\,\rm{ms}$$$) and processed using both $$$R_L$$$ and $$$R_{SMV,r}$$$.Results
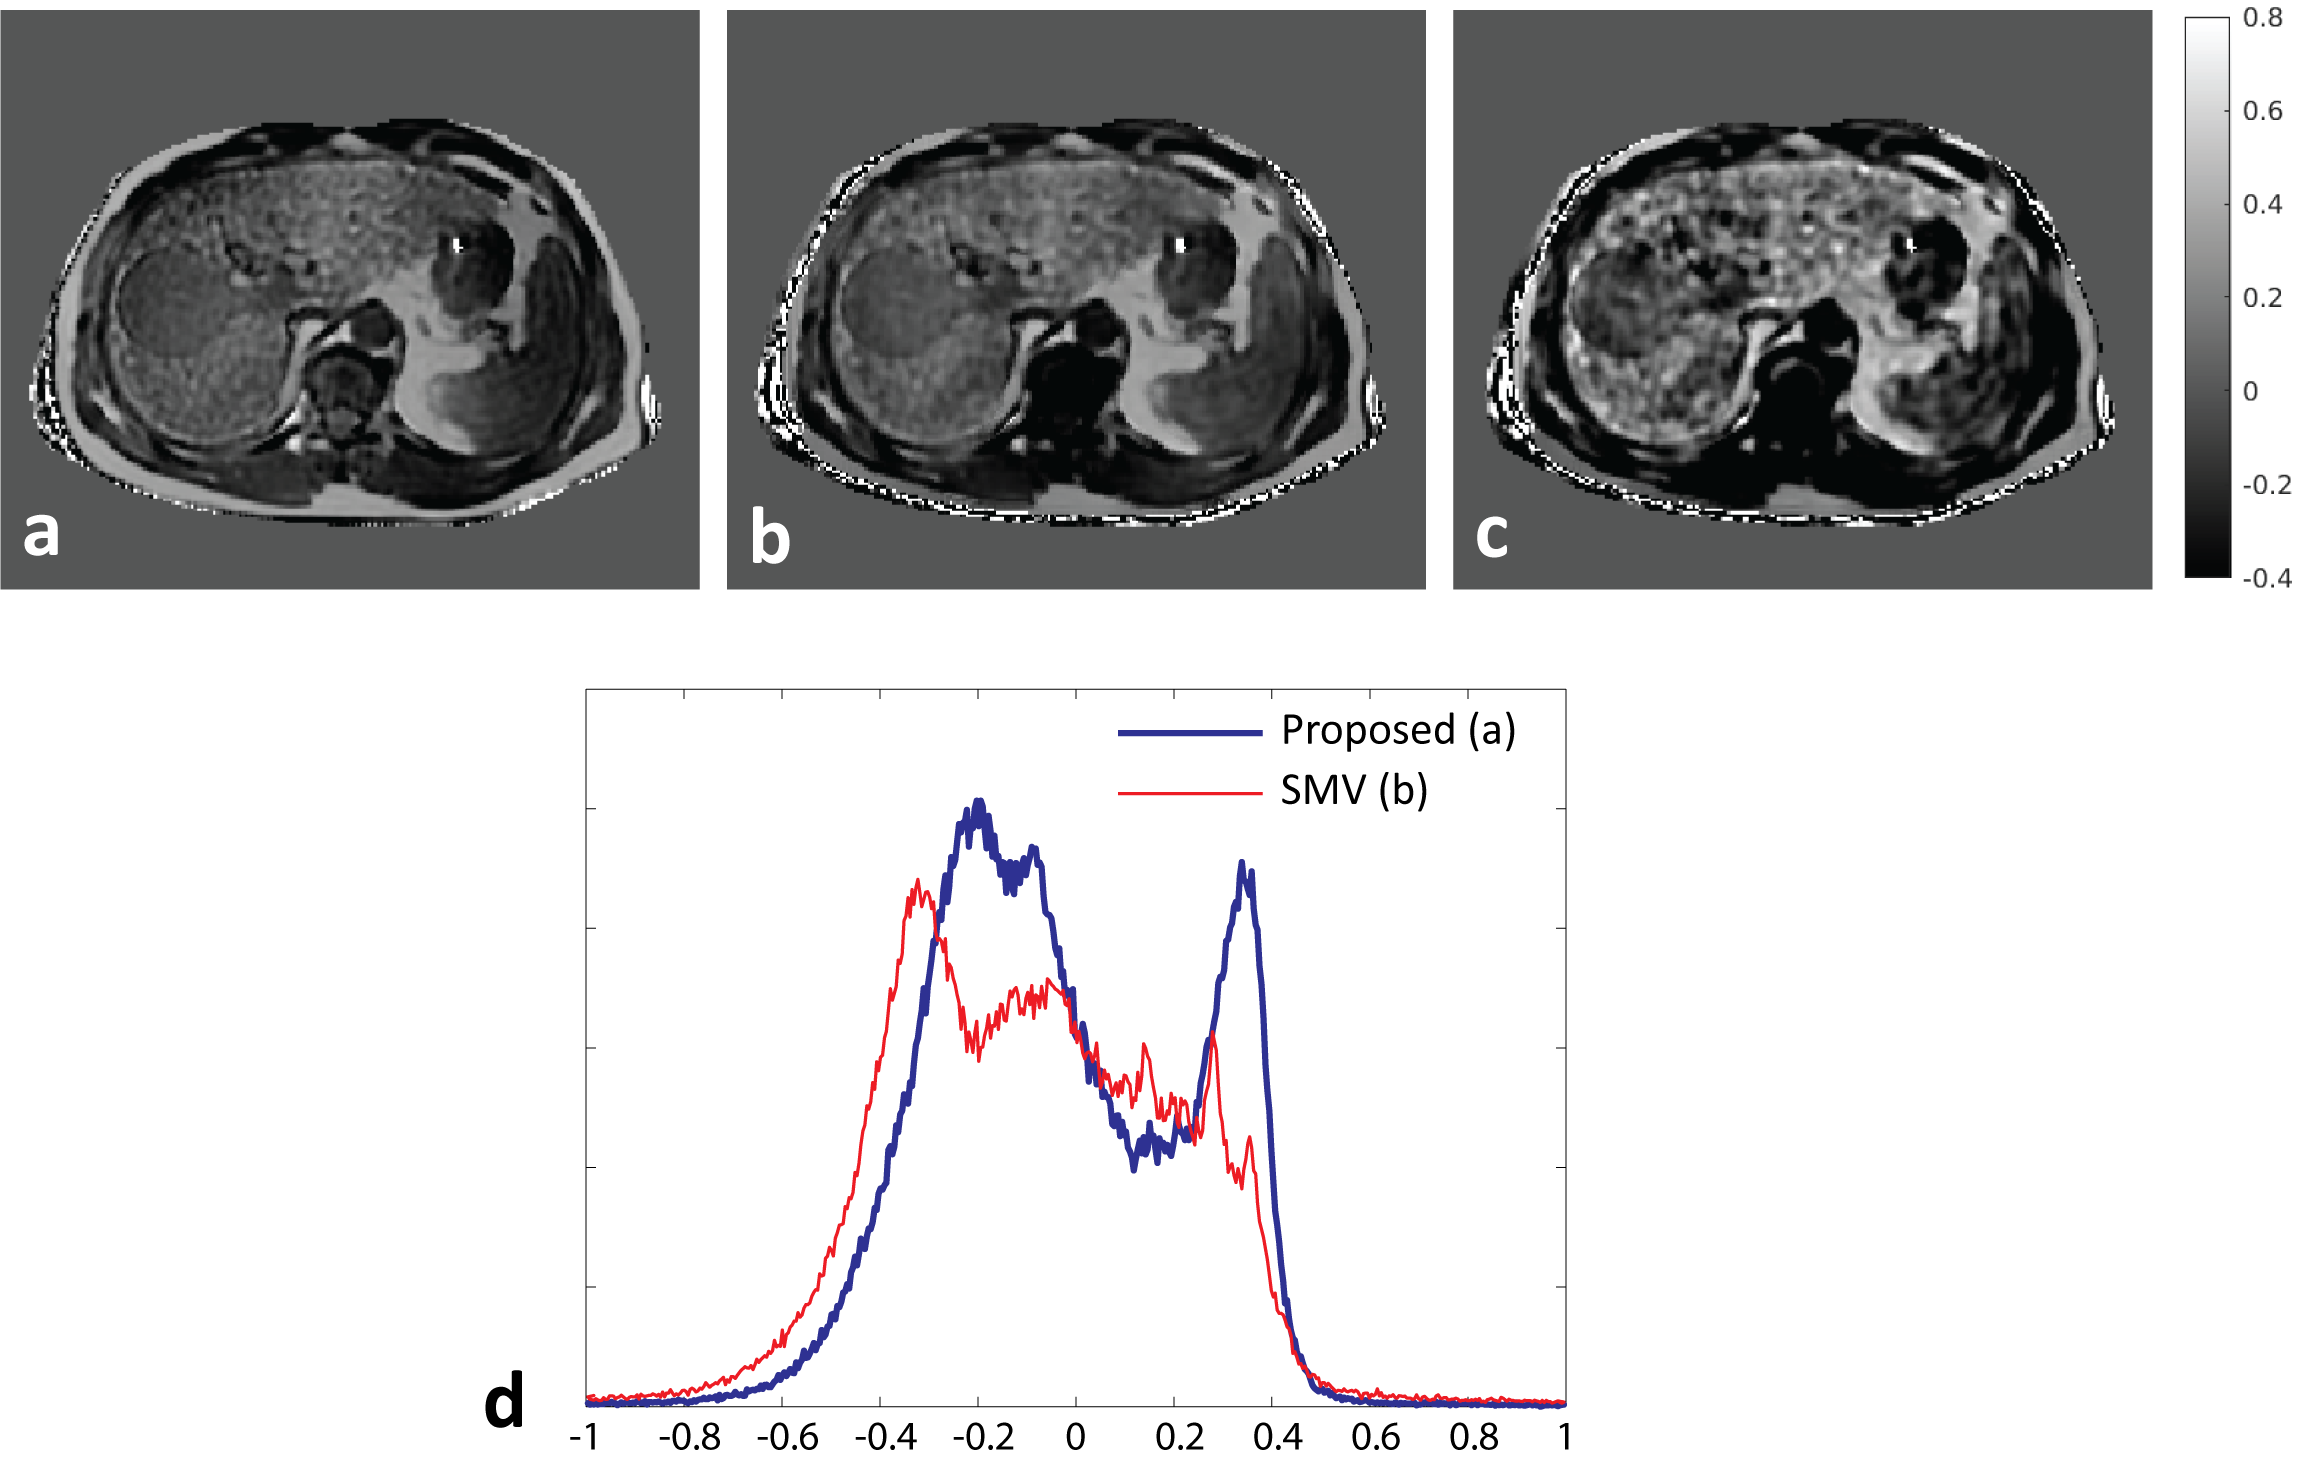
Figure 1a shows representative QSM maps obtained in numerical simulations. QSM estimations with $$$R_{SMV,r}$$$ suffer from spatial inhomogeneity (shading artifact10) likely from propagating errors of background field removal at tissue boundaries, while the map for $$$R_L$$$ is consistent with the ground truth. Liver-specific quantitative measurements (Table 1) further support these observations and suggest that $$$r=6$$$ provides optimal performance among all tested SMV radii. Image profile plots (Fig. 1b) demonstrate errors for $$$R_{SMV,6}$$$ in liver, existing even away from ROI boundaries. Figure 2 shows QSM maps from in-vivo case with moderately elevated liver iron ($$$R_2^*=233\,\rm{s}^{-1}$$$) reconstructed with parameters optimized in phantom simulations. Note that the SMV case appears visually blurred compared to the Laplacian. To verify whether the blurring was caused by averaging effect of SMV kernel or by excessive regularization, we repeated the reconstruction with reduced regularization parameters that produced significant artifacts (Fig. 2c) confirming the former. More blurred histogram for $$$R_{SMV,6}\,$$$(Fig. 2d) is indicative of higher shading artifact in the corresponding susceptibility map. Figure 3 compares QSM maps for an in-vivo case with higher liver iron concentration ($$$R_2^*\approx400\,\rm{s}^{-1}$$$) reconstructed with $$$R_L$$$ and $$$R_{SMV,6}$$$. Note detrimental effect of SMV kernel on susceptibility maps.Discussion and Conclusions
SMV-based background field removal is known to introduce significant errors in areas of rapid susceptibility change, with the spatial extent of the errors determined by the SMV kernel size, which, however, cannot be minimized by using very small kernels due to less accurate SMV approximation and field removal. It was shown8 for brain imaging that using Laplacian kernel in multi-step QSM reduces the margin of unreliable data to 1-2 voxels but increases overall error. Our results indicate that the tradeoffs of the kernel selection are different for the joint QSM framework, which benefits significantly from the Laplacian kernel. This effect may be particularly pronounced in abdominal imaging, where QSM faces challenges of strong background field, presence of fat, complex anatomy, low image resolution9, and rapid signal decay for iron overload. The observed sensitivity to SMV-induced errors may stem from the fact that joint methods solve a global optimization problem. This may cause local errors become dispersed and amplified in other locations, especially in a view of overall ill-posedness of dipole kernel deconvolution in QSM. We conclude that the proposed Laplacian-based joint estimation is a promising approach for accurate QSM in the abdomen.Acknowledgements
The authors wish to acknowledge support from the NIH (R01-DK117354, R01-DK083380, R01-DK088925, R01-DK100651, K24-DK102595, R01-EB027087), as well as research support from GE Healthcare.References
1. Ropele S, Langkammer C. Iron quantification with susceptibility. NMR Biomed 2017;30(4).
2. Sharma SD, Hernando D, Horng DE, Reeder SB. Quantitative susceptibility mapping in the abdomen as an imaging biomarker of hepatic iron overload. Magn Reson Med 2015;74(3):673-683.
3. Chatnuntawech I, McDaniel P, Cauley SF, Gagoski BA, Langkammer C, Martin A, Grant PE, Wald LL, Setsompop K, Adalsteinsson E, Bilgic B. Single-step quantitative susceptibility mapping with variational penalties. NMR Biomed 2017;30(4).
4. Schweser F, Deistung A, Lehr BW, Reichenbach JR. Quantitative imaging of intrinsic magnetic tissue properties using MRI signal phase: an approach to in vivo brain iron metabolism? Neuroimage 2011;54(4):2789-2807.
5. Liu T, Khalidov I, de Rochefort L, Spincemaille P, Liu J, Tsiouris AJ, Wang Y. A novel background field removal method for MRI using projection onto dipole fields (PDF). NMR Biomed 2011;24(9):1129-1136.
6. Wen Y, Zhou D, Liu T, Spincemaille P, Wang Y. An iterative spherical mean value method for background field removal in MRI. Magn Reson Med 2014;72(4):1065-1071.
7. Sharma SD, Fischer R, Schoennagel BP, Nielsen P, Kooijman H, Yamamura J, Adam G, Bannas P, Hernando D, Reeder SB. MRI-based quantitative susceptibility mapping (QSM) and R2* mapping of liver iron overload: Comparison with SQUID-based biomagnetic liver susceptometry. Magn Reson Med 2017;78(1):264-270.
8. Schweser F, Sommer K, Atterbury M, Deistung A, Lehr J, Reichenbach J. On the impact of regularization and kernel type on SHARP-corrected GRE phase images. In: Proc of ISMRM; 2011; Montreal, Canada. p 2667.
9. Zhu A, Colgan T, Reeder S, Hernando D. Characterization of Bias in Quantitative Susceptibility Mapping with Anisotropic Imaging Resolution: Studies in a Numerical Phantom, 3D Printed Liver Phantom, and In Vivo Patient Scans. In: Proc of ISMRM; 2019; Montreal, Canada. p 5189.
10. Kee Y, Liu Z, Zhou L, Dimov A, Cho J, de Rochefort L, Seo JK, Wang Y. Quantitative Susceptibility Mapping (QSM) Algorithms: Mathematical Rationale and Computational Implementations. IEEE Trans Biomed Eng 2017;64(11):2531-2545.
Figures