3216
The effect of voxel size on magnetic susceptibility and R2* of intramyocardial hemorrhage at 3 and 7 T1Bioengineering, University of Pennsylvania, Philadelphia, PA, United States, 2Radiology, Perelman School of Medicine, University of Pennsylvania, Philadelphia, PA, United States, 3Surgery, Perelman School of Medicine, University of Pennsylvania, Philadelphia, PA, United States, 4Medicine, Perelman School of Medicine, University of Pennsylvania, Philadelphia, PA, United States, 5Surgery, Columbia University Irving Medical Center, New York City, NY, United States
Synopsis
Intramyocardial hemorrhage is a complication of reperfused myocardial infarction. Quantitative susceptibility mapping (QSM), R2*-mapping and T2*-weighted images provide quantitative assessment and image contrast based on the presence of iron. We sought to determine the relationship between magnetic susceptibility and R2* with varying voxel size at 3 and 7 T, where tissue magnetic susceptibility showed independence of field strength but dependence on voxel size. At high resolution the detection of heterogeneous infarct magnetic susceptibility improved in a large animal model of myocardial infarction.
Purpose
Intramyocardial hemorrhage is a complication of reperfusion therapy for myocardial infarction (MI) and studies have shown that it is a prognostic for major adverse cardiac outcomes1,2. A paramagnetic shift in tissue magnetic susceptibility was shown to be associated with elevated iron content in intramyocardial hemorrhage3, where magnetic susceptibility was independent of field strength unlike relaxation rate (R2*)4. When comparing magnetic susceptibility at 3 and 7 T, it was important to maintain the same voxel size5 at both field strengths to show independence in field strength. For this study, we sought to determine the relationship between magnetic susceptibility, R2* and voxel size at 3 and 7 T. We hypothesized that a magnetic field gradient across a larger voxel size would increase myocardial infarct R2* and potentially affect magnetic susceptibility and at high resolution there would be improved detection of heterogeneous infarct magnetic susceptibility. To test this hypothesis, we compared quantitative susceptibility mapping (QSM) and R2*-mapping at varying voxel size and field strength in a large animal model of MI.Methods
MI was induced by coronary surgical ligation and released after 90- or 180-min in male Yorkshire swine. Ex vivo 3D multi-echo gradient-echo image acquisition occurred at 3-day (n=1) and 1-week (n=7) post-MI, whole heart specimens were imaged at 7 and 3 T at varying voxel size. 7 T: 0.03 (n=4), 0.13 (n=4), 0.42 (n=4), 0.72 (n=1) mm3 voxel size, TR/TEfirst/TElast/ΔTE=24/2.8/16.5/3.4 msec, FA=28 degrees, BW=725 Hz/pixel, NEX=3. 3 T: 0.42 (n=4), 0.72 (n=8), 1.13 (n=1), 1.72 (n=1) mm3 voxel size, TR/TEfirst/TElast/ΔTE=31-42/2.7-3.3/16.1-16.5/3.2-3.4 msec, FA=16 degrees, BW=610 Hz/pixel, NEX=1 (Siemens Healthcare). R2*-maps were obtained using a 2-parameter fit with least squares minimization. QSM was reconstructed using the MEDI image processing pipeline6. Three volumes-of-interest (VOIs) were obtained from T2*-weighted (T2*w) images using threshold active contour segmentation (ITK-SNAP7) including remote myocardium: isointense (‘iso’), infarct: hyperintense (‘hyper’) and hypointense (‘hypo’). Statistics included linear regressions from VOI measurements and student’s t-test, significance if P<0.05.Results
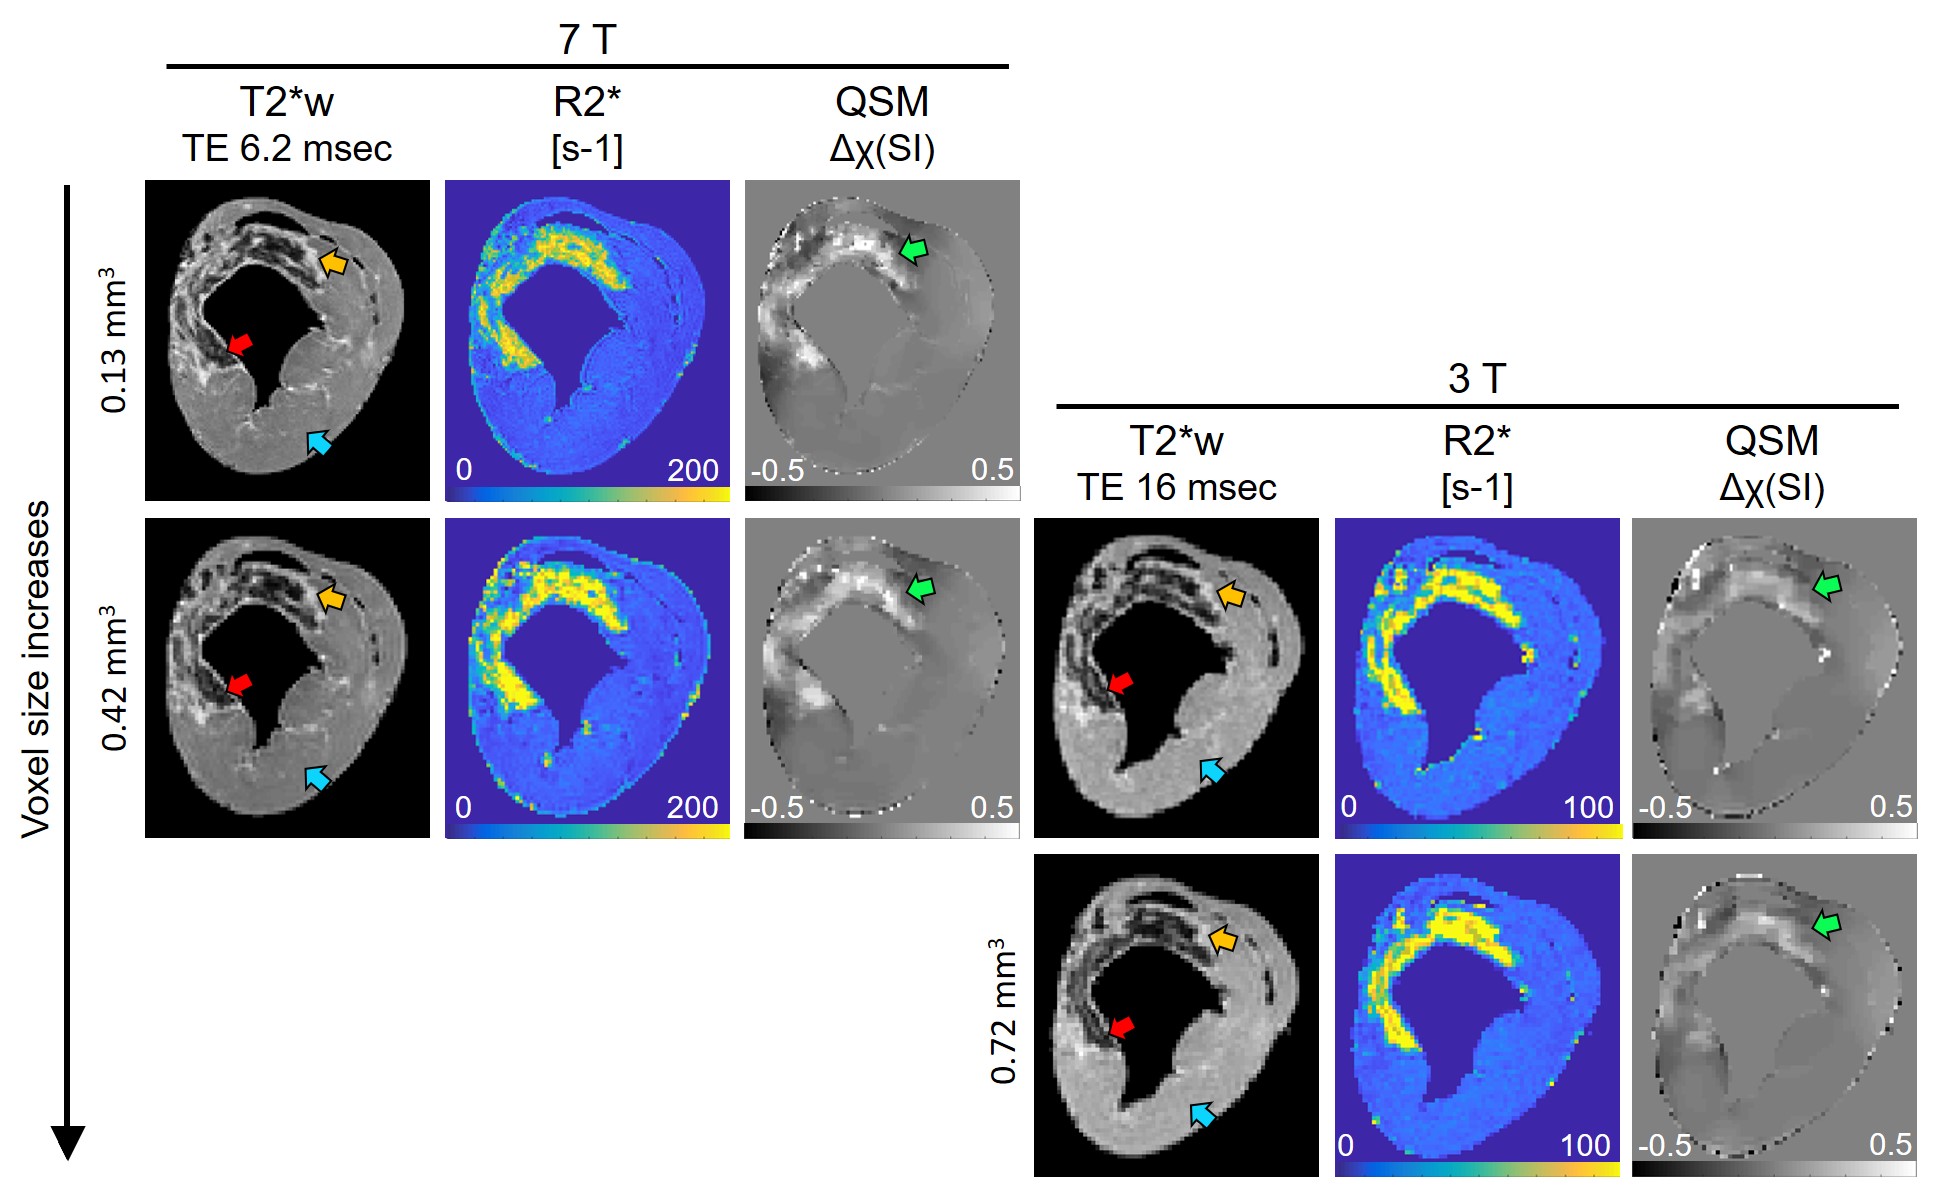
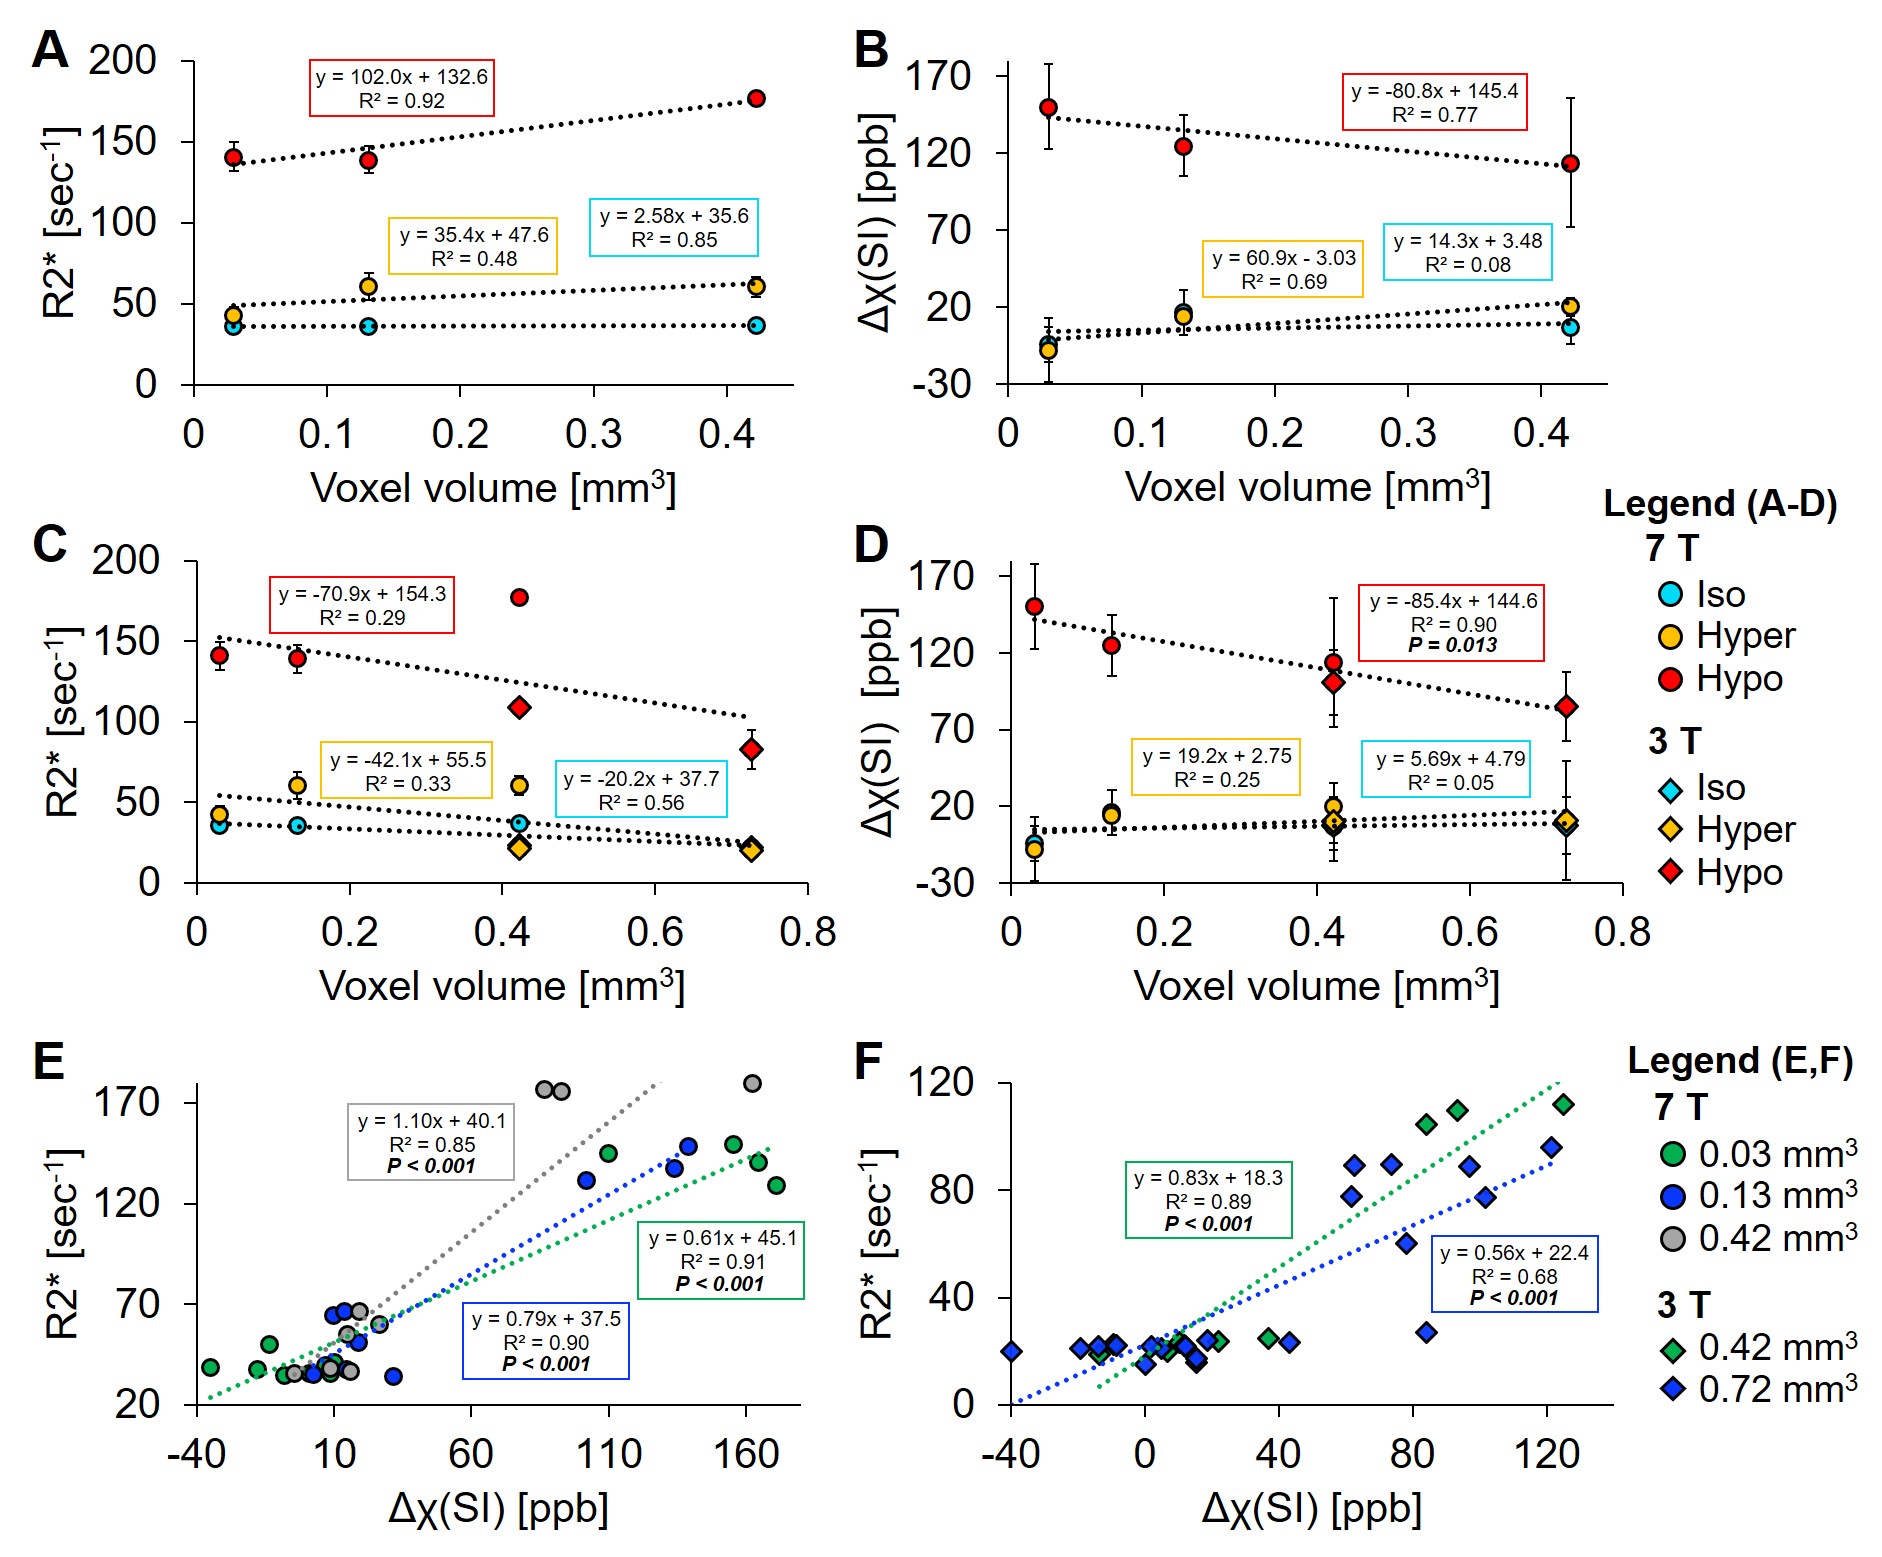
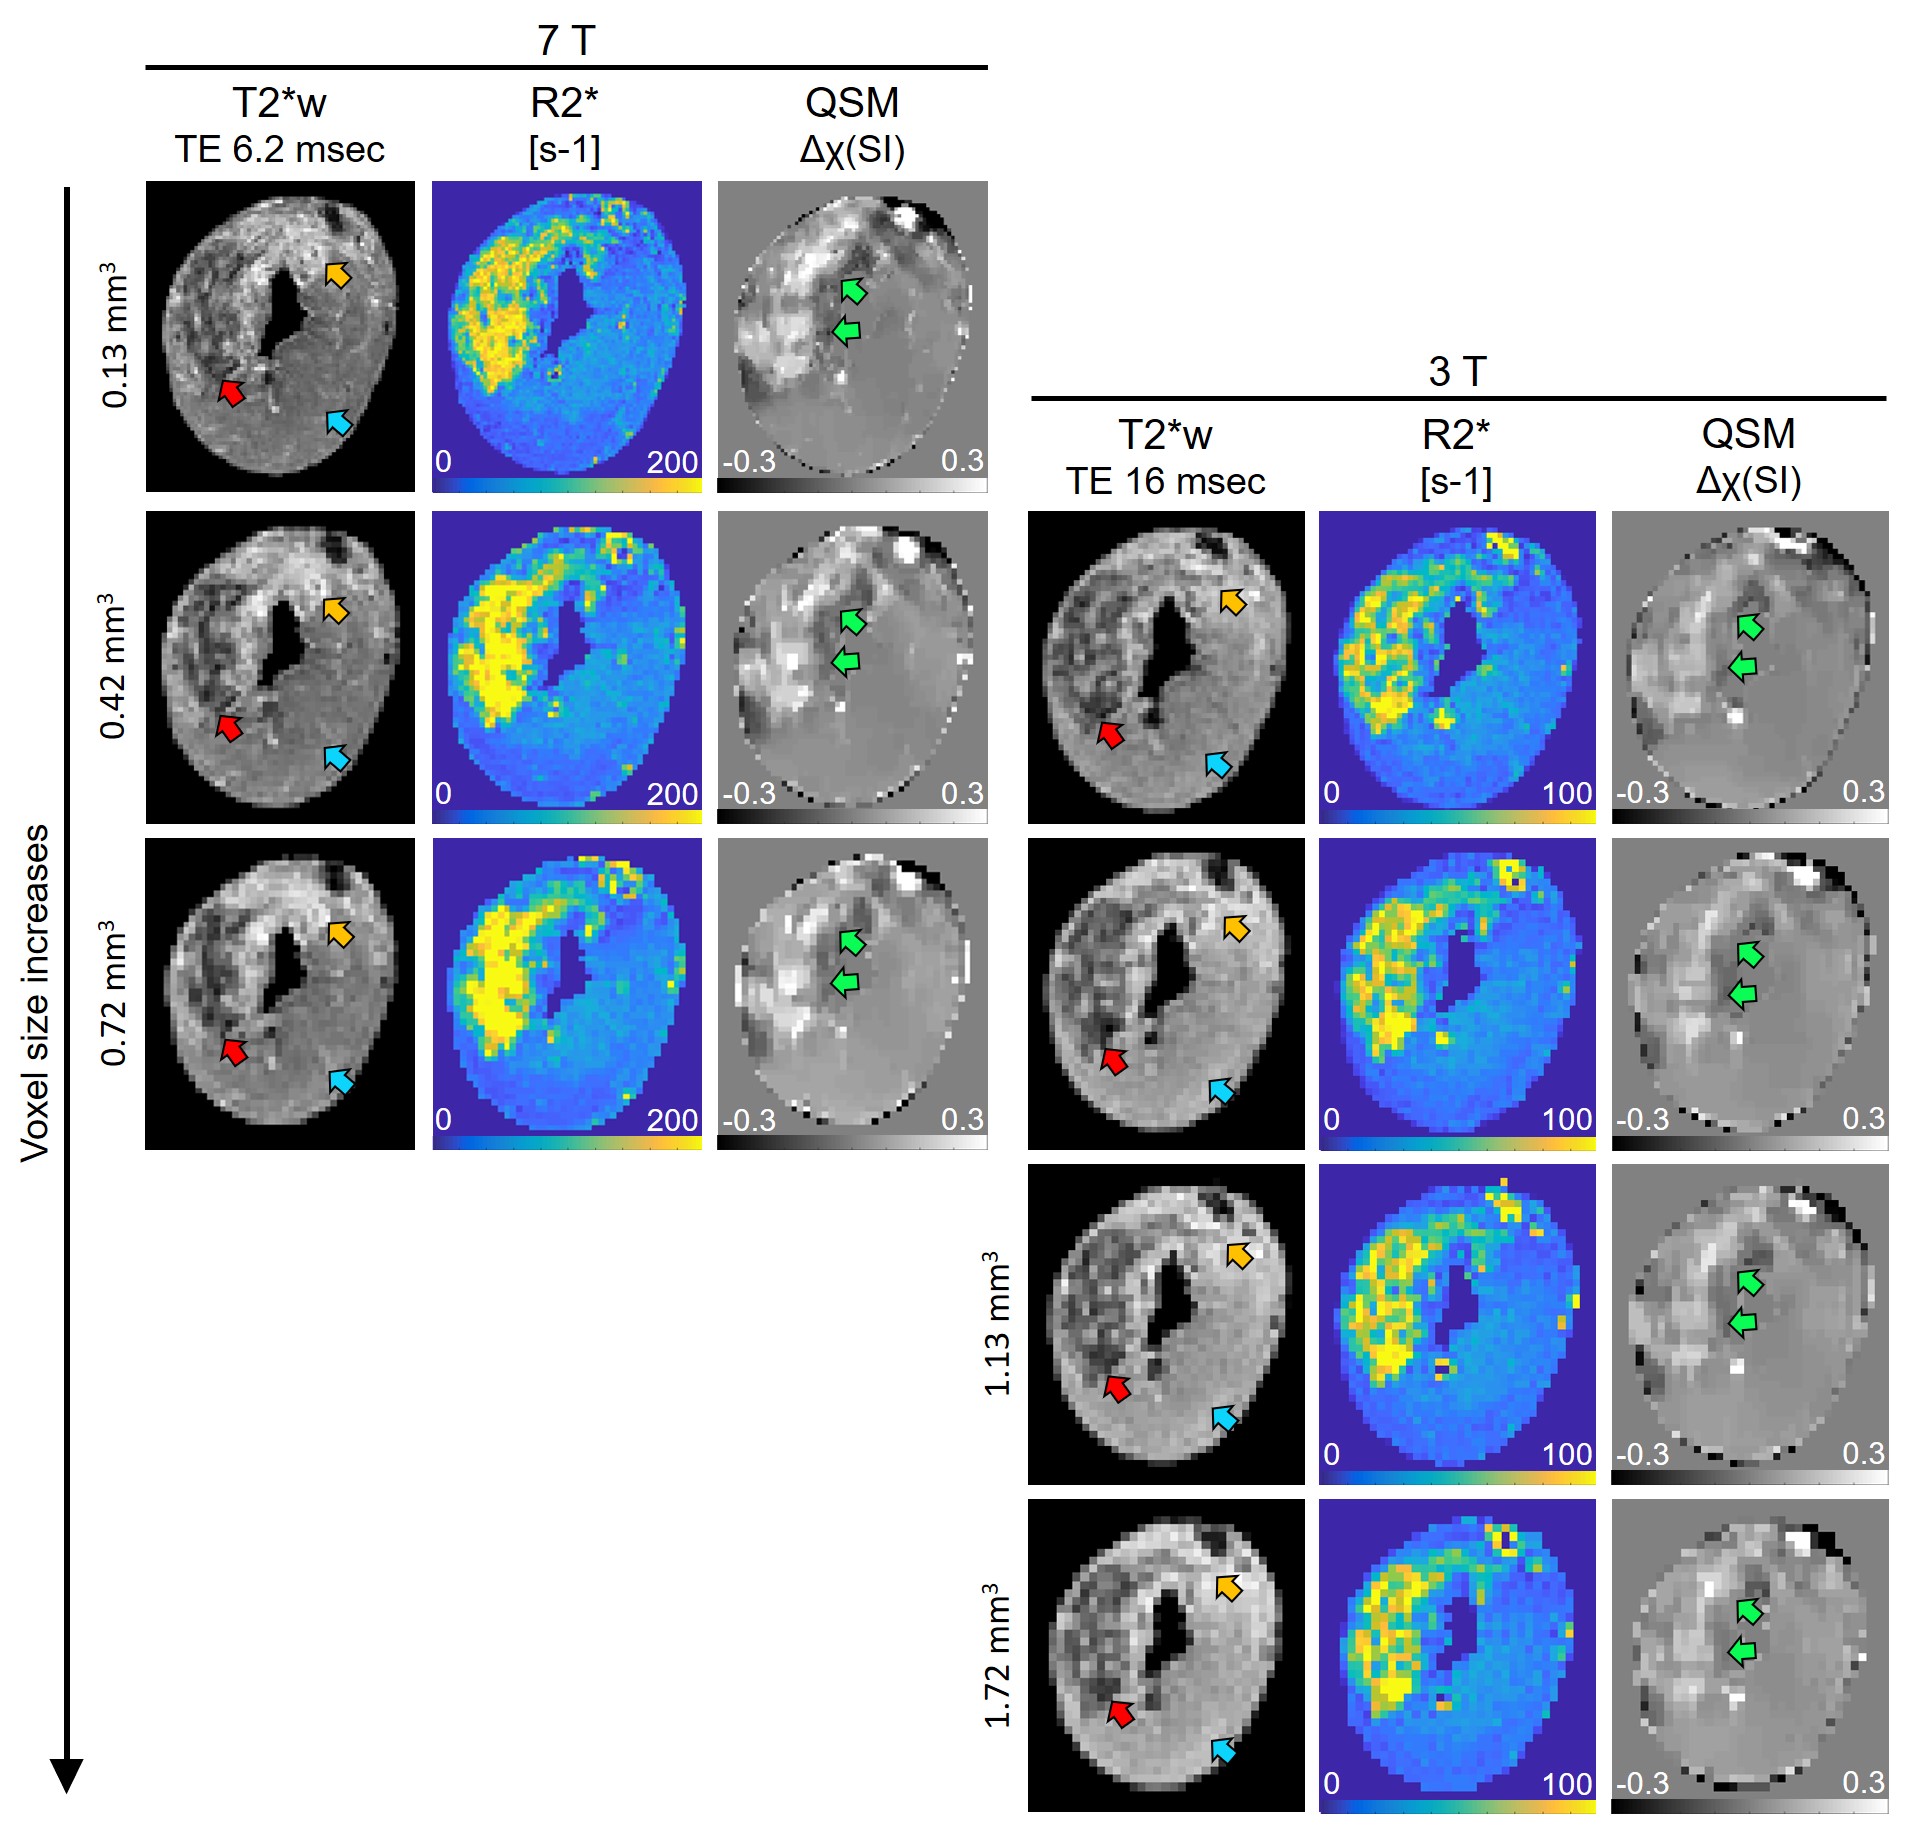
Figure 1 displays the changes in T2*w images, R2*-maps and QSM at 7 and 3 T with varying voxel size. Hypointense regions correspond to an elevation in R2* and tissue magnetic susceptibility. As voxel size increased and field strength decreased, there was a reduction in distinguishing heterogeneous regions of elevated tissue magnetic susceptibility. Figure 2 shows hypointense VOI measurements at 7 T, as voxel size increased there was a linear increase in R2* (slope: 102 sec-1 per mm3, R2=0.92, 2A) and decrease in magnetic susceptibility (slope: -80.8 ppb per mm3, R2=0.77, 2B). Hyperintense and isointense VOI had a non-significant linear regression coefficient for all regressions. After adding 3 T VOI measurements, there was poor linearity between R2* vs. voxel size (R2=0.29, 2C) and a significant linear decrease in magnetic susceptibility vs. voxel size (slope: -85.4 ppb per mm3, R2=0.9, P=0.013, 2D). Specifically, at 0.42 mm3 there was a significant difference between R2* measurements at 7 and 3 T (177.5±2.1 vs. 108.7±3.9 sec-1, P<0.001) that was not seen with magnetic susceptibility (P=0.66), highlighting that magnetic susceptibility shows independence of field strength but dependence on voxel size. At 7 T, there was an increasing change in slope in R2* vs. magnetic susceptibility (0.61 to 1.10 sec-1 per ppb) as voxel size increased (0.03 to 0.42 mm3) (2E). At 3 T, there was a decreasing change in slope (0.83 to 0.56 sec-1 per ppb) as voxel size increased (0.42 to 0.72 mm3) (2F). Figure 3 displays a representative 90-min reperfused infarct at 3-day post-MI, where more images were acquired with larger voxel size. The heterogeneous distribution of tissue magnetic susceptibility at high resolution dissipated at lower resolution and infarct magnetic susceptibility appears to decrease with increasing voxel size.Discussion and Conclusion
R2* is sensitive to iron-induced magnetic field gradients but also affected by intravoxel signal dephasing due to large macroscopic gradient fields, where larger voxel size increases R2*. R2* was shown to be dependent on field strength4 which could be from amplified microscopic internal magnetic fields at 7 T elevating R2* compared to at 3 T8,9. We saw an R2* dependence on both voxel size and field strength in myocardial infarcts. Tissue magnetic susceptibility showed a significant decreasing regression with respect to voxel size independent of field strength. 7 and 3 T had opposite trends in slope (R2* vs. magnetic susceptibility, [sec-1 per ppb]) as voxel size increased, which could be from amplified internal iron-induced magnetic fields and a larger macroscopic gradient field with increased voxel size at 7 T causing an increase in R2*, whereas at 3 T without amplification of iron-induced magnetic fields, increased voxel size may cause more signal averaging and a decrease in R2*. In distinction to R2*, QSM utilizes MR signal phase to measure magnetic susceptibility, which is more specific to iron because iron alters the induced field, but there could be an averaging effect, where at increased voxel size, regions with high iron content and signal dephasing are being averaged with surrounding regions of lower iron content causing an overall decrease in magnetic susceptibility per voxel. In summary, it appears voxel size influences magnetic susceptibility independent of field strength, whereas R2* shows a tissue-dependent change with field strength and voxel size.Acknowledgements
We gratefully acknowledge support from R00-HL108157, R01-HL137984, NRSA in interdisciplinary Cardiovascular Biology NIH T32-HL007954, and HHMI-NIBIB Interfaces Program NIH T32-EB009384.References
1. Husser O, Monmeneu JV, Sanchis J et al. Cardiovascular magnetic resonance-derived intramyocardial hemorrhage after STEMI: Influence on long-term prognosis, adverse left ventricular remodeling and relationship with microvascular obstruction. Int J Cardiol. 2013;167(5):2047-2054.
2. Kali A, Kumar A, Cokic I et al. Chronic manifestation of postreperfusion intramyocardial hemorrhage as regional iron deposition: a cardiovascular magnetic resonance study with ex vivo validation. Circ Cardiovasc Imaging. 2013;6(2):218-228.
3. Moon BF, Kamesh Iyer S, Solomon MP et al. Magnetic susceptibility of hemorrhagic myocardial infarction: correlation with tissue iron and comparison with relaxation time MRI. Paris, France: International Society for Magnetic Resonance in Medicine annual meeting; 2018.
4. Moon BF, Kamesh Iyer S, Josselyn NJ et al. Magnetic susceptibility and T2* of myocardial reperfusion injury at 3 and 7 T. Montréal, QC, Canada: International Society for Magnetic Resonance in Medicine annual meeting; 2019.
5. Karsa A, Punwani S and Shmueli K. The effect of low resolution and coverage on the accuracy of susceptibility mapping. Magnetic Resonance in Medicine. 2018:1–16.
6. Liu T, Liu J, de Rochefort L et al. Morphology enabled dipole inversion (MEDI) from a single-angle acquisition: comparison with COSMOS in human brain imaging. Magn Reson Med. 2011;66(3):777-783.
7. Yushkevich PA, Piven J, Hazlett HC et al. User-guided 3D active contour segmentation of anatomical structures: significantly improved efficiency and reliability. Neuroimage. 2006;31(3):1116-1128.
8. Peters AM, Brookes MJ, Hoogenraad FG et al. T2* measurements in human brain at 1.5, 3 and 7 T. Magnetic Resonance Imaging 2007;25:748–753.
9. Deistung A, Schäfer A, Schweser F et al. Toward in vivo histology: A comparison of quantitative susceptibility mapping (QSM) with magnitude-, phase-, and R2*-imaging at ultra-high magnetic field strength. NeuroImage. 2013;65:299–314.
Figures