3215
3D Texture Analysis of Quantitative Susceptibility Mapping distinguishes Anaplastic Astrocytoma from Glioblastoma1Biomedical Engineering, Cornell University, Ithaca, NY, United States, 2Radiology, Weill Cornell Medical College, New York, NY, United States, 3New York Presbyterian Hospital, New York, NY, United States, 4Cornell University, New York, NY, United States
Synopsis
3D texture analysis-based feature extraction was deployed on QSM images of malignant astrocytoma (Anaplastic Astrocytoma (AA), grade III and Glioblastoma (GB), grade IV) and support vector classifier (SVC) (1) was trained and tested on multiple training-test dataset splits with different numbers of selected features using cross-validation (CV). Experiments indicate texture analysis on QSM is useful for differentiating AA and GB with high accuracy (94.7%).
Target audience
Researchers interested in texture analysis for brain tumor classification and clinical applications of quantitative susceptibility mapping (QSM)Introduction
Angiogenic vascular proliferation and necrosis play important roles in grading astrocytic tumors. More aggressive tumors tend to have denser and faster-growing tumor blood vessels. Hence, this neovascularization tends to be leaky, leading to intratumoral hemorrhage. Neovascularization and its associated micro- and macro-hemorrhages can be measured by QSM (2,3), which is highly sensitive to paramagnetic iron in venous blood and blood degradation products. Since the treatment regimen and length of survival are distinctly different between AA and GB patients (4), exploring the effect of QSM texture analysis for differentiating grade is important for diagnosis and prognosis. In this work, we extract radiomic features of QSM based on 3D texture analysis and then use SVC with recursive feature elimination and cross validation (RFECV) to train the classifier. Our experimental results show high accuracy in differentiating AA and GB.Methods
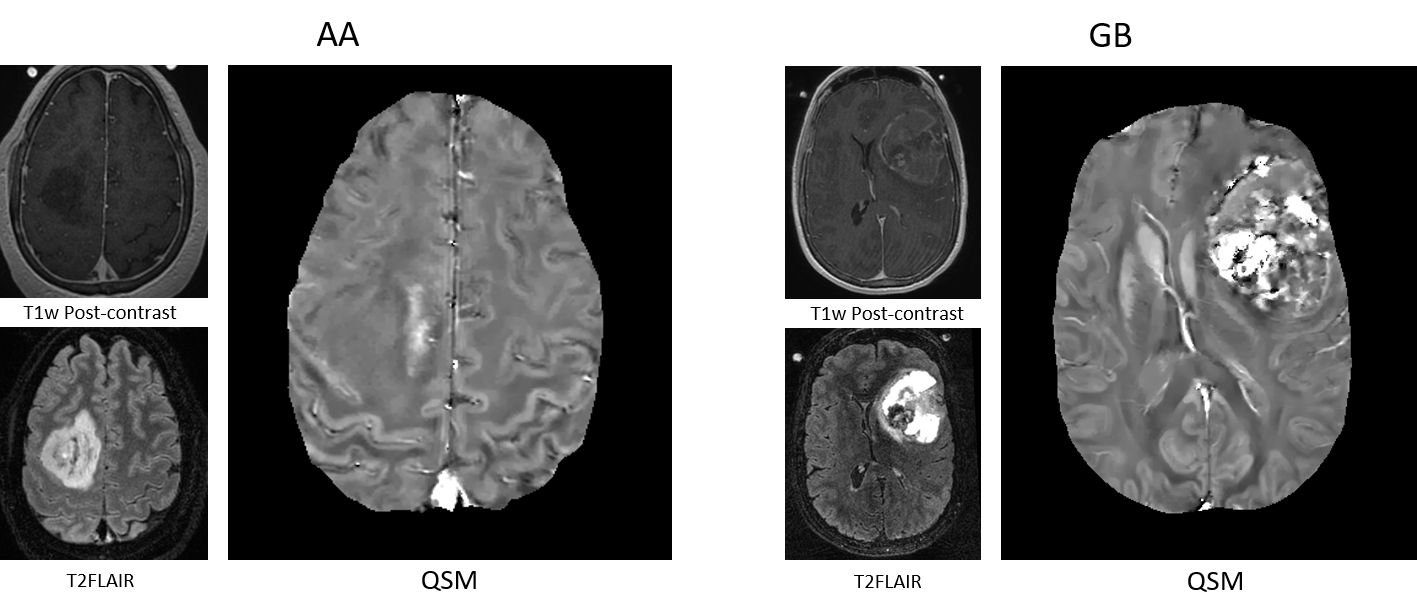
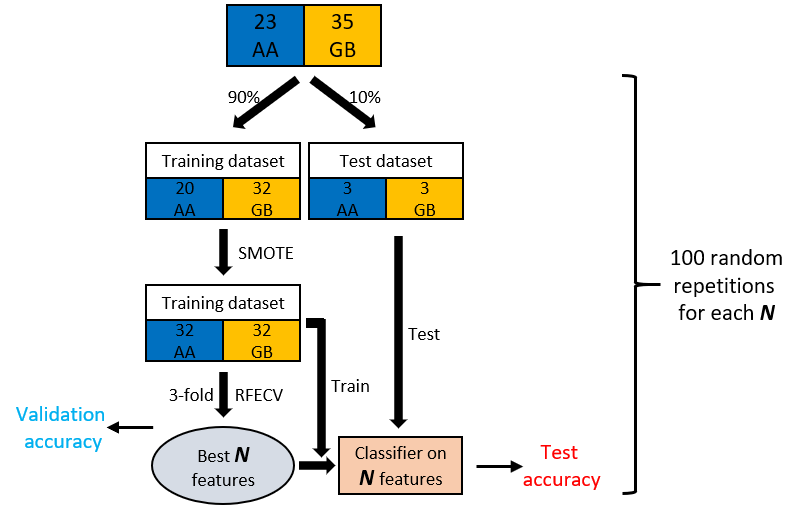
58 histopathologically confirmed patients with newly diagnosed malignant astrocytoma based on 2016 World Health Organization criteria, including molecular profiling, were included in this retrospective study (n=23 AA and n=35 GB). Multi-echo gradient echo (GRE) imaging plus standard T1w and post-contrast T1w, T2FLAIR imaging were acquired for preoperative MRI tumor imaging. QSM was reconstructed from Multi-echo GRE data using morphology enabled dipole inversion (MEDI) method (5,6). Regions of interest (ROI) were defined as the whole tumor volume on post-contrast T1w and T2FLAIR images, including enhancing and non-enhancing tumor, necrotic and T2 hyperintense areas, then used as the mask to extract radiomic features from QSM.107 radiomic features (7) (19 first-order statistical features, 10 shape-based features, 24 gray level cooccurrence matrix (GLCM) features, 16 gray level run length matrix (GLRLM) features, 16 gray level size zone matrix (GLSZM) features, 5 neighboring gray tone difference matrix (NGTDM) features and 14 gray level dependence matrix (GLDM) features) were extracted from the ROI on QSM. 10% of patients were randomly selected as test dataset (3 AAs and 3 GBs), and the remaining 90% were used for training. Synthetic minority over sampling technique (SMOTE) (8) was applied to increase the training dataset in a balanced way. After data augmentation, 3-fold cross validation with recursive feature elimination was used to rank the importance of all radiomic features. $$$N$$$ most important features were selected for training and testing SVC classifier. For each pre-defined $$$N$$$, the above process was repeated at 100 times (Figure 2).
Results
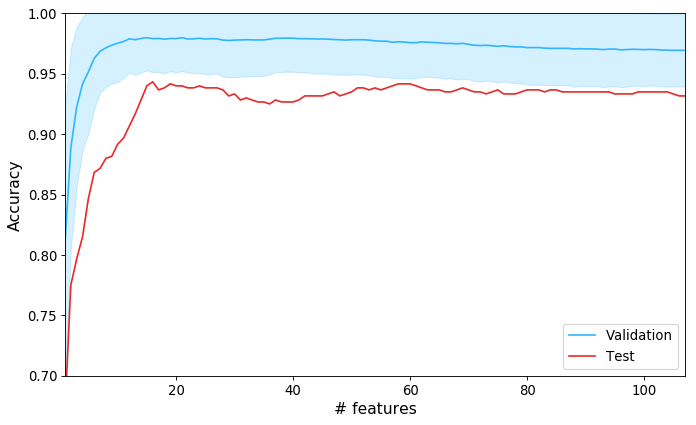
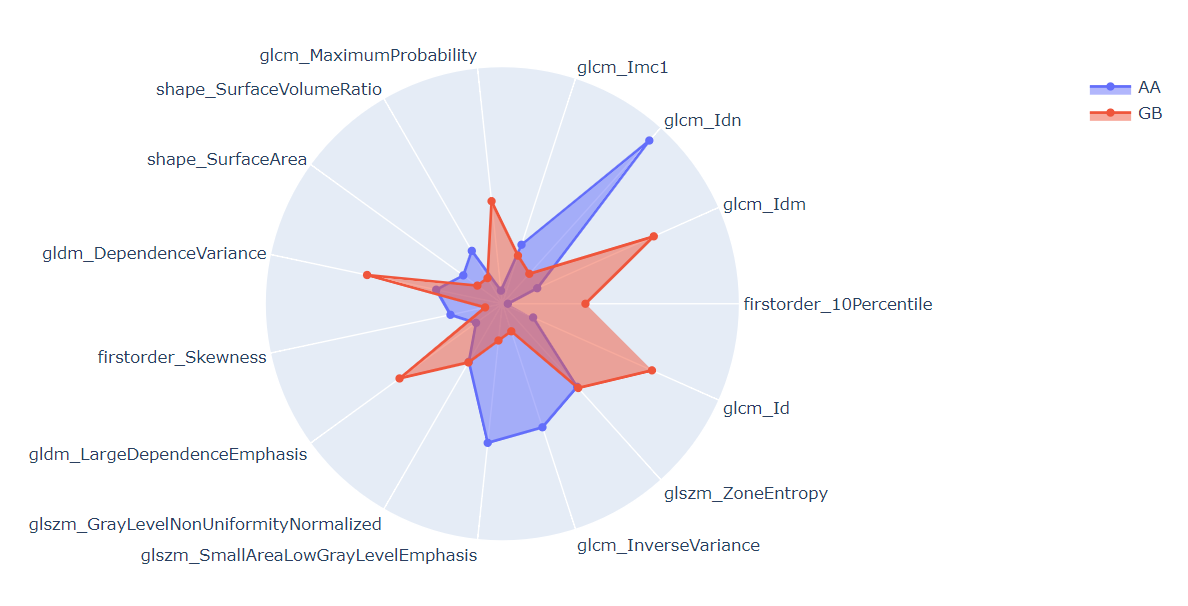
Figure 1 shows QSMs of representative AA and GB tumors. Hyperintense intratumoral susceptibility was found to increase with increasing tumor grade. Figure 3 shows average validation accuracy (blue curve) with standard deviation (shadow) and test accuracy over 100 repetitions at each $$$N$$$. The maximal average validation accuracy (98.0%) occurred at $$$N=15$$$, and after that, it decreased slightly as $$$N$$$ increased. Maximal average test data accuracy (94.7%) was also reached at around $$$N=15$$$. For the 15 most important features of two representative AA and GB cases in the training dataset, figure 4 shows relative feature values of these two cases with respect to the maximal absolute values of each corresponding feature among the training dataset. In this radar chart, AA and GB cases had distinct feature representations and could be easily differentiated accordingly.Discussion and conclusion
QSM, which does not require a contrast-enhancing agent, could provide additional information related to the pathological grade in brain tumors. Furthermore, texture analysis using QSM with the ability to visualize vasculature and hemorrhage can be a useful tool in distinguishing AA from GB, which is important for treatment and prognosis.Acknowledgements
No acknowledgement found.References
1. Boser BE, Guyon IM, Vapnik VN. A training algorithm for optimal margin classifiers. 1992. ACM. p 144-152.
2. Wang Y, Liu T. Quantitative susceptibility mapping (QSM): decoding MRI data for a tissue magnetic biomarker. Magnetic resonance in medicine 2015;73(1):82-101.
3. Wang Y, Spincemaille P, Liu Z, Dimov A, Deh K, Li J, Zhang Y, Yao Y, Gillen KM, Wilman AH. Clinical quantitative susceptibility mapping (QSM): biometal imaging and its emerging roles in patient care. Journal of Magnetic Resonance Imaging 2017;46(4):951-971.
4. Rao SAM, Srinivasan S, Patric IRP, Hegde AS, Chandramouli BA, Arimappamagan A, Santosh V, Kondaiah P, Rao MRS, Somasundaram K. A 16-gene signature distinguishes anaplastic astrocytoma from glioblastoma. PloS one 2014;9(1):e85200.
5. Liu J, Liu T, de Rochefort L, Ledoux J, Khalidov I, Chen W, Tsiouris AJ, Wisnieff C, Spincemaille P, Prince MR. Morphology enabled dipole inversion for quantitative susceptibility mapping using structural consistency between the magnitude image and the susceptibility map. Neuroimage 2012;59(3):2560-2568.
6. Liu T, Wisnieff C, Lou M, Chen W, Spincemaille P, Wang Y. Nonlinear formulation of the magnetic field to source relationship for robust quantitative susceptibility mapping. Magnetic resonance in medicine 2013;69(2):467-476.
7. Lambin P, Rios-Velazquez E, Leijenaar R, Carvalho S, Van Stiphout RG, Granton P, Zegers CM, Gillies R, Boellard R, Dekker A. Radiomics: extracting more information from medical images using advanced feature analysis. European journal of cancer 2012;48(4):441-446.
8. Chawla NV, Bowyer KW, Hall LO, Kegelmeyer WP. SMOTE: synthetic minority over-sampling technique. Journal of artificial intelligence research 2002;16:321-357.
Figures