3213
Increased susceptibility in cortical veins and nuclei in small vessel disease revealed by susceptibility weighted imaging and mapping at 7T1State Key Laboratory of Brain and Cognitive Science, Institute of Biophysics, Chinese Academy of Sciences, Beijing, China, 2University of Chinese Academy of Sciences, Beijing, China, 3CAS Center for Excellence in Brain Science and Intelligence Technology, Beijing, China, 4Department of Neurology, Peking University First Hospital, Beijing, China, 5Siemens Shenzhen Magnetic Resonance Ltd., Shenzhen, China, 6Department of Radiology, Xuanwu Hospital, Capital Medical University, Beijing, China
Synopsis
Cerebral autosomal dominant arteriopathy with subcortical infarcts and leukoencephalopathy (CADASIL) is the most common hereditary cerebral small vessel disease (SVD). This study aimed to use susceptibility weighted imaging and mapping (SWIM) at 7 Tesla to evaluate venous oxygen saturation (SvO2) and subcortical nuclear iron deposition and explore the correlation of these parameters with the clinical phenotypes of CADASIL patients. We found decreases in SvO2 and abnormal iron deposition in patients compared with healthy individuals. Also, we found associations between susceptibilities and clinical characteristics of CADASIL. These results suggest that SWIM can be used to assess clinical conditions of SVD patients.
Introduction
Cerebral autosomal dominant arteriopathy with subcortical infarcts and leukoencephalopathy (CADASIL) is an inherited small vessel disease (SVD) caused by NOTCH3 gene mutations.1,2 Accumulating evidence has demonstrated clinical changes, including hemodynamic abnormalities, cerebral hypoperfusion, and abnormal iron deposition in deep gray matter, which indicate that the susceptibility of cortical veins and subcortical nuclei could be potential biomarkers for CADASIL.3,4 Benefiting from higher signal-to-noise ratios and stronger susceptibility effect at ultra-high field imaging, 7 Tesla (7T) susceptibility weighted imaging and mapping (SWIM) is a promising method to quantitatively assess tissue susceptibilities and thus investigate physiologic characteristics, such as venous oxygen saturation (SvO2) and iron deposition.5–7 In this study, we investigated whether 7T SWIM could detect altered cortical SvO2 and iron deposition of subcortical nuclei and whether these changes were related to the clinical phenotypes of CADASIL patients.Methods
Forty-one patients and 43 sex- and age-matched healthy controls (HC) were included in this study after excluding subjects with poor image quality. Magnetic resonance imaging (MRI) scans were performed on a 7T MRI system (Siemens, Erlangen, Germany). The protocols included T1-weighted magnetization-prepared rapid gradient echo (MPRAGE), T2-weighted fluid-attenuated inversion recovery (FLAIR), and SWI. The key parameters of the imaging sequences were shown in Table 1. T1w-MPRAGE evaluated lacunar infarctions (LIs), T2w-FLAIR evaluated white matter hyperintensities (WHMs) load, and SWI evaluated cerebral microbleeds (CMBs). Mini-Mental State Examinations (MMSEs) were administered to evaluate neurocognitive function. Modified Rankin Scale (mRS) and Barthel Index (BI) tests determined the degrees of dependence.SWIM image data were reconstructed from magnitude and phase images using the Susceptibility Mapping and Phase Artifacts Removal Toolbox (Detroit, MI). Susceptibility measurements were conducted with MATLAB software (R2018a, The MathWorks, Inc). To evaluate cortical venous susceptibility, whole-brain susceptibility was mapped to nine cross-sectional images via maximum intensity projection (MaxIP). Appropriate thresholds were set to filter out the non-venous signal in each image. Subsequently, bilateral regions of interest (ROIs) of cortical veins were selected manually to measure mean susceptibilities. To evaluate susceptibilities of subcortical nuclei, ROIs in multiple slices were selected to represent the following nuclei: caudate nucleus (CN), putamen (PUT), globus pallidus (GPi), thalamus (THA), substantia nigra (SN), and red nucleus (RN).
Mean susceptibilities were compared between the patients and HCs. The susceptibilities of veins and nuclei, the MRI lesions, and the clinical characteristics were compared between the groups.
Results
In the venous susceptibility study, we found that susceptibility increased with age (r=0.508, P=0.001) and was higher in the CADASIL patients compared with the HCs (t=−4.673; P<0.001), suggesting decreased venous oxygen saturation in CADASIL patients. We found positive associations between venous susceptibility and MRI lesion loads, including ARWMC scores (r=0.364; P=0.019), LI numbers (r=0.520; P<0.001), CMB numbers (ρ=0.445; P=0.004), and SVD scores (ρ=0.465; P=0.002) in the patients. Moreover, increased venous susceptibility was associated with higher mRS scores in CADASIL patients compared with HCs after adjustment for age- and small-vessel disease scores (odds ratio=3.178; 95% CI, 1.101–9.179; P=0.033).When studying subcortical nuclear susceptibility, we found higher susceptibilities in CN (t=4.258, P<0.001), PUT (t=4.304, P<0.001), THA (t=4.797, P<0.001), SN (t=2.348, P=0.022), and RN (t=3.842, P<0.001), indicating that CADASIL patients had increased iron deposition in deep grey matter. Multiple associations between susceptibility and MRI lesion loads were found, detailed in Table 3.
Discussion
This study was the first to use SWIM at 7T in CADASIL patients to demonstrate the change of susceptibilities in cortical veins and subcortical nuclei, and investigate their associations with functional dependence. Our study showed that SWIM can be used to evaluate patients with SVD, and these venous and nuclear changes can indicate the clinical progression of CADASIL. The results suggest that there may be cerebral hypoperfusion and abnormal iron deposition caused by small artery pathology of CADASIL, which could lead to central nervous system (CNS) damage in these patients.There are still several limitations in our study. First, threshold selection is critical to ensure the accuracy of susceptibility calculations. We used ten different thresholds and conducted subsequent analyses to find an appropriate threshold for the venous susceptibility (Fig. 1c). Although we saw significant venous susceptibility in CADASIL vs. HC under all the ten thresholds, a better method to distinguish and filter the different ROI components is needed. Second, when studying subcortical nuclear susceptibility, SWIM suffered from ill-posed inverse problem, field bias, and phase aliasing, which might have caused deviations in the susceptibility values.8 Further studies are needed to confirm the susceptibility values caused by iron deposition in the nuclei in patients with CADASIL. Increasing the number of echoes will also improve the fidelity of susceptibility mapping.9
Conclusions
Our study demonstrated higher venous and nuclear susceptibilities in CADASIL patients, indicating decreased SvO2 in cortical veins and abnormal iron deposition in subcortical nuclei. We also showed a solid association between venous susceptibility and clinical phenotypes of the CADASIL patients. Together, these findings suggest that 7T SWIM can be used to assess the condition of patients with SVD.Acknowledgements
We would like to thank Professor E. Mark Haacke (Wayne State University MR 11 Research Facility, HUH-MR Research/Radiology, 3990 John R Road, Detroit, Michigan) for his kind gift of the SWIM and software manuals.
This work was supported in part by the Beijing Municipal Natural Science Foundation (7184226), Young Elite Scientists Sponsorship Program by CAST (2017QNRC001), the grant of Ministry of Science and Technology of China (2017YFC1307904, 2016YFC1300605), and the Beijing Municipal Natural Science Foundation (19G10046).
References
- Goate, A. M. & Morris, J. C. Notch3 mutations and the potential for diagnostic testing for CADASIL. The Lancet 350, 1490 (1997).
- Chen, S. et al. Clinical features and mutation spectrum in Chinese patients with CADASIL: A multicenter retrospective study. CNS Neurosci. Ther. 23, 707–716 (2017).
- Kesavadas, C., Santhosh, K. & Thomas, B. Susceptibility weighted imaging in cerebral hypoperfusion—can we predict increased oxygen extraction fraction? Neuroradiology 52, 1047–1054 (2010).
- Liem, M. K. et al. 7 T MRI reveals diffuse iron deposition in putamen and caudate nucleus in CADASIL. J. Neurol. Neurosurg. Psychiatry 83, 1180–1185 (2012).
- Haacke, E. M., Tang, J., Neelavalli, J. & Cheng, Y. C. N. Susceptibility mapping as a means to visualize veins and quantify oxygen saturation. J. Magn. Reson. Imaging 32, 663–676 (2010).
- Chai, C. et al. Quantitative measurement of brain iron deposition in patients with haemodialysis using susceptibility mapping. Metab. Brain Dis. 30, 563–571 (2015).
- Ling, C. et al. Reduced Venous Oxygen Saturation Associates With Increased Dependence of Patients With Cerebral Autosomal Dominant Arteriopathy With Subcortical Infarcts and Leukoencephalopathy: A 7.0-T Magnetic Resonance Imaging Study. Stroke 50, 3128–3134 (2019).
- Tang, J. et al. Improving susceptibility mapping using a threshold-based K-space/image domain iterative reconstruction approach. Magn. Reson. Med. 69, 1396–1407 (2013).
- Haacke, E. M. et al. Quantitative susceptibility mapping: current status and future directions. Magn. Reson. Imaging 33, 1–25 (2015).
Figures
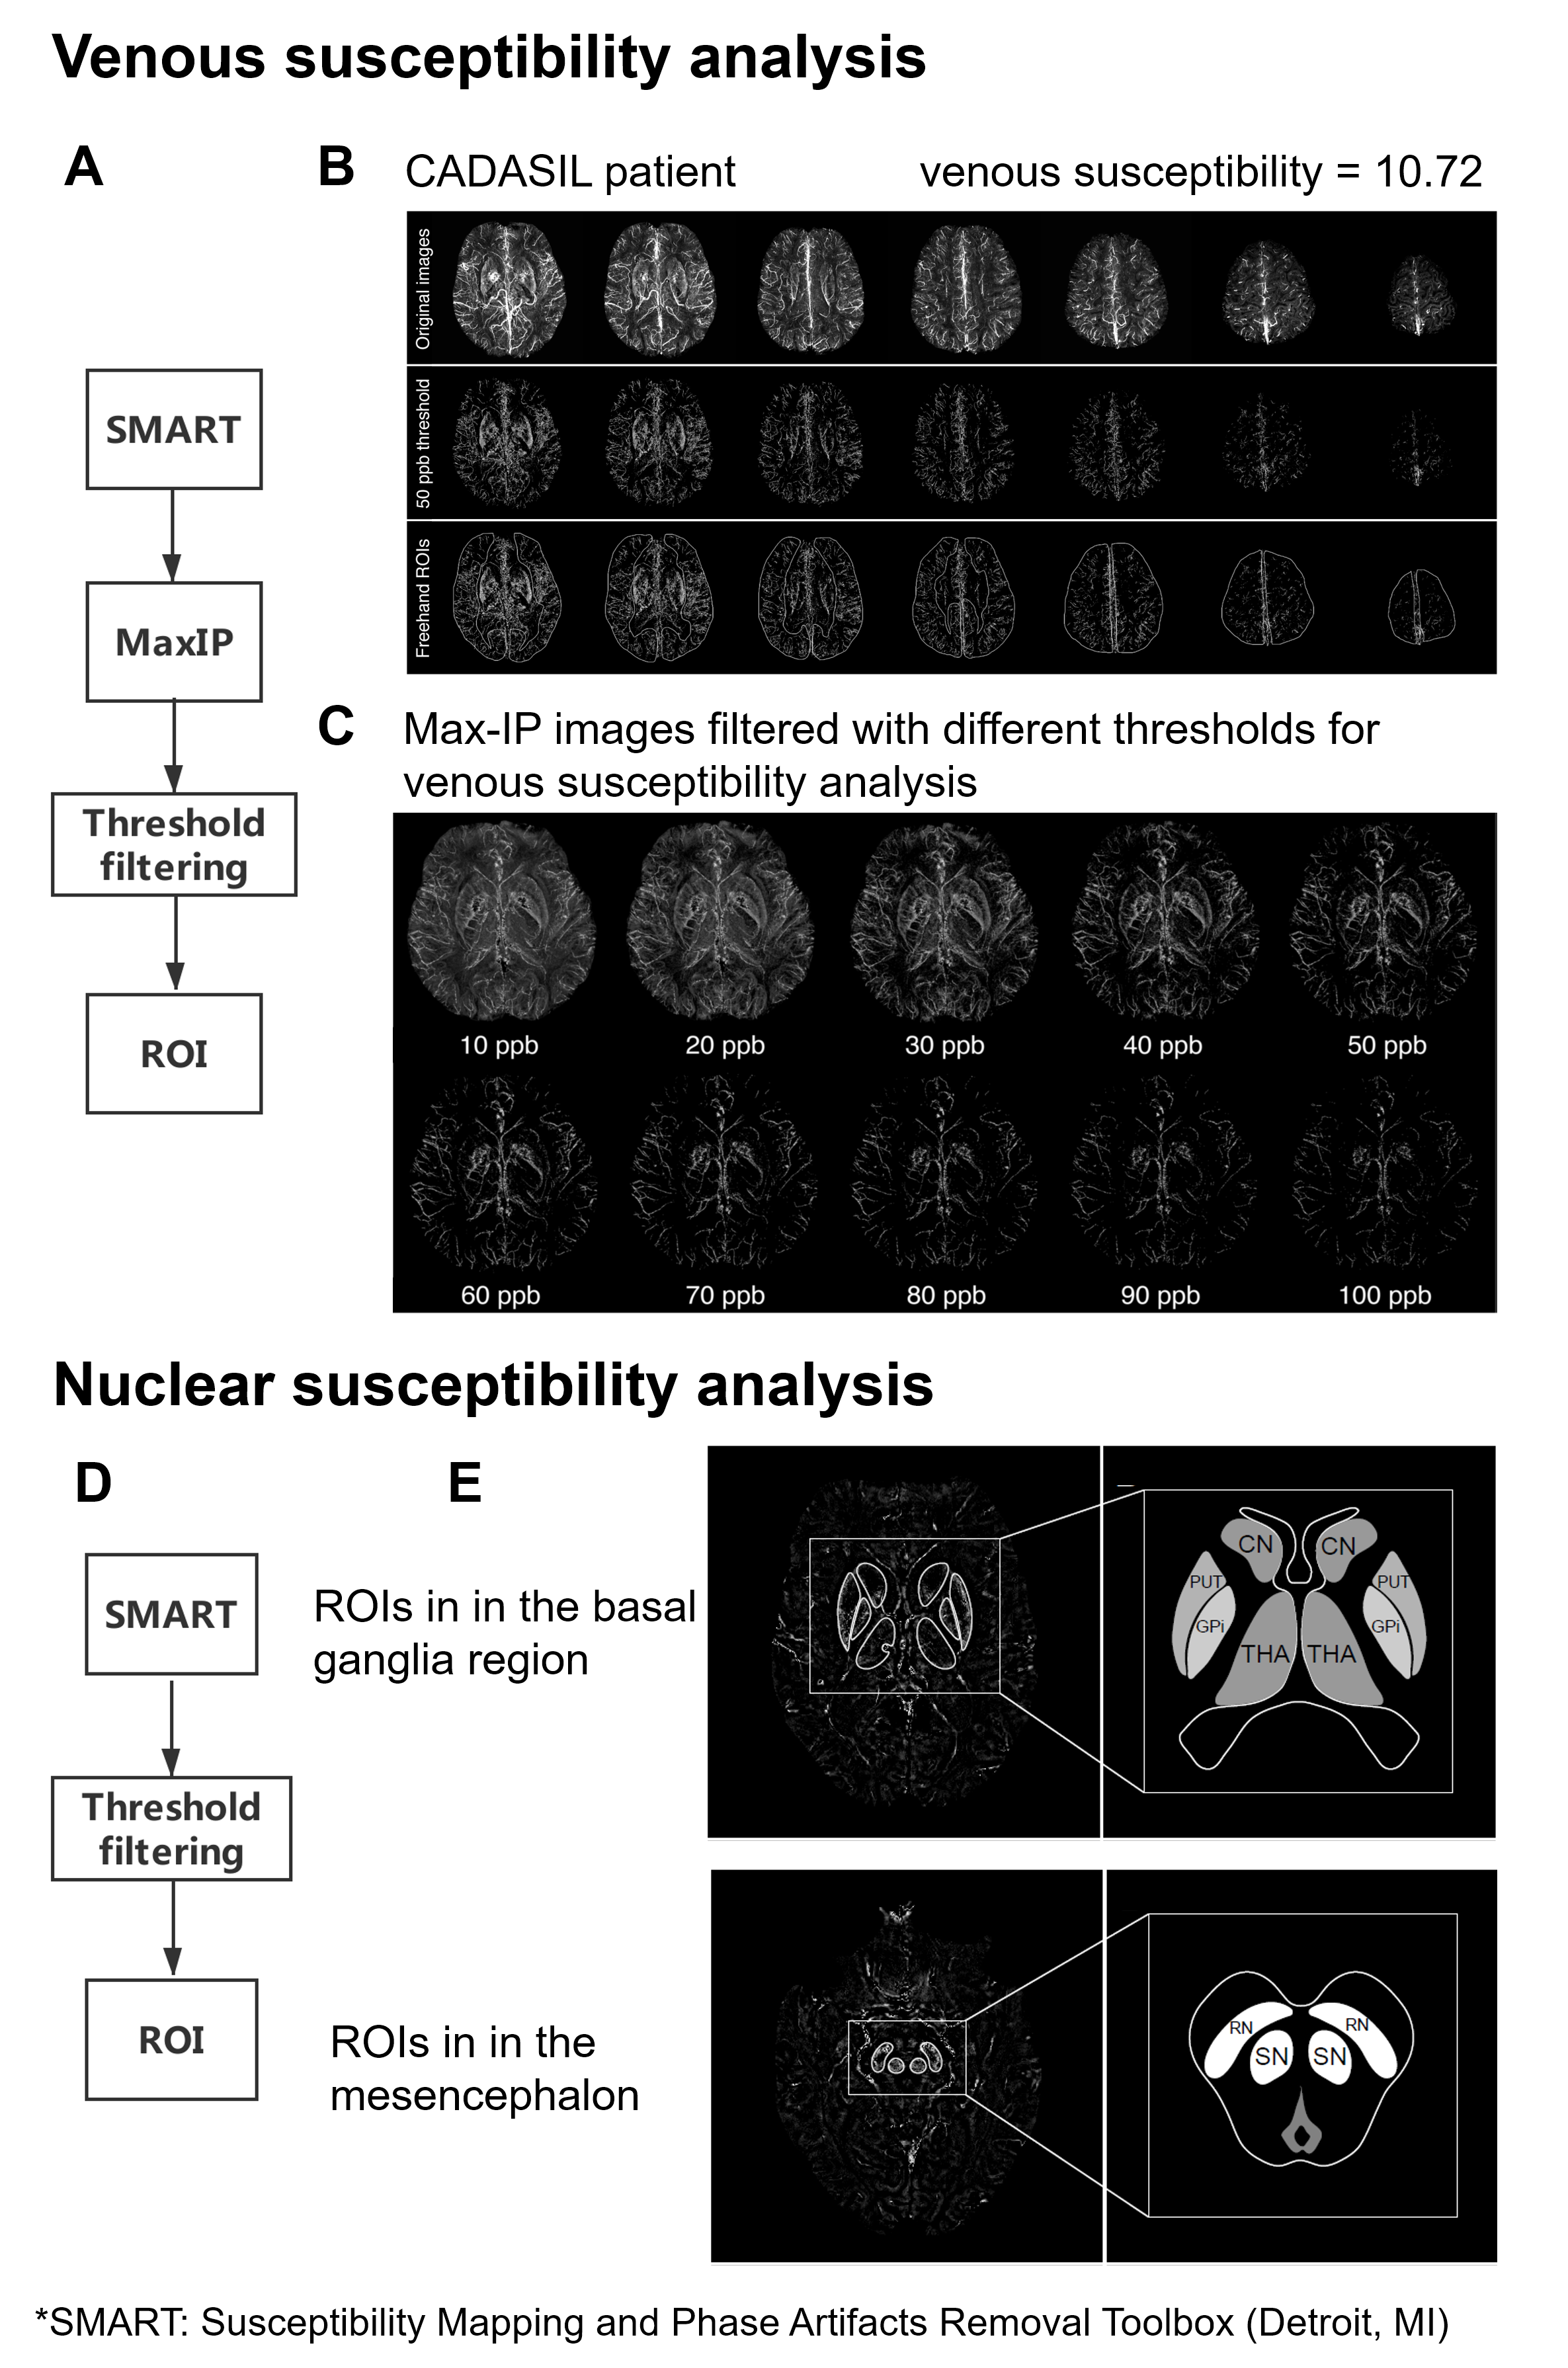
Figure 1. Illustration of regions of interest (ROIs) selection and threshold method of susceptibility analysis
(A) Flow chart of venous susceptibility analysis. (B) The maximum intensity projection (Max-IP) image of SWIM and analysis of a patient. (C) SWIM Max-IP images filtered with different thresholds. (D) Flow chart of nuclear susceptibility analysis. (E) SWIM and ROIs of deep grey matter nuclei in the basal ganglia region and mesencephalon of a CADASIL patient.
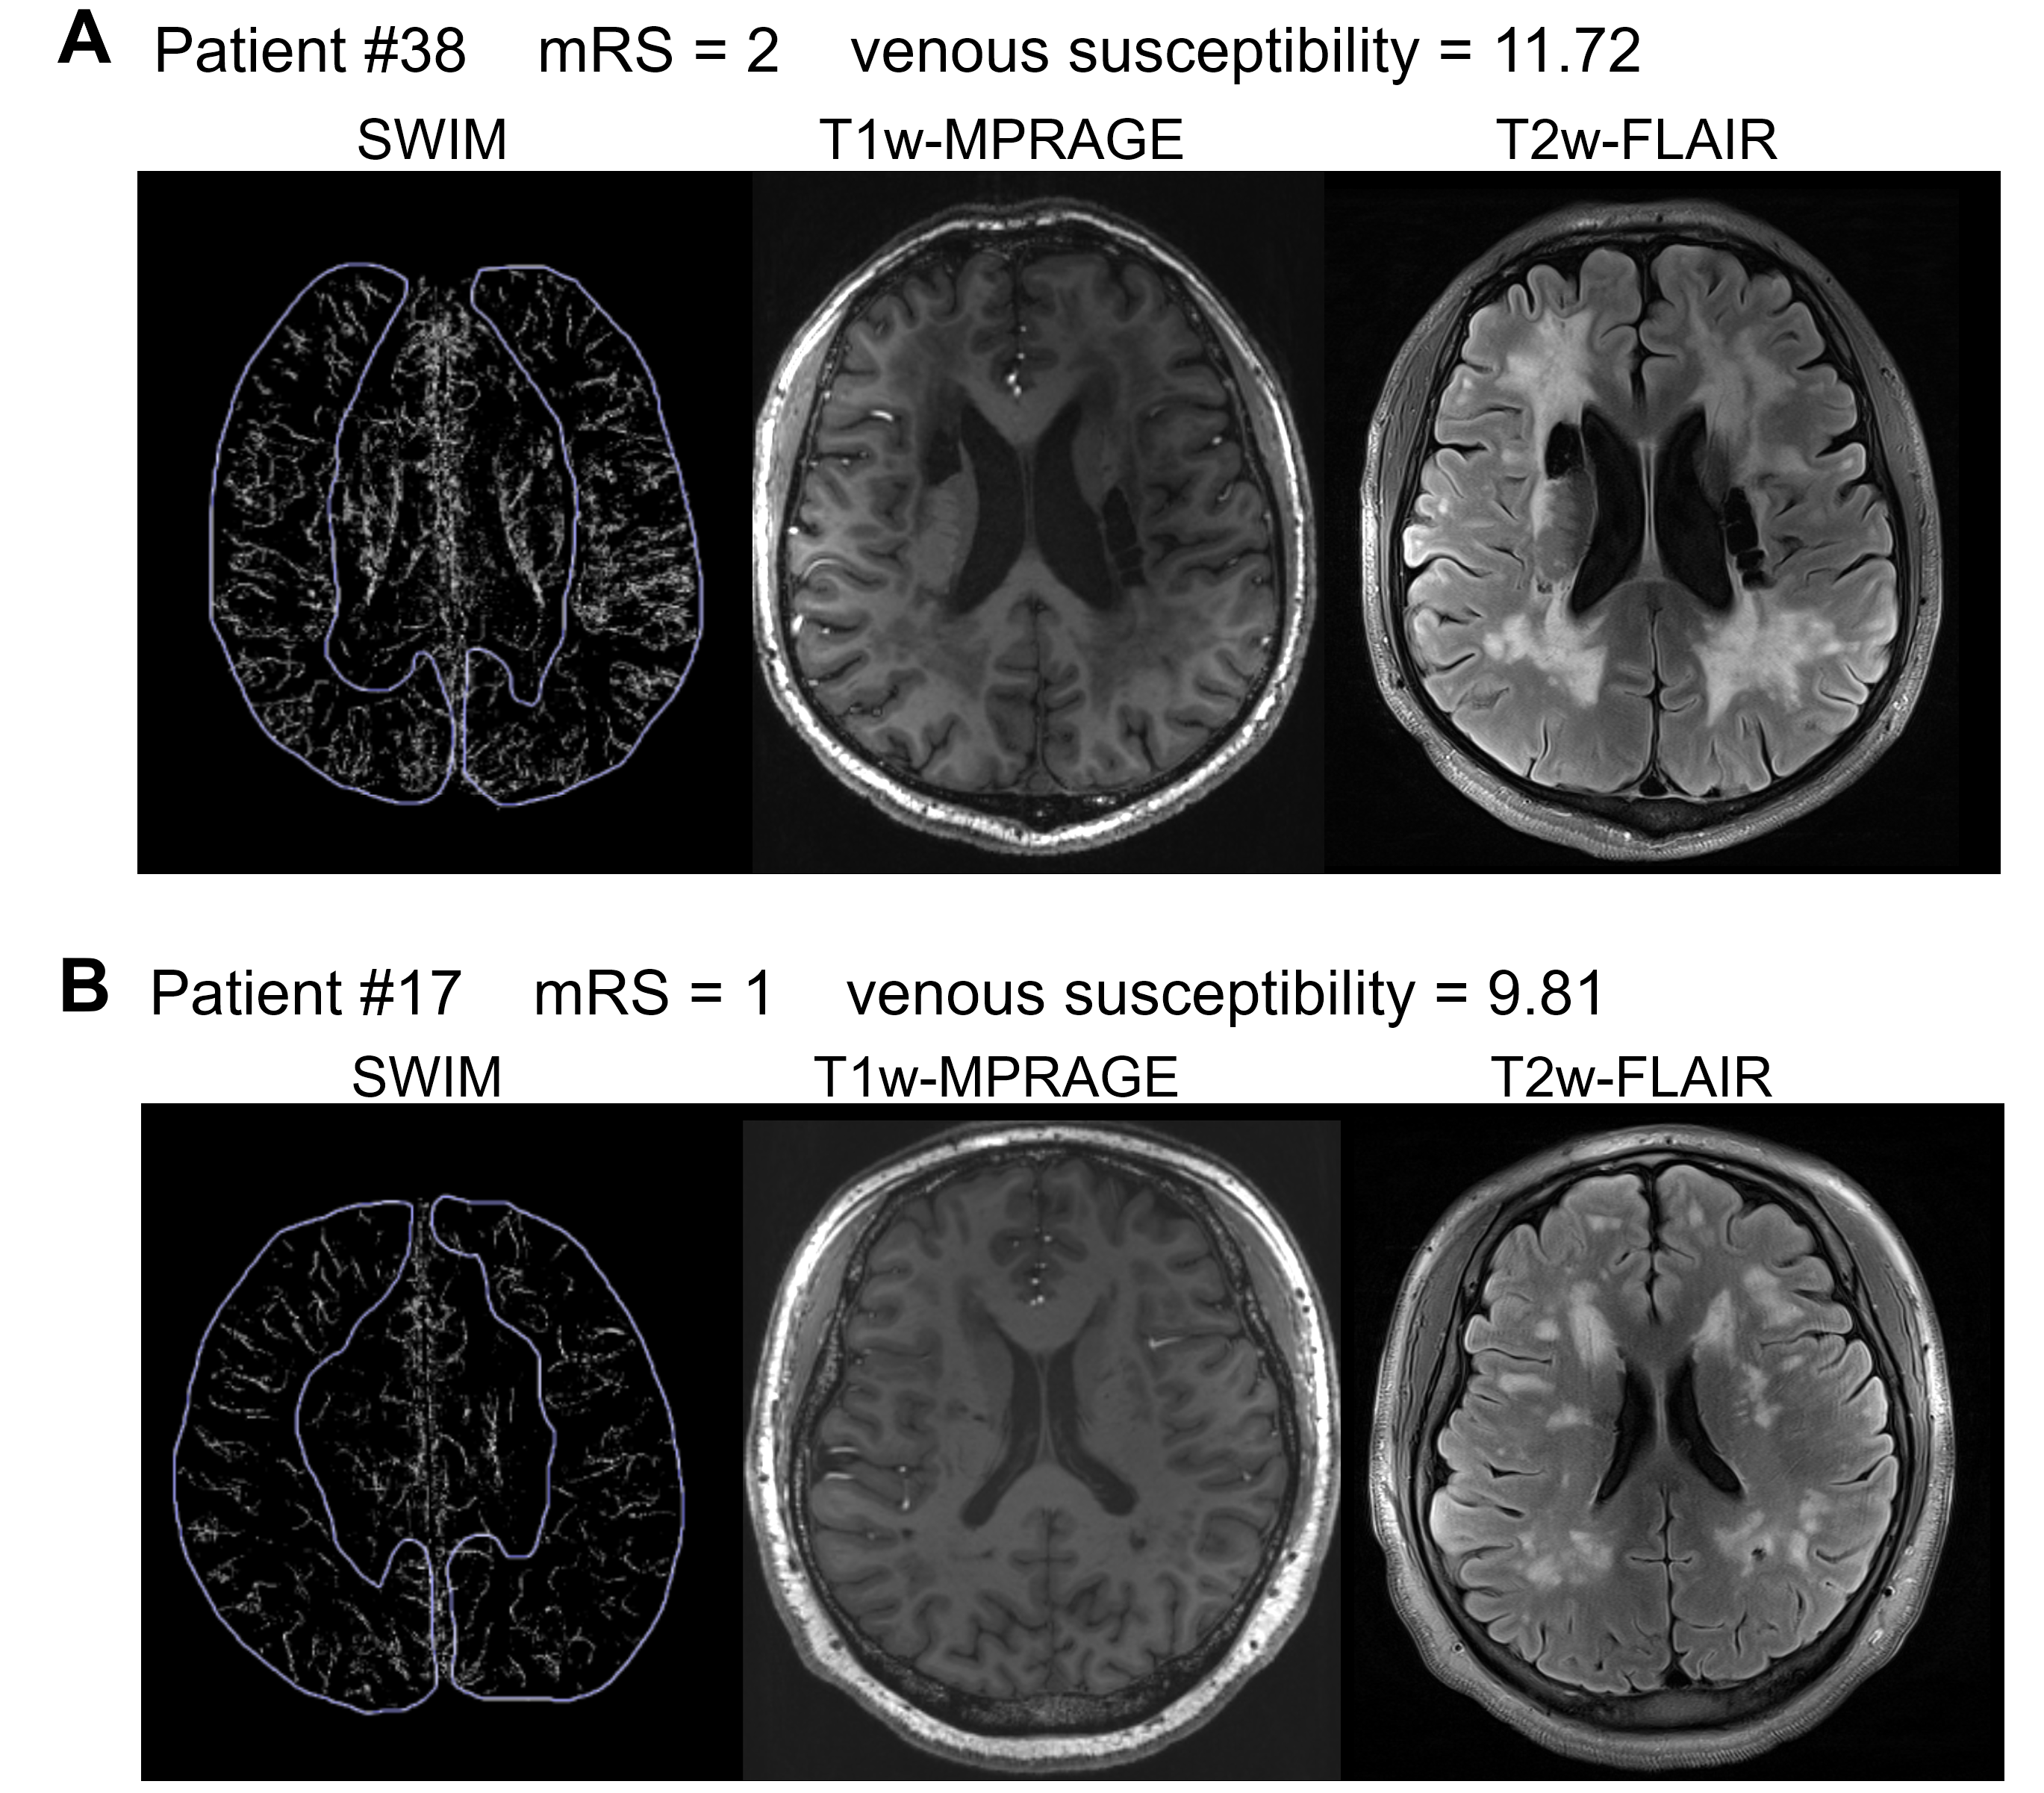
Figure 2. Increased venous susceptibility and more obvious features in CADASIL patients with higher modified Rankin Scale (mRS) scores
(A) Image of a patient with an mRS score of 2. T1w-MPRAGE demonstrates multiple lacunar infarctions of the patient (middle). T2w-FLAIR shows extensive white matter hyperintensities of the patient (right). (B) Image of a patient with an mRS score of 1. T1w-MPRAGE (middle) and T2w-FLAIR (right) show smaller volume of lesions than patient (A).
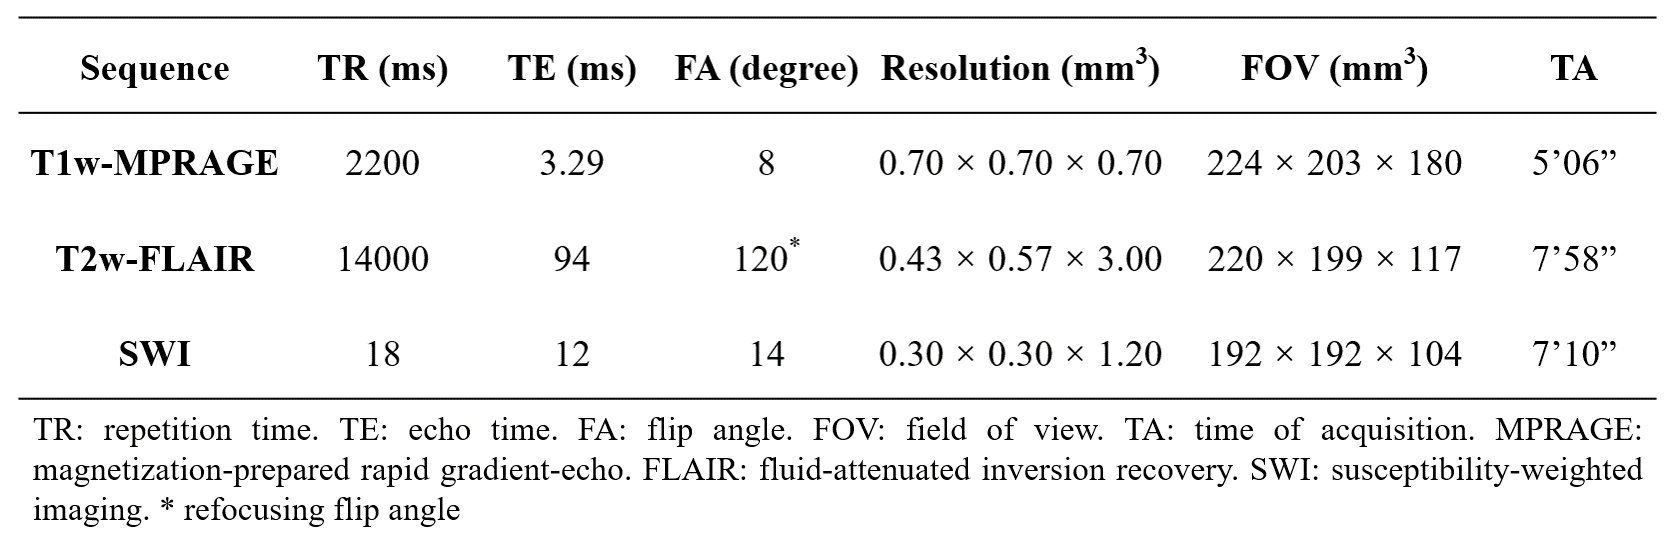
Table 1. The imaging parameters of the 7 Tesla magnetic resonance imaging (MRI) scans
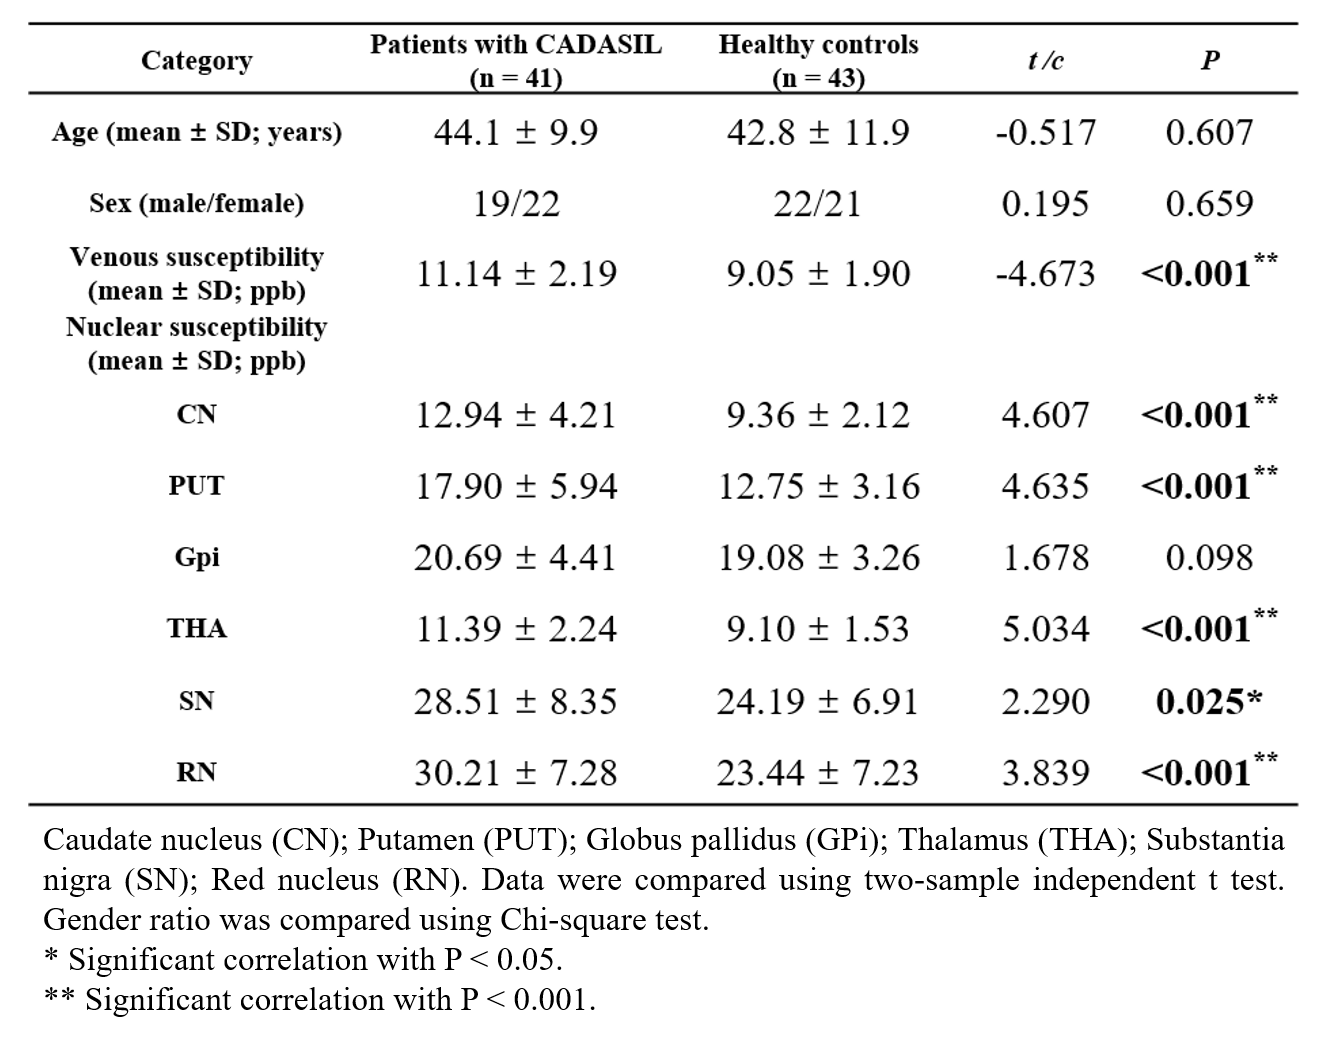
Table 2. Comparisons of venous and nuclear susceptibility between patients with cerebral autosomal dominant arteriopathy with subcortical infarcts and leukoencephalopathy (CADASIL) and healthy controls
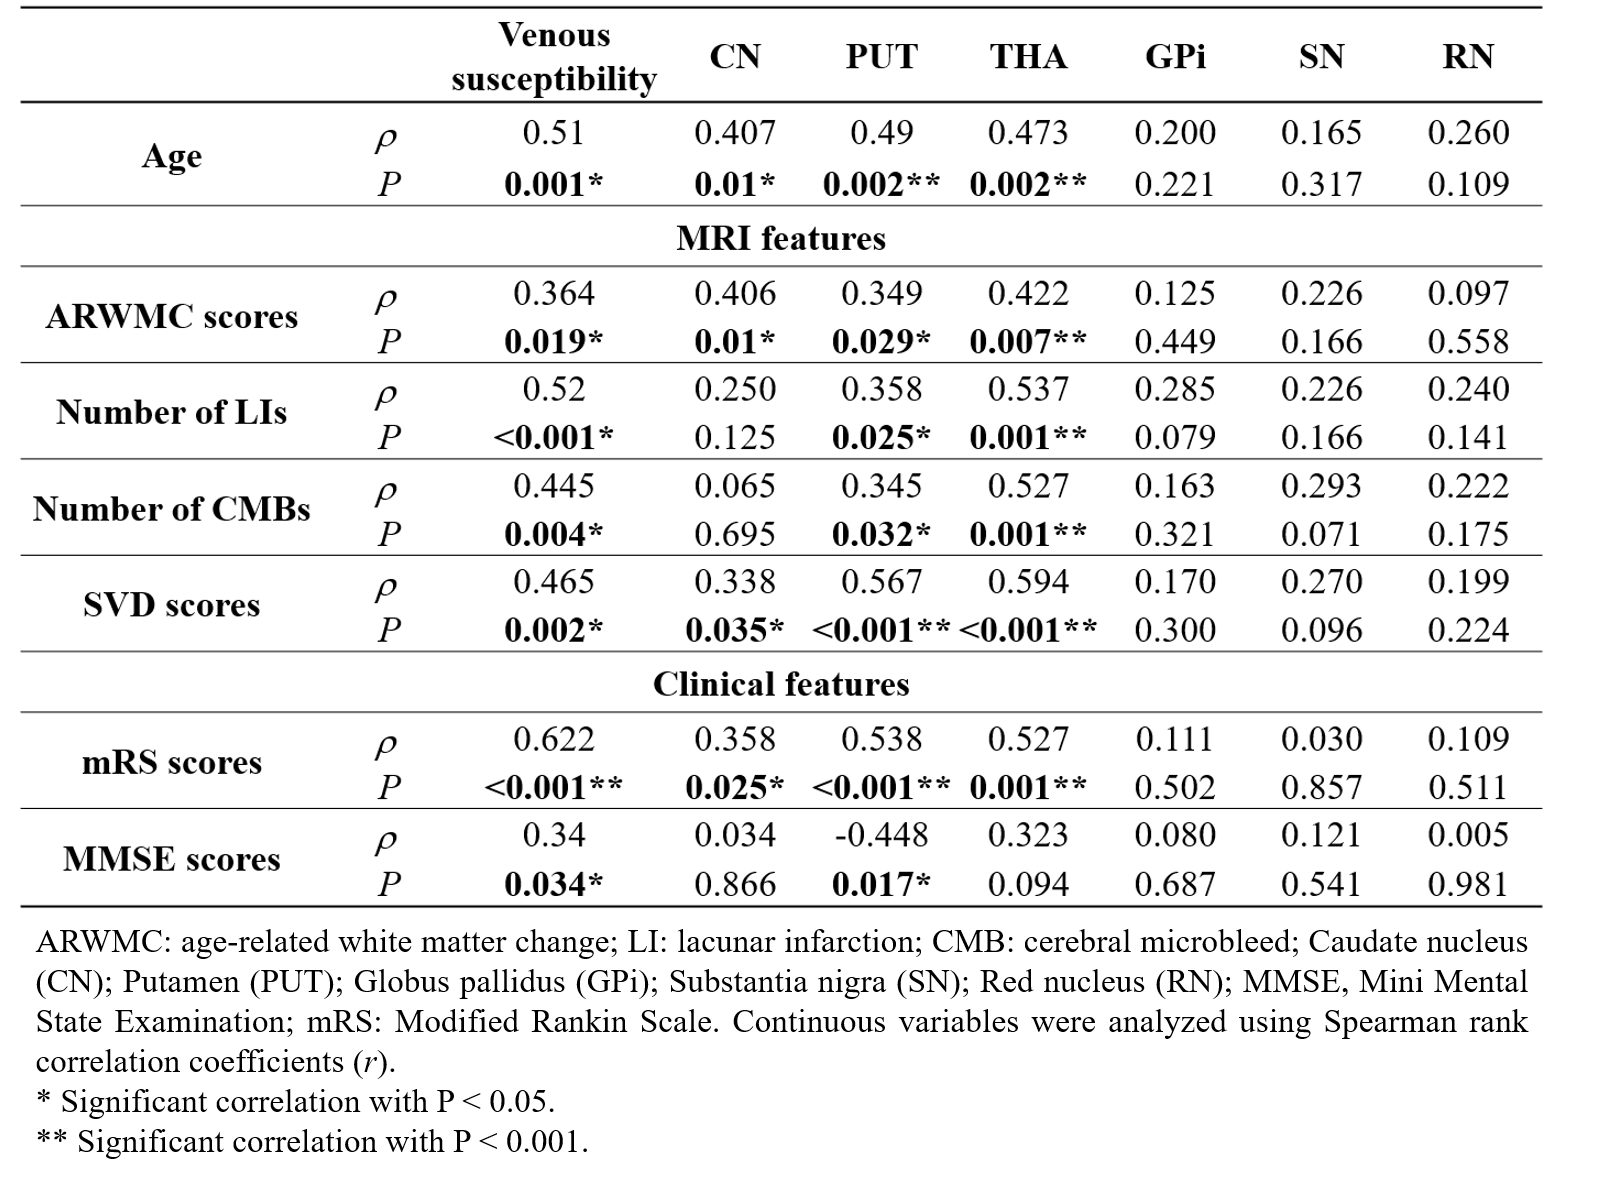
Table 3. Correlations between increased susceptibility and MRI / clinical features in patients with CADASIL