3211
Quantitative susceptibility mapping and PET indicate iron-related cognitive decline during aging
Lin Chen1,2,3, Anja Soldan4, Kenichi Oishi1, Andreia Faria1, Marilyn Albert4, Peter C.M. Van zijl1,2, and Xu Li1,2
1Department of Radiology and Radiological Sciences, Johns Hopkins University, Baltimore, MD, United States, 2F.M. Kirby Research Center for Functional Brain Imaging, Kennedy Krieger Institute, Baltimore, MD, United States, 3Department of Electronic Science, Fujian Provincial Key Laboratory of Plasma and Magnetic Resonance, Xiamen University, XIAMEN, China, 4Department of Neurology, Johns Hopkins University, Baltimore, MD, United States
1Department of Radiology and Radiological Sciences, Johns Hopkins University, Baltimore, MD, United States, 2F.M. Kirby Research Center for Functional Brain Imaging, Kennedy Krieger Institute, Baltimore, MD, United States, 3Department of Electronic Science, Fujian Provincial Key Laboratory of Plasma and Magnetic Resonance, Xiamen University, XIAMEN, China, 4Department of Neurology, Johns Hopkins University, Baltimore, MD, United States
Synopsis
We investigated the associations between brain iron levels, as measured by QSM MRI, and amyloid-β plaque load as measured by 11C-PiB PET imaging, and their possible synergistic effect on both global composite and domain specific cognitive functions, including memory, visuospatial processing and language. Various association patterns were observed between iron load and amyloid-β deposition in voxel-based analysis. More importantly, in cognitively normal adults, iron levels in several brain regions were found negatively associated with cognition. This was independent of amyloid-β load, suggesting that the impact of iron on cognition may be related to other known molecular changes during early aging.
Introduction
Alzheimer’s Disease (AD) is the most common cause of dementia.1 Recent studies suggest that, together with the well-known amyloid-β and tau pathology2-4, cerebral iron overload may play an important role in AD pathogenesis. In addition, the interaction between iron and amyloid-β may further promote the neurodegeneration and cognitive decline in AD5-7. However, the local correlations between iron and amyloid-β and their possible combined effects on different cognitive domain functions in normal aging are still poorly understood. In this study, voxel-level correlations between iron levels from quantitative susceptibility mapping (QSM) measures and amyloid-β plaque load based on 11C-PiB PET imaging were investigated, together with their possible effect on global and domain specific cognitive functions.Methods
Ninety-seven participants (68.7 ± 9.0 y/o, 35 males) were recruited through the BIOCARD cohort8,9. Among them, 76 were categorized as cognitively normal and 21 as impaired but not MCI (i.e. Subject or other source expressed concerns about cognitive changes but the cognitive testing did not show changes, or vice versa10). Global cognitive composite score was calculated based on 4 individual measures8, multiple domains of cognition score (verbal episodic memory, executive function, visuospatial processing, and language) were assessed from neuropsychological tests8. For susceptibility imaging, subjects were scanned on a 3T Philips scanner using a 3D multi-echo GRE sequence (TR/TE1/∆TE = 40/6/6 ms, 5 echoes, voxel size = 1×1×1 mm3). QSM processing involved best-path based phase unwrapping11, VSHARP-background field removal12 and SFCR13. The dynamic 11C-PiB PET studies were performed on a GE Advance scanner and Distribution volume ratio (DVR) images were calculated in the native space of each PET image14. Selected ROIs in superior and middle frontal gyrus (SMF), inferior and orbital frontal gyrus (IOF), parietal, temporary, occipital and entorhinal cortex (ENT), cingulate, amygdala and hippocampus were extracted using a multi-atlas approach (mricloud.org) and further combined with a gray matter mask generated using FSL FAST. Caudate nucleus (CN), putamen (PT) and globus pallidus (GP) were extracted by co-registering individual QSM image to a group averaged QSM template with manual segmentation. The Biological Parametric Mapping (BPM) toolbox was used to estimate the voxel-based correlations between iron and β-amyloid load. Analysis was performed using robust Huber regression correcting for age, gender, APOE ε4 status. One-way T-tests were used to investigate potential correlations (FWE-corrected cluster-level p < 0.05 combined with an uncorrected voxel-level p < 0.001), with a cluster size threshold of 200 voxels. To estimate the impact of β-amyloid and iron on cognitive function in significant clusters, ridge regressions were used with a global cognitive composite score as outcome and age, gender, APOE ε4, years of education, β-amyloid load and iron load as predictors. Furthermore, multiple linear regression models, with cognitive scores (global composite and domain-specific cognition scores) as outcome, and age, gender, APOE ε4, years of education, volume, DVR and QSM as predictors, were used to test the effect of ROI-based β-amyloid and iron load on cognition. All analyses were performed in cognitively normal subjects (Model 1) and repeated excluding impaired but not MCI subjects (Model 2).Results
The BPM analysis resulted in 9 clusters of negative correlation (blue) and 3 clusters of positive correlation (red) between susceptibility and DVR (Fig.1(A)). Among the 9 clusters, two showed a negative association between susceptibility and the global cognitive composite score: frontal cortex [β=-0.126, p=0.020] and cingulate [β=-0.106, p=0.047] (Fig. 1(B)). Regarding Model 2, similar results were obtained (7 clusters showing a negative association between susceptibility and DVR, with two clusters in the frontal and temporal cortex showing negative associations between susceptibility and global cognitive composite score). The ROI-based analysis also revealed negative correlations between global cognitive performance and iron in SMF [β=-0.219, p=0.041], cingulate [β=-0.219, p=0.046] and GP [β=-0.264, p=0.015], while DVR did not show significant associations with cognition. For Model 2, negative correlations between cognition and iron were observed in all ROIs, except amygdala and ENT (Table 1). For domain-specific cognition, a negative correlation was observed in hippocampus [β=-0.239, p=0.048] between episodic memory and iron in Model 1, while the correlations for Model 2 were significant in all ROIs, except for amygdala and basal ganglia (Table 2). Negative associations between visuospatial processing score and iron were observed in hippocampus [β=-0.360, p=0.002] and GP [β=-0.257, p=0.012]; Similar results were found in Model 2 (Table 3). Language score and susceptibility were found negatively associated in ENT [β=-0.247, p=0.030] and GP [β=-0.281, p=0.008], additional negative correlations were also observed in CN for Model 2 (Table 4).Discussion and Conclusion
Among cognitively normal individuals, iron load in several brain regions was negatively associated with both amyloid-β deposition and global and domain-specific cognitive functions. This contrasts with the reported positive association between iron and amyloid-β among patients with MCI and dementia and their possible synergistic impairment on cognition6,7. Instead, the present study suggests that the impact of increased brain iron load on cognition in cognitively normal individuals may be related to other molecular changes known to occur during aging, beyond increased β-amyloid plaque load.Acknowledgements
Funding support: NCRR and NIBIB (P41 EB015909).References
[1] Viola KL, Klein WL. Amyloid beta oligomers in Alzheimer's disease pathogenesis, treatment, and diagnosis. Acta Neuropathol. 2015;129(2):183-206. [2] Acosta-Cabronero J, Williams GB, et al. In vivo quantitative susceptibility mapping (QSM) in Alzheimer's disease. PLoS One. 2013;8(11):e81093. [3] Kim HG, Park S, Rhee HY, et al. Quantitative susceptibility mapping to evaluate the early stage of Alzheimer's disease. Neuroimage Clin. 2017;16:429-438. [4] Lane DJR, Ayton S and Bush AI. Iron and Alzheimer's Disease: An update on emerging mechanisms. J. Alzheimers Dis. 2018;64(s1):S379-S395. [5] van Bergen JM, Li X, Hua J, et al. Colocalization of cerebral iron with Amyloid beta in Mild Cognitive Impairment. Sci. Rep. 2016;6:35514. [6] Ayton S, Fazlollahi A, Bourgeat P, et al. Cerebral quantitative susceptibility mapping predicts amyloid-beta-related cognitive decline. Brain 2017;140(8):2112-2119. [7] van Bergen JMG, Li X, Quevenco FC, et al. Simultaneous quantitative susceptibility mapping and Flutemetamol-PET suggests local correlation of iron and beta-amyloid as an indicator of cognitive performance at high age. Neuroimage 2018;174:308-316. [8] Albert M, Soldan A, Gottesman R, et al. Cognitive changes preceding clinical symptom onset of mild cognitive impairment and relationship to ApoE genotype. Curr. Alzheimer Res. 2014;11(8):773-784. [9] Soldan A, Pettigrew C, Cai Q, et al. Cognitive reserve and long-term change in cognition in aging and preclinical Alzheimer's disease. Neurobiol. Aging 2017;60:164-172. [10] Albert M, Dekosky S, Dickson D, et al. The diagnosis of mild cognitive impairment due to Alzheimer's disease: recommendations from the National Institute on Aging-Alzheimer's Association workgroups on diagnostic guidelines for Alzheimer's disease. Alzheimers Dement. 2011; 7(3):270-279. [11] Abdul-Rahman HS, Gdeisat MA, Burton DR, et al. Fast and robust three-dimensional best path phase unwrapping algorithm. Appl Opt 2007;46(26):6623-6635. [12] Schweser F, Deistung A, Lehr BW, et al. Quantitative imaging of intrinsic magnetic tissue properties using MRI signal phase: an approach to in vivo brain iron metabolism? Neuroimage 2011;54(4):2789-2807. [13] Bao L, Li X, et al. Quantitative susceptibility mapping using structural feature based collaborative reconstruction (SFCR) in the human brain. IEEE Trans Med Imaging 2016;35(9):2040-2050. [14] Zhou Y, Resnick SM, Ye W, et al. Using a reference tissue model with spatial constraint to quantify [11C]Pittsburgh compound B PET for early diagnosis of Alzheimer's disease. Neuroimage 2007;36(2):298-312.Figures
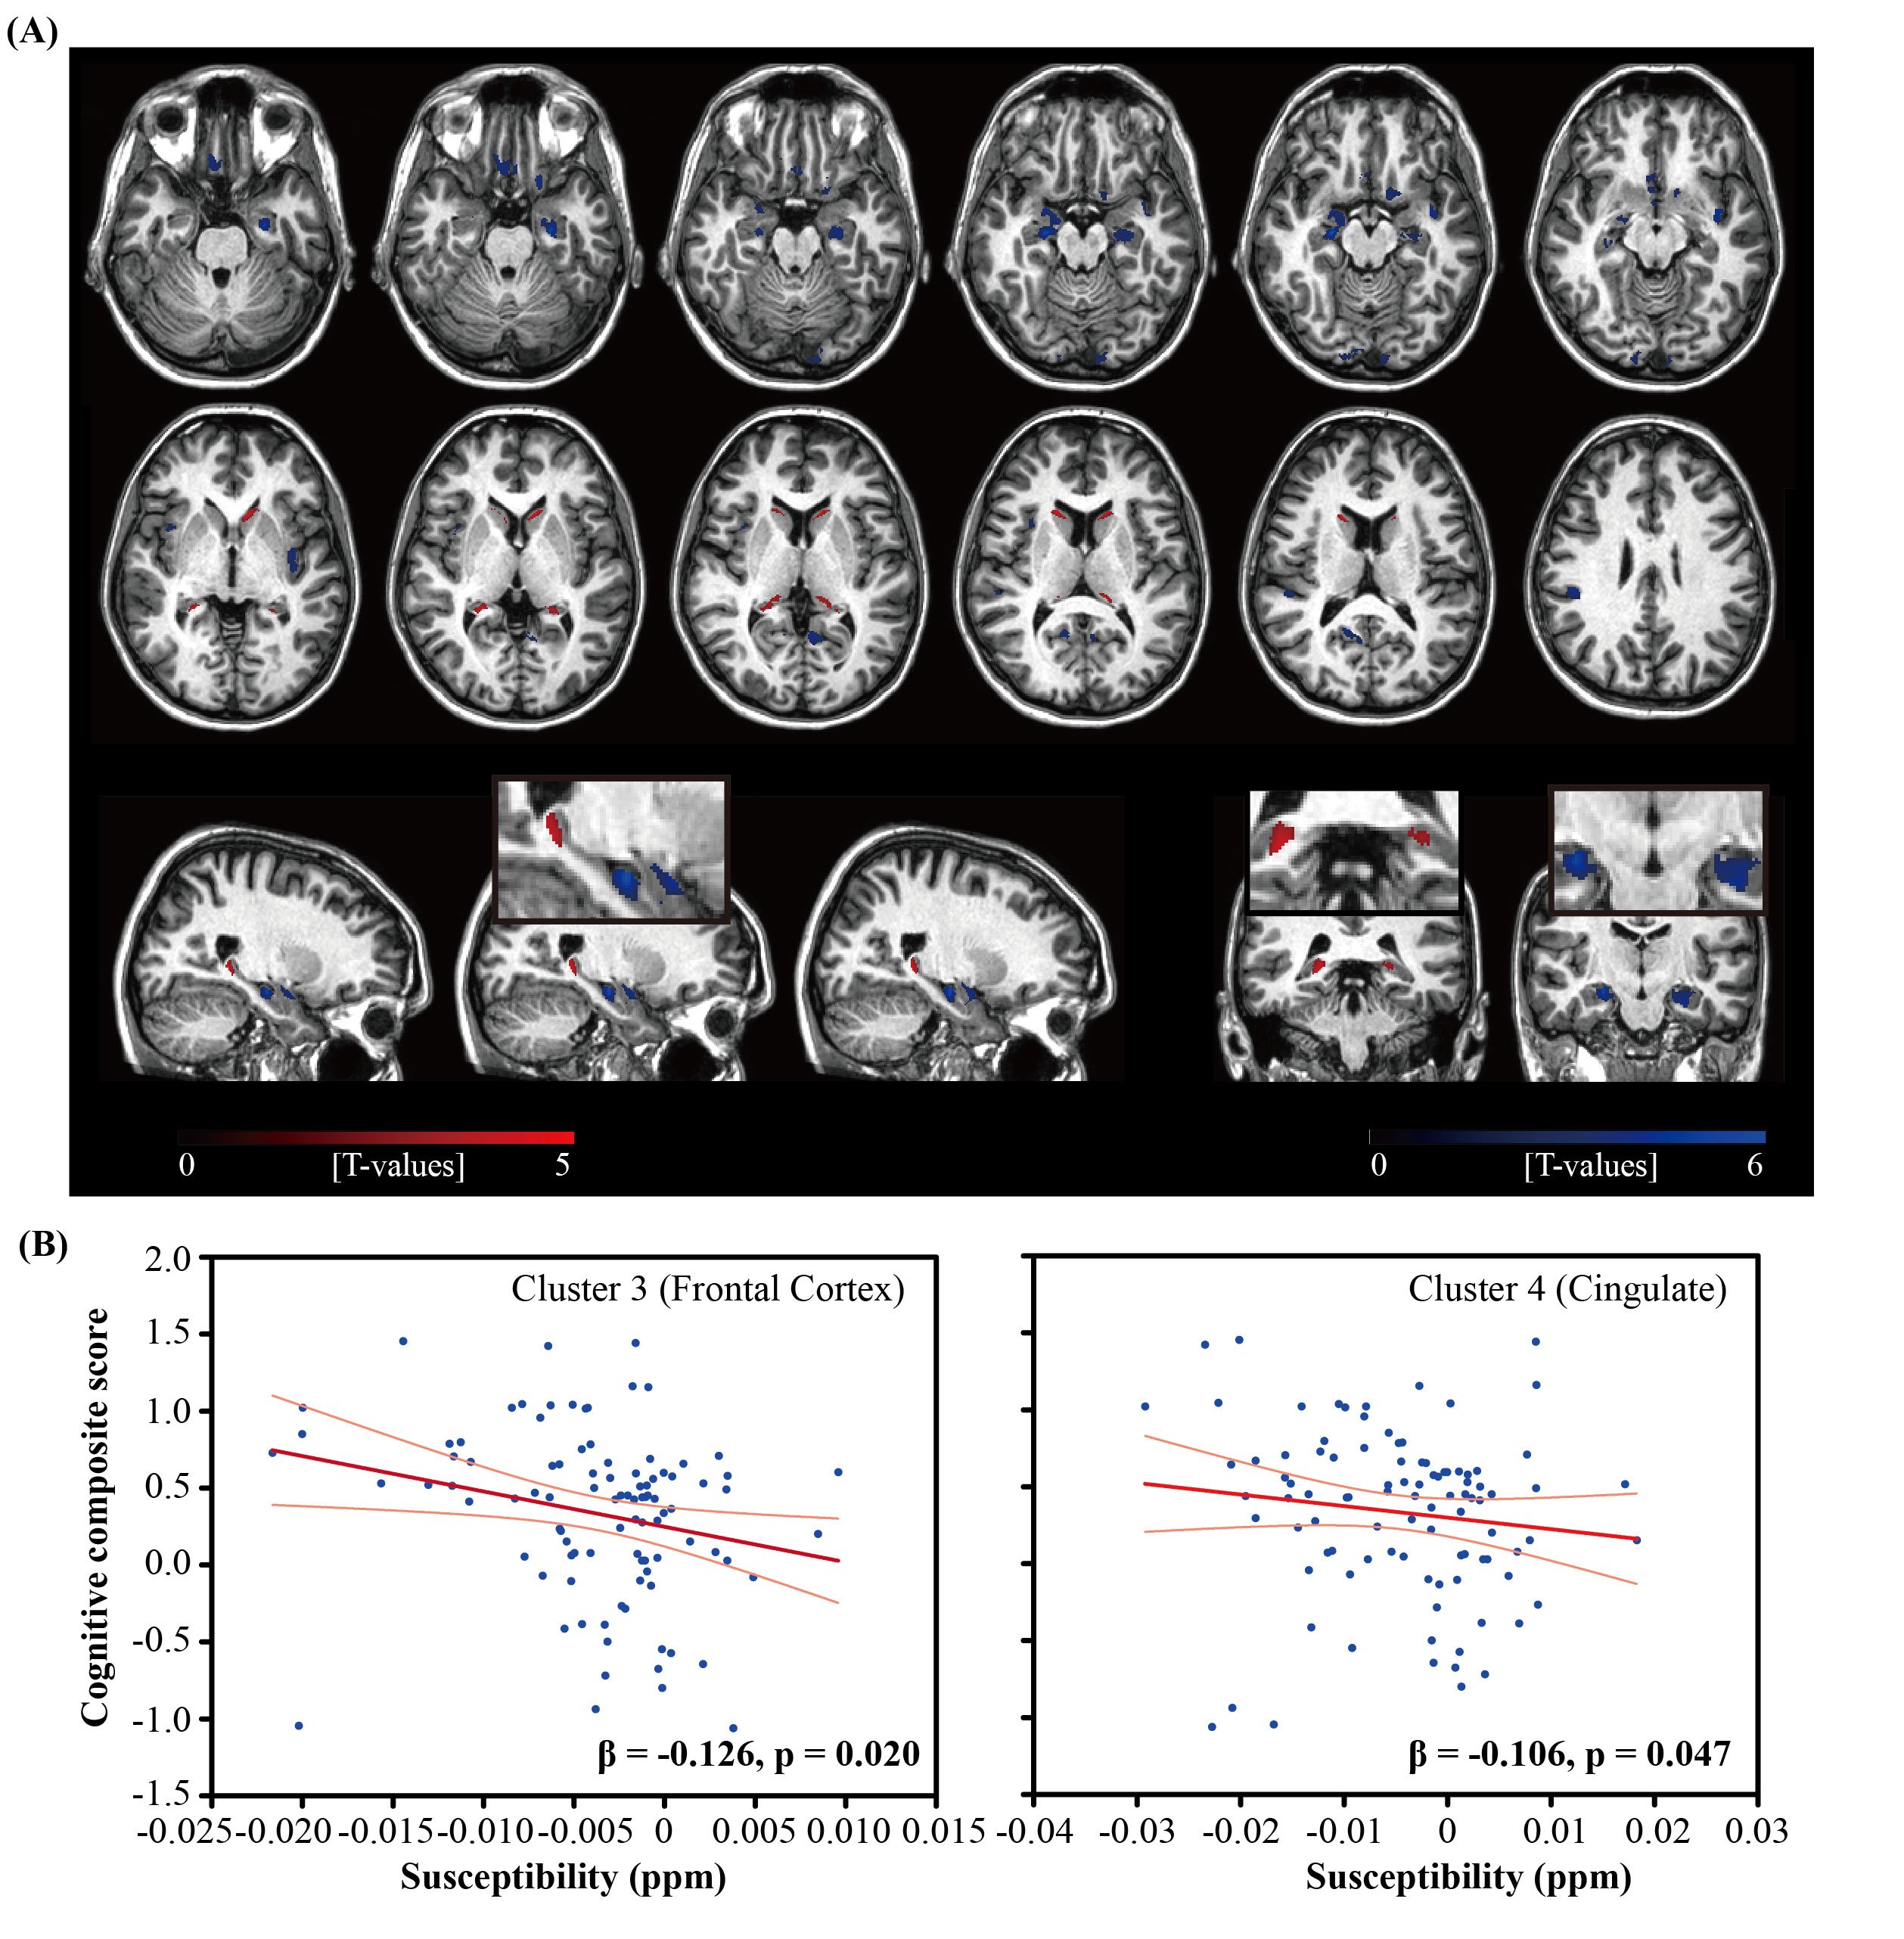
Figure 1. (A) Overlay of regions with significant
positive (red) or negative (blue) correlation between iron load (QSM) and β-amyloid plaque load (DVR) (B) Scatter plot of the global cognitive
composite score and susceptibility values in two selected clusters in Frontal
Cortex and Cingulate, respectively, where negative correlations between
susceptibility and DVR were observed. The light red line represents 95%
confidence.
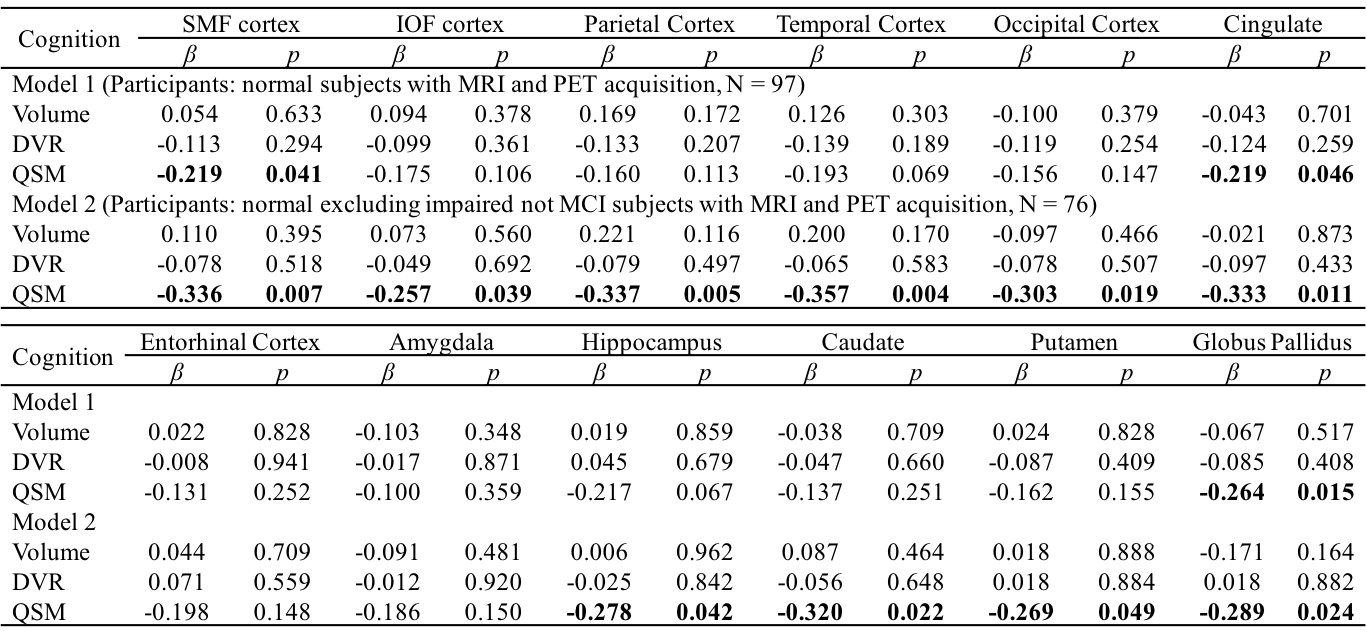
Table 1 Multiple linear regression with global cognitive composite score as outcome
and age, gender, APOE ε4 status, years of education,
regional volume, β-amyloid
plaque load and iron load in atlas defined ROIs as predictors of all normal subjects (N = 97, model 1), normal
excluding impaired but not MCI subjects (N = 76, model 2). Statistically
significant p-values are shown in bold. SMF: superior middle frontal; IOF:
inferior orbital frontal.
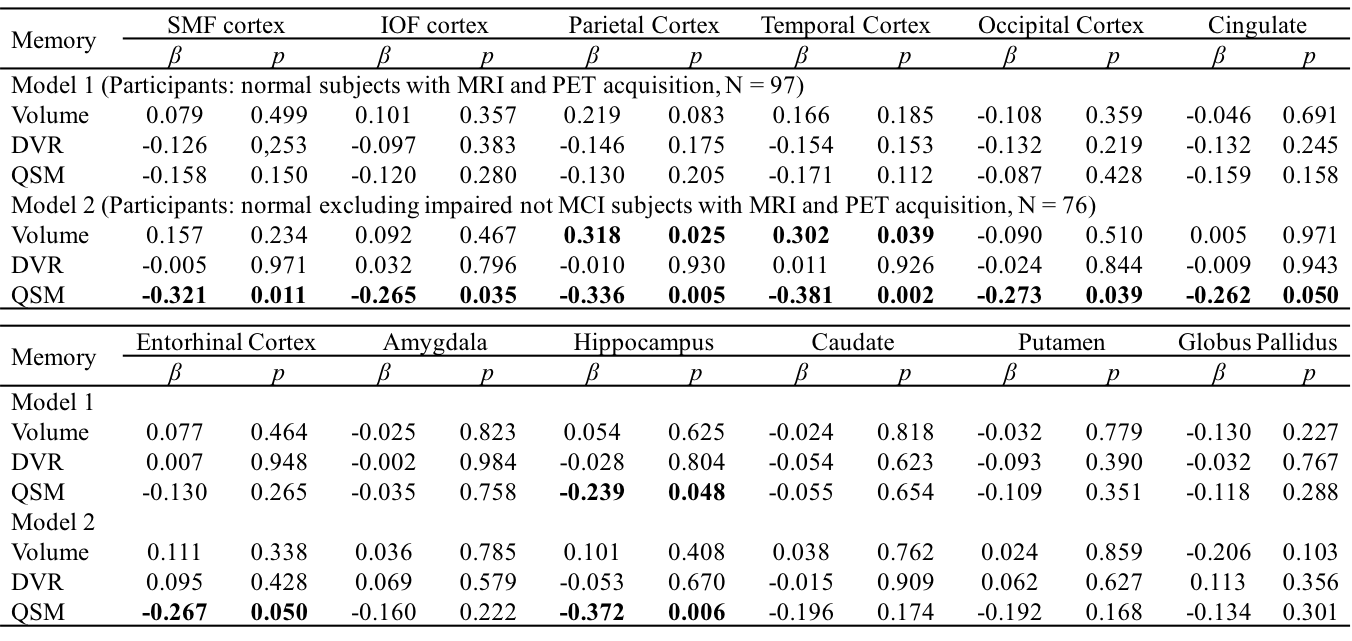
Table 2 Multiple linear regression with episodic memory score as
outcome and age, gender, APOE ε4 status, years of education,
regional volume, β-amyloid
plaque load and iron load in atlas defined ROIs as predictors of all normal subjects (N = 97, model 1), normal
excluding impaired not MCI subjects (N = 76, model 2). Statistically
significant p-values are shown in bold.
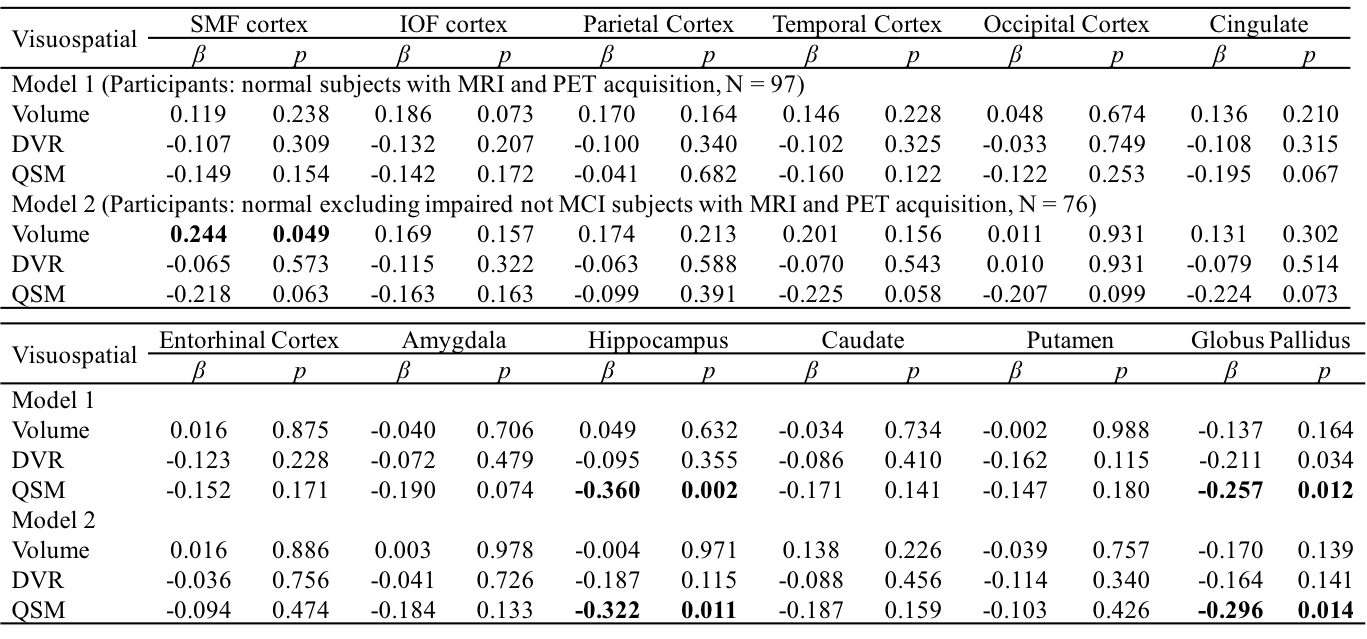
Table 3 Multiple linear regression with visuospatial score as outcome
and age, gender, APOE ε4 status, years of education,
regional volume, β-amyloid
plaque load and iron load in atlas defined ROIs as predictors of all normal subjects (N = 97, model 1), normal
excluding impaired not MCI subjects (N = 76, model 2). Statistically
significant p-values are shown in bold.
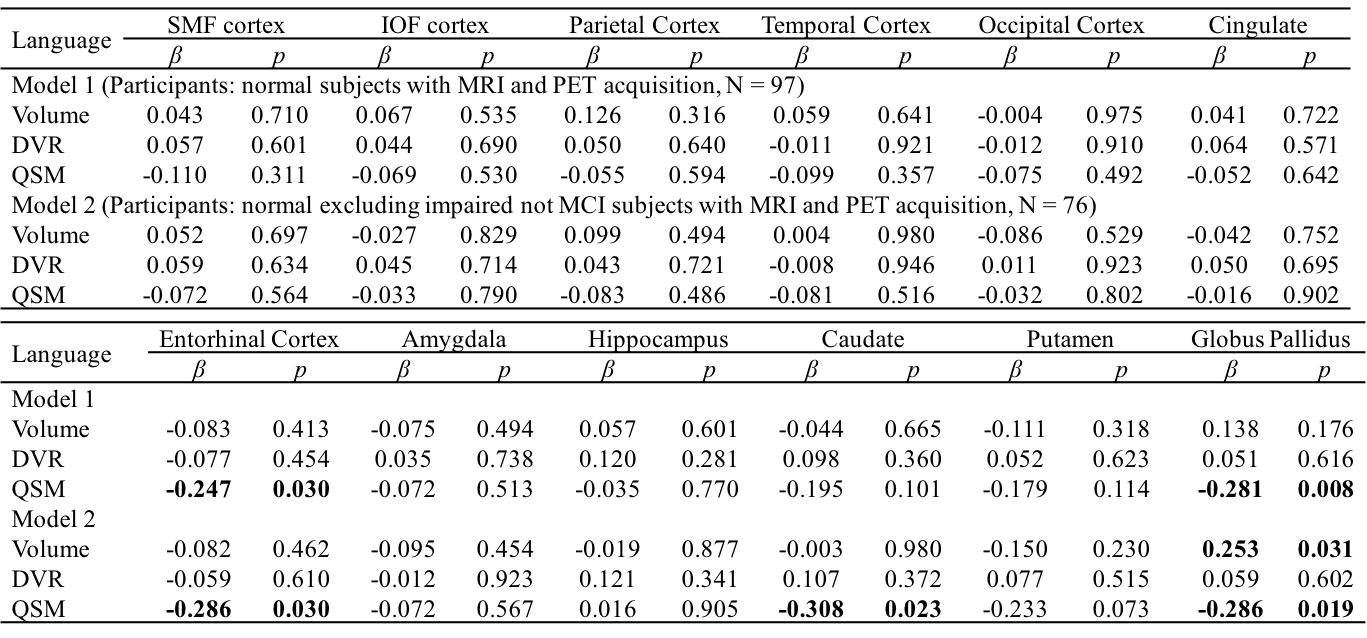
Table 4 Multiple linear regression with language score as outcome and
age, gender, APOE ε4 status, years of education,
regional volume, β-amyloid
plaque load and iron load in atlas defined ROIs as predictors of all normal subjects (N = 97, model 1), normal
excluding impaired not MCI subjects (N = 76, model 2). Statistically
significant p-values are shown in bold.