3209
Highly Accelerated Compressed-Sensing-Based Field-mapping is Possible for Body QSM Applications1TUM, Munich, Germany, 2Stanford University, Stanford, CA, United States, 3Division of Infectious Diseases and Tropical Medicine, University Hospital, LMU, Munich, Germany, 4Philips Research, Hamburg, Germany
Synopsis
Body QSM relies on accurate magnetic field-mapping that particularly accounts for the presence of fat. Due to the need to account for T2* effects and perform water–fat separation, water–fat-imaging-based field-mapping typically acquires multiple echoes with appropriate echo time step, increasing the total required scan time especially for high-resolution body QSM. To reduce scan time, several acceleration schemes have been proposed, such as parallel imaging and compressed sensing (CS). This work demonstrates the feasibility of high CS acceleration factors to distinguish strong para- and diamagnetic susceptibility sources in body regions with CS acceleration factors of 10 and higher.
Introduction
QSM is an established method to study brain physiology (1), pathology (2) and function (3). QSM has also gained popularity in applications outside the brain, e.g. for measuring cartilage (4), organ microstructure (5) and bone density (6, 7). For body applications, the QSM processing needs to address the presence of fat with its chemical shift effect. Due to the need to account for $$$T_2^*$$$ decay effects and perform water-fat separation, water-fat-imaging-based field-mapping typically acquires multiple echoes with appropriate echo time step, increasing the total required scan time for high-resolution body QSM. To reduce scan time several acceleration schemes have been proposed, such as parallel imaging (8, 9) and compressed sensing (CS) (10). Compressed sensing has been demonstrated to be feasible to significantly accelerate data acquisition for quantitative susceptibility mapping (QSM) in water only regions (11). Compressed sensing has also been demonstrated to be feasible to accelerate water–fat imaging (12, 13). However, the accuracy of the non-linear and non-convex field-map parameter in the water–fat signal model in CS reconstruction and subsequently performed QSM has yet to be investigated. The purpose of this work is therefore to investigate the feasibility of high CS acceleration factors for body QSM.Methods
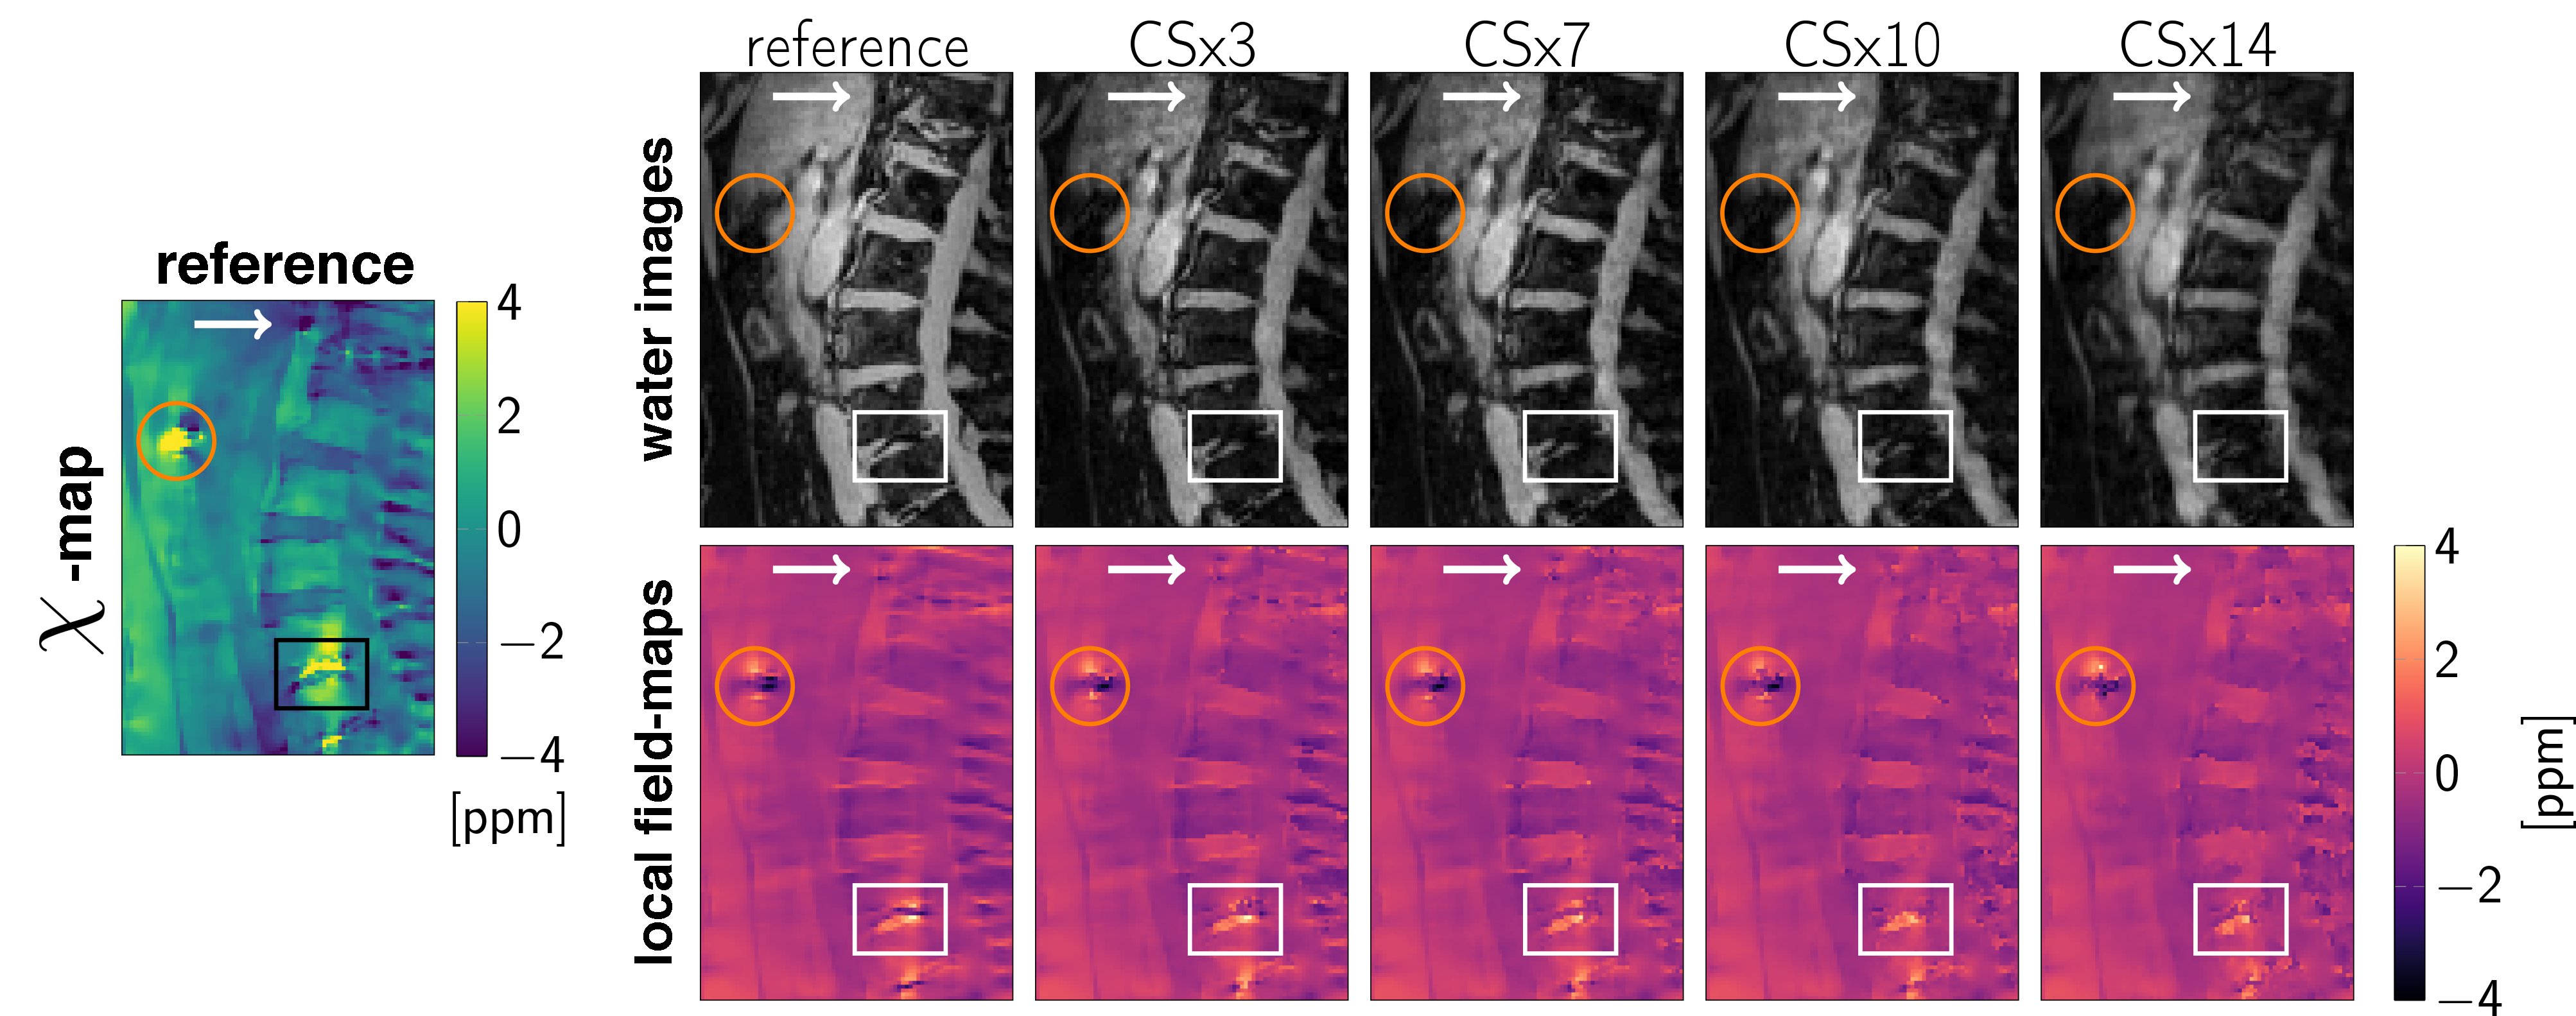
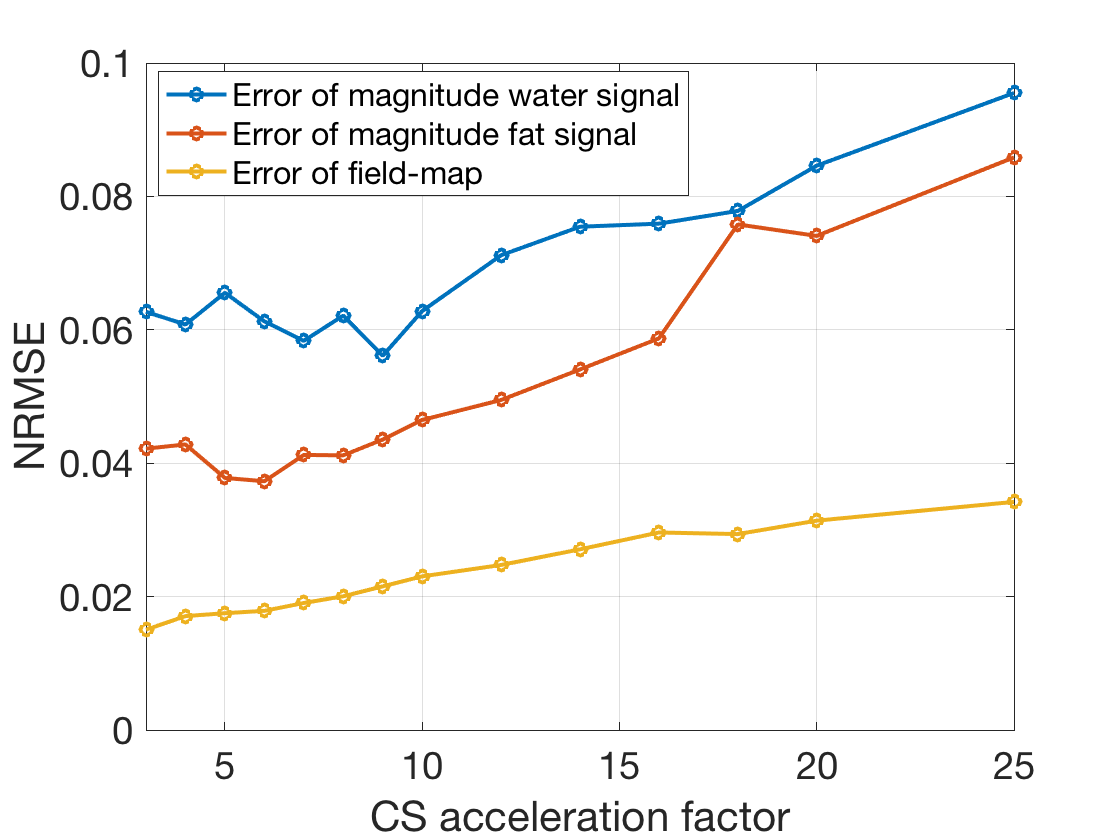
SimulationFor the estimation of the error evolution with increasing CS acceleration factors a simulation based on in-vivo data was set up. A scan of a spine with degenerative disease including an intradiscal air inclusion and a vascular calcification was used. Field-mapping and water–fat separation was performed using a single-min-cut graph-cut algorithm (14, 15). The background field was removed using the Laplacian boundary value method (LBV) (16). With the water- and fat-image $$$\rho_W,\rho_F$$$, a shared relaxation $$$R_2^*$$$-map and the local tissue field $$$f_B$$$, the complex signal at the $$$n$$$-th echo was forward simulated using the well-established water–fat voxel signal model:$$s_{\text{model}}(t_n)=\left(\rho_W+c_n\rho_F\right)e^{(i2\pi{f_B}-R_2^*)t_n},\quad{c_n}=\sum_{p=1}^{P}a_pe^{i2\pi\Delta{f_p}t_n},\quad\text{with}\quad\sum_{p=1}^{P} a_p=1.$$A fat spectrum with $$$P=10$$$ peaks specific to bone marrow with relative amplitudes $$$a_p$$$ and chemical shifts $$$\Delta f_p$$$ was used (17). On the echo data the undersampling pattern provided in the vendor’s k-space undersampling routines was applied to obtain the same undersampling pattern as an actual scan (Ingenia Elition, Philips Healthcare, Release 5.4, Best, The Netherlands). The compressed sensing reconstruction was performed using the BART-toolbox (18). The reconstructed images were separated into field-map and water–fat images and the normalized root mean square error (NRMSE) to the reference was measured.
In-vivo
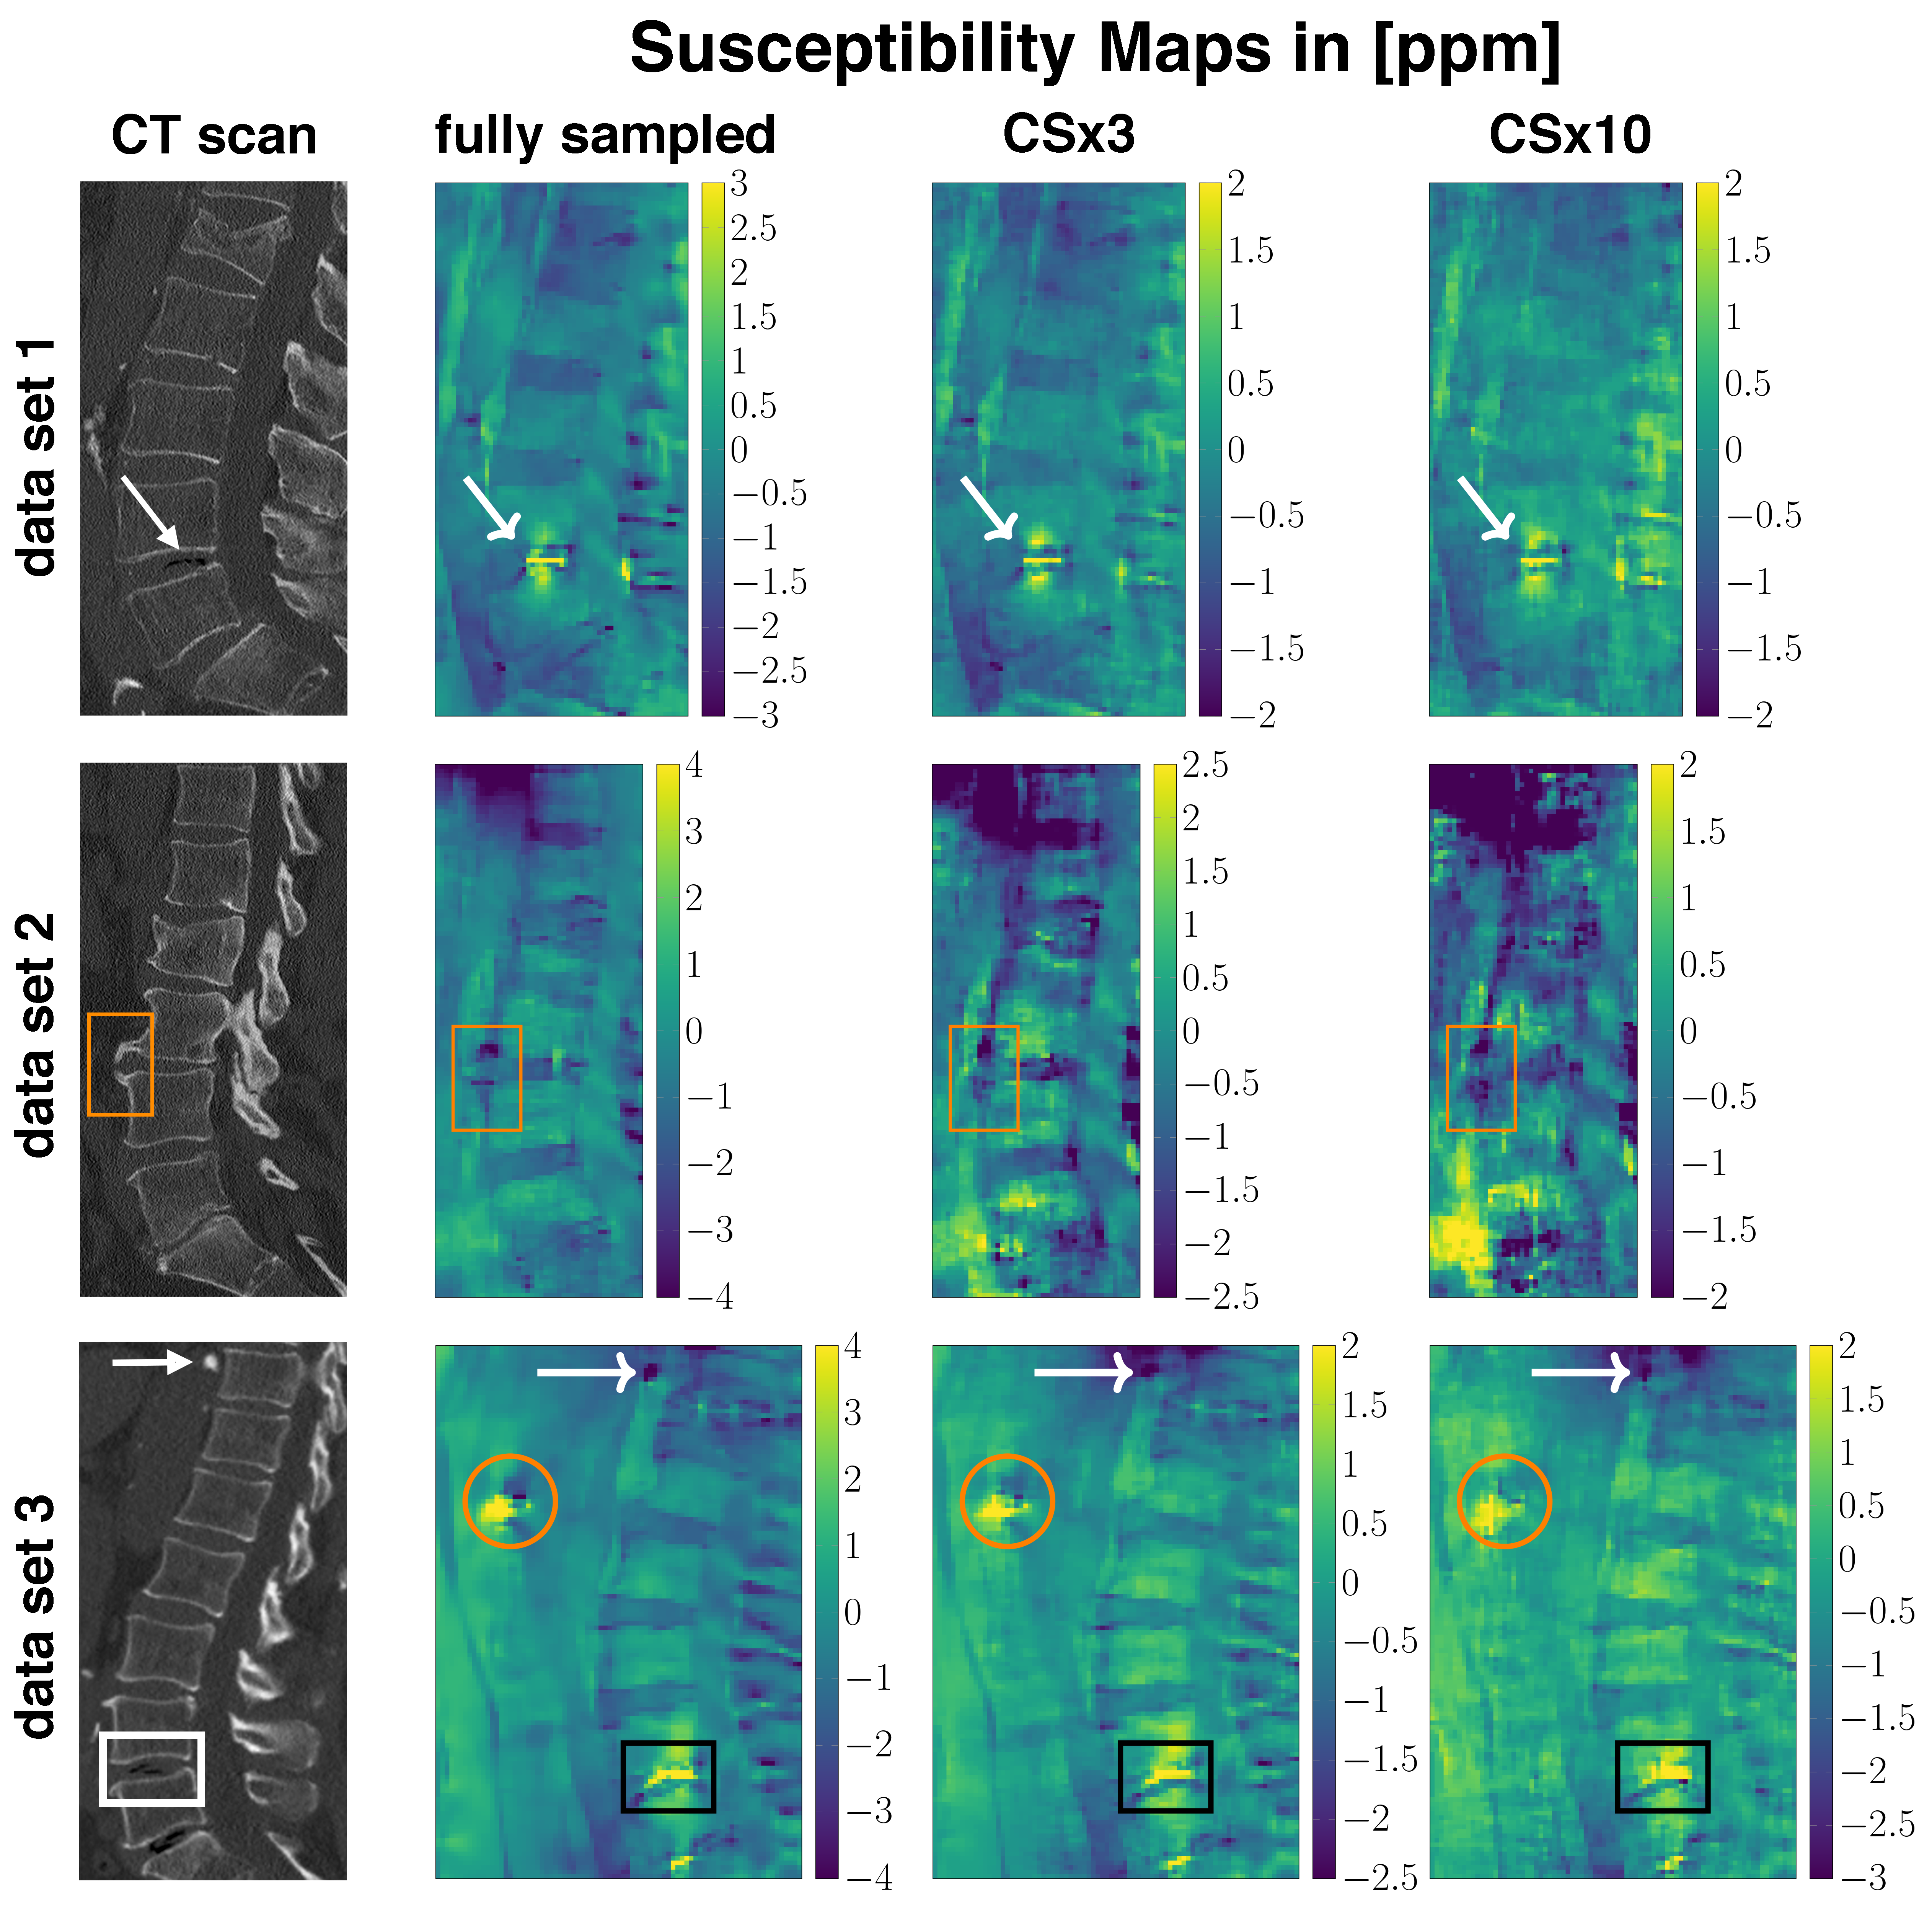
Three aged spine data sets with abnormalities such as intradiscal air-inclusions and osteophytes were scanned using a monopolar time-interleaved multiecho gradient echo sequence, acquiring 3 echoes per interleave and TR and 6 echoes in total. Scanning was performed on a 3$$$\:$$$T scanner (Ingenia, Philips Healthcare, Release 5.4, Best, The Netherlands). The imaging parameters were set to TE$$$_{\text{min}}=1.33\:$$$ms, $$$\Delta$$$TE$$$=1.05\:$$$ms, orientation = sagittal, readout direction = anterior-posterior, FOV = $$$220\times 220\times79.2\:$$$mm$$$^3$$$ and acquisition voxel size = $$$1.8\:$$$mm$$$^3$$$ isotropic. The CS undersampling pattern provided by the vendor was applied and reconstructed with the BART-toolbox for each data set. Field-mapping was performed using the above mentioned graph-cut algorithm. The background field was removed using LBV. For the field-to-susceptibility inversion the following $$$\ell_1$$$-regularized cost-function was minimized:$$\chi(\mathbf{r})=\underset{\chi'}{\arg\min}\big|\big|\text{w}(f_{B}-d*\chi')\big|\big|_2^2+\lambda\big|\big|\nabla\chi'\big|\big|_1,$$where the maximum intensity projection over echo times was set as the weighting factor w, $$$d$$$ is the dipole kernel and the regularization factor $$$\lambda{=}0.002$$$ for all CS acceleration factors.
Results
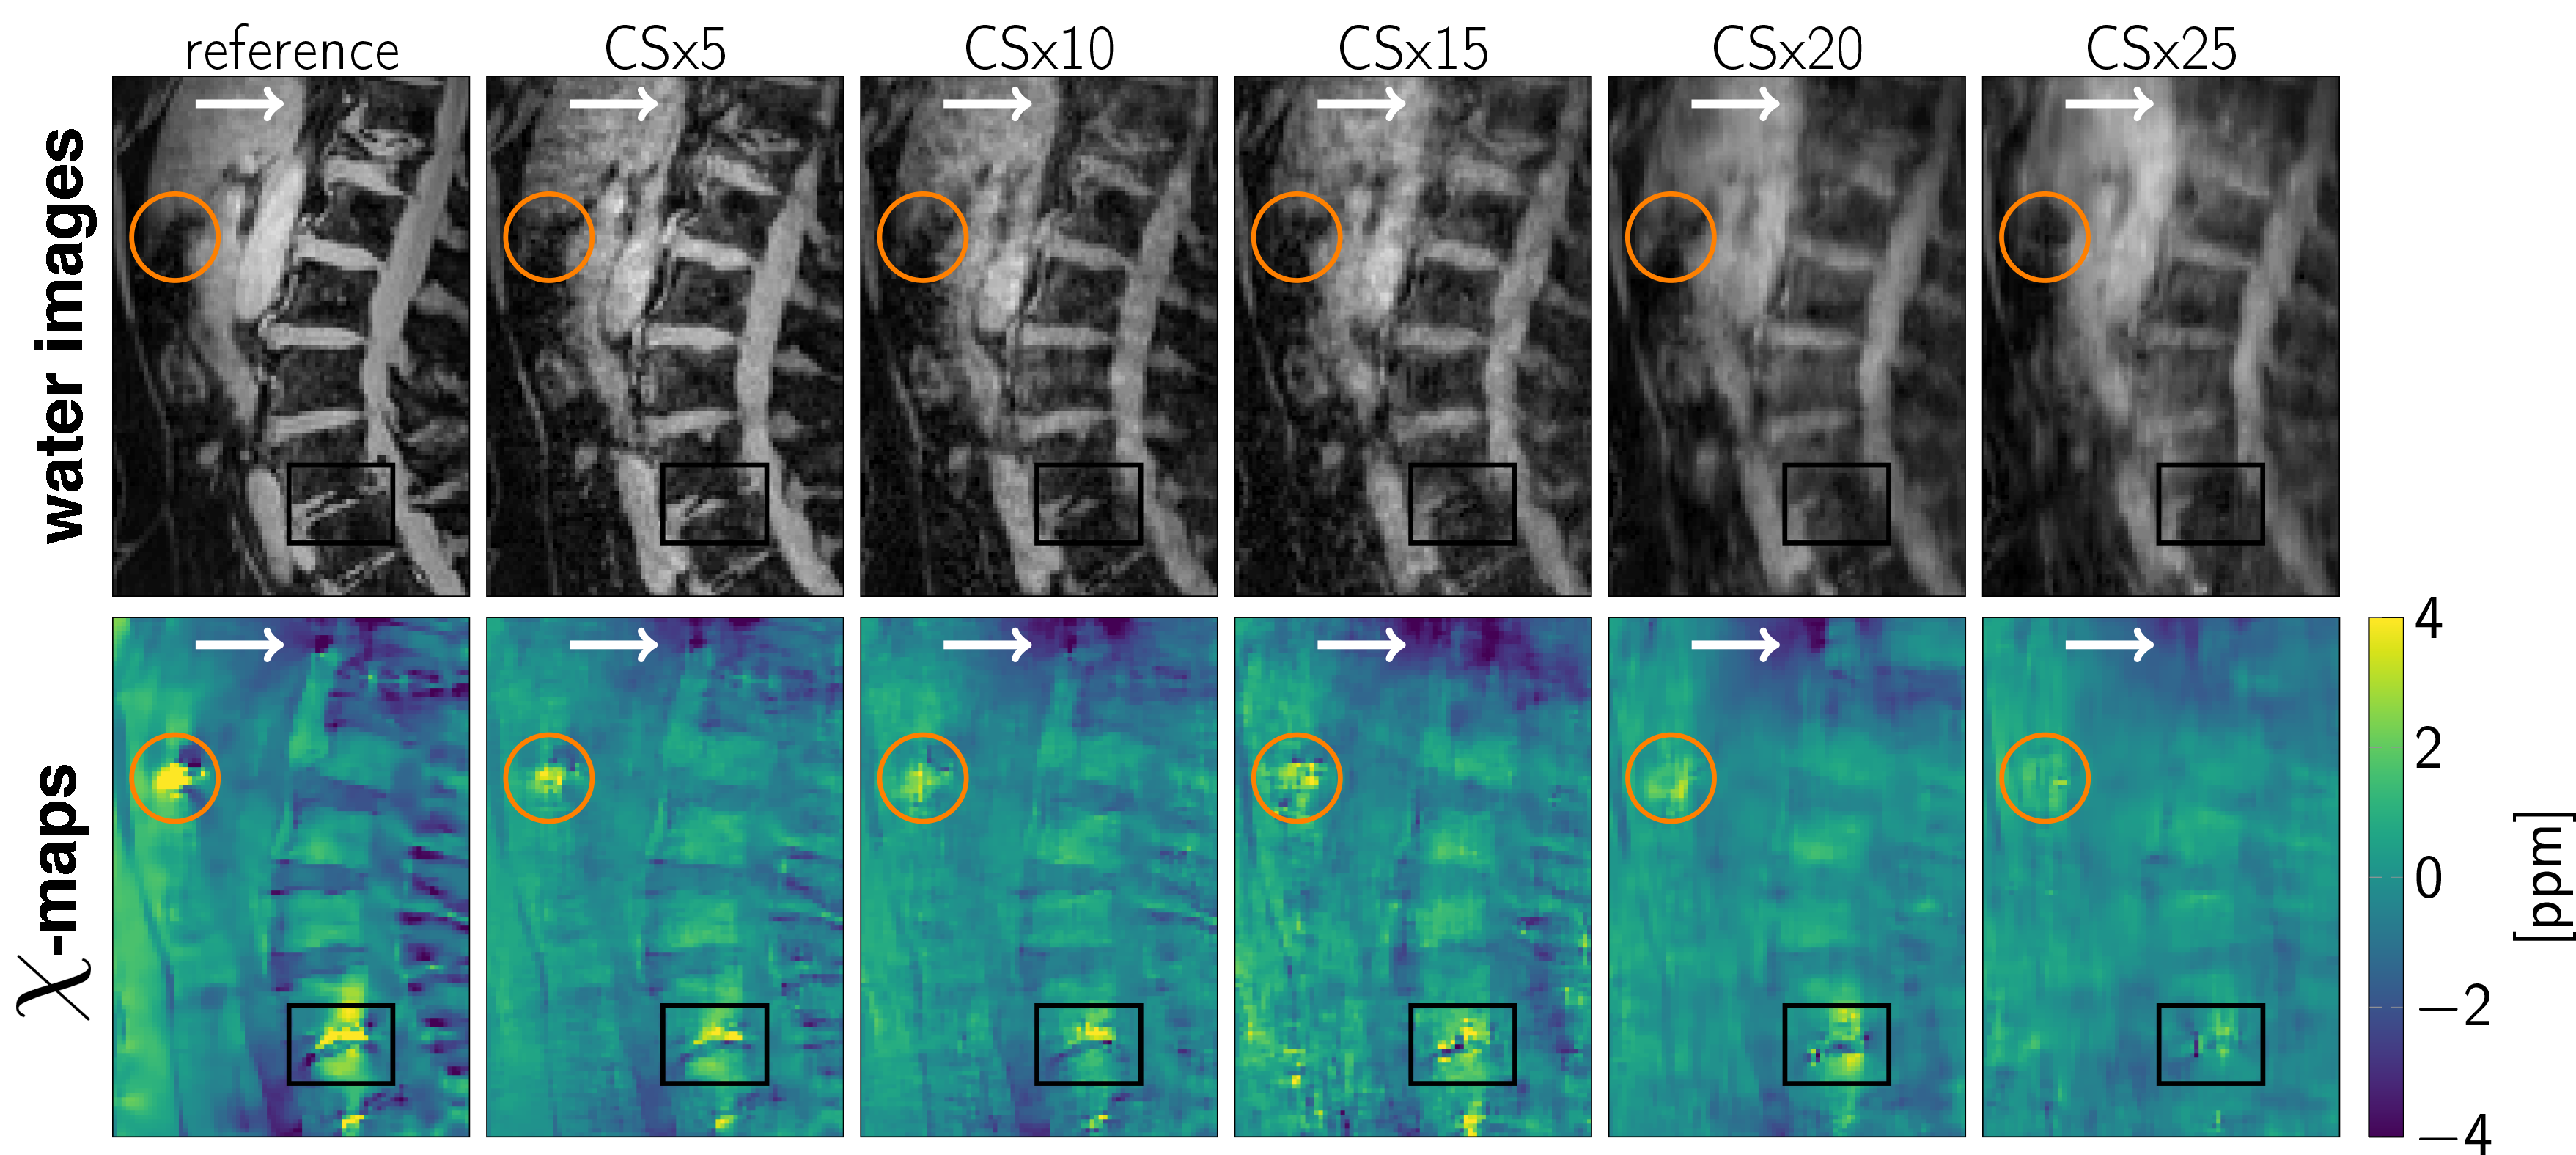
The error and its slope of the non-linear local field-map term in the water–fat signal model is significantly smaller than of the magnitude water and fat images, as shown in Figures 1 and 2. CS-accelerated QSM can distinguish a paramagnetic air-inclusion from a diamagnetic vascular calcification in a spine with an acceleration factor from up to 20, as shown in Figure 3. High CS acceleration factors are feasible for different subjects with pathologies such as intradiscal air inclusions and osteophytes (calcified bone regions) as shown in Figure 4.Discussion & Conclusion
The local field-map and consequently the information of susceptibility sources within the water–fat voxel signal model is shown to be a more stable parameter than magnitude water and fat images within compressed sensing reconstruction. Multi-echo data are multi-dimensional data and the extraction of the water–fat-fieldmap parameters should in general benefit from the multi-dimensionality of the data when applying CS techniques. However, in addition the local field-maps and $$$\chi$$$-maps in the body seem to be driven primarily by regions with large susceptibility differences, include less high-resolution information than water-images and could thus tolerate higher CS acceleration factors.In this work high acceleration factors greater than 10 are shown to be feasible to correctly distinguish between para- and diamagnetic body structures located in regions with no MR visible signals (calcifications and air inclusions).
Acknowledgements
The present work was supported by the European Research Council (grant agreement No 677661, Pro-FatMRI). This work reflects only the authors view and the EU is not responsible for any use that may be made of the information it contains. The authors acknowledge finally research support from Philips Healthcare.References
[1] Liu C, Li W, Tong KA, Yeom KW, Kuzminski S. Susceptibility-weighted imaging and quantitative susceptibility mapping in the brain. Journal of Magnetic Resonance Imaging 2014; 42:23–41.
[2] EskreisWinkler S, Zhang Y, Zhang J, Liu Z, Dimov A, Gupta A, Wang Y. The clinical utility of qsm: Disease diagnosis, medical management, and surgical planning. NMR in Biomedicine 2016; 30:e3668.
[3] Sun H, Seres P, Wilman A. Structural and functional quantitative susceptibility mapping from standard fmri studies. NMR in Biomedicine 2016; 30:e3619.
[4] Wei H, Decker K, Zhang Y, Liu C. Magnetic Susceptibility Anisotropy of Collagen Fibrils in the Articular Cartilage. In: Proceedings 25. Annual Meeting International Society for Magnetic Resonance in Medicine, Honolulu, Hawaii, 2017. p. 1210.
[5] Dibb R, Liu C. Joint eigenvector estimation from mutually anisotropic tensors improves susceptibility tensor imaging of the brain, kidney, and heart. Magnetic Resonance in Medicine 2016; 77:2331–2346.
[6] Diefenbach MN, Meineke J, Ruschke S, Baum T, Gersing A, Karampinos DC. On the sensitivity of quantitative susceptibility mapping for measuring trabecular bone density. Magnetic Resonance in Medicine 2018.
[7] Dimov AV, Liu Z, Spincemaille P, Prince MR, Du J, Wang Y. Bone quantitative susceptibility mapping using a chemical species-specific r2* signal model with ultrashort and conventional echo data. Magnetic Resonance in Medicine 2017; 79:121–128.
[8] Pruessmann KP, Weiger M, Scheidegger MB, Boesiger P. Sense: Sensitivity encoding for fast mri. Magnetic Resonance in Medicine 1999; 42:952–962.
[9] Griswold MA, Jakob PM, Heidemann RM, Nittka M, Jellus V, Wang J, Kiefer B, Haase A. Generalized autocalibrating partially parallel acquisitions (grappa). Magnetic Resonance in Medicine 2002; 47:1202–1210.
[10] Lustig M, Donoho D, Santos J, Pauly J. Compressed sensing mri. IEEE Signal Processing Magazine 2008; 25:72–82.
[11] Wang N, Cofer G, Anderson RJ, Qi Y, Liu C, Johnson GA. Accelerating quantitative susceptibility imaging acquisition using compressed sensing. Physics in Medicine & Biology 2018; 63:245002.
[12] Doneva M, Börnert P, Eggers H, Mertins A, Pauly J, Lustig M. Compressed sensing for chemical shift-based water–fat separation. Magnetic Resonance in Medicine 2010; 64:1749– 1759.
[13] Sharma SD, Hu HH, Nayak KS. Accelerated water–fat imaging using restricted subspace field map estimation and compressed sensing. Magnetic Resonance in Medicine 2011; 67:650–659.
[14] Böhm C, Diefenbach MN, Haase A, Karampinos DC. Accelerated Single-Min-Cut Graph-Cut Algorithm Using a Variable-Layer Graph Construction Improves Field-Mapping in Water–Fat Regions. In: Proceedings 27. Annual Meeting International Society for Magnetic Resonance in Medicine, Montreal, Canada, 2019. p. 4007. Digital Poster.
[15] Böhm C, Diefenbach MN, Meineke J, Haase A, Karampinos DC. Improved Body Quantitative Susceptibility Mapping by Using a Variable- Layer Single-Min-Cut Graph-Cut Algorithm for Field-Mapping. In: 5th International Workshop on MRI Phase Contrast & QSM, Seoul, Korea, 2019. p. 81.
[16] Zhou D, Liu T, Spincemaille P, Wang Y. Background field removal by solving the laplacian boundary value problem. NMR in Biomedicine 2014; 27:312–319.
[17] Ren J, Dimitrov I, Sherry AD, Malloy CR. Composition of adipose tissue and marrow fat in humans by1h nmr at 7 tesla. Journal of Lipid Research 2008; 49:2055–2062.
[18] Uecker M, Tamir J. mrirecon/bart: version 0.5.00, 2019. 4
Figures