3208
Use of high-resolution QSM to identify global patterns in the ex vivo human brain cortex at 7T1A. A. Martinos Center for Biomedical Imaging, Massachusetts General Hospital, Boston, MA, United States, 2Harvard Medical School, Cambridge, MA, United States, 3Harvard-MIT Division of Health Sciences and Technology, Boston, MA, United States
Synopsis
Quantitative susceptibility mapping (QSM) can reflect the iron and myelin concentration within human brain tissue. Ex vivo MRI can allow us to study the cortical laminar structure at high-resolution. Here we conduct a study to combine the two, that is to analyze QSM maps of an ex vivo human brain cortex at 500um and 150um resolution. Our analysis shows matching global patterns of positive susceptibility at the gray-white boundary for both resolutions that were validated with iron-stain on a tissue-block. We find visual cortex, and localized regions of parietal and frontal lobe to contain the highest concentration of positive susceptibility.
Introduction
Quantitative Susceptibility Mapping (QSM) has been shown to reflect varying iron and myelin content within human brain tissue, particularly with respect to cortical laminar architecture 1-2. Subtle magnetic susceptibility variations within the tissue accrue to the MRI phase and can be quantified by QSM methods through deconvolving the phase signal 3-5. In vivo studies have reported observing susceptibility changes along the cortical ribbon but are limited in resolution due to constraints on acquisition time. Several high resolution (20 – 500um) ex vivo studies have reported observing iron near the gray-white matter boundary of the cortex but have mainly been limited to blocked sections 6,7.In this study, we first bridge the gap between the two by estimating QSM in an ex vivo human brain hemisphere at 500um resolution and present the global patterns we observe. Next, we increase the resolution to 150um isotropic (a scale which allows infra- and supra-granular layers to become visible) and present a preliminary QSM map estimated in this SNR-starved setting. Here we are interested in analyzing if these patterns change with resolution and evaluate if the current methods can survive at low SNR.
Methods
Ex vivo MRI data was collected on a whole human hemisphere, using a Magnetom 7T scanner (Siemens) and a custom 32 channel ex vivo coil 8. A 500um multiecho GRE scan was acquired (TR = 24ms, TE = 5/10/15/20ms , FA=20o), and ASPIRE method 9 was used to combine phase from different coils. The phase was unwrapped using Laplacian 10 transform and background phase was removed using a harmonic filter 11. QSM mapping was calculated from the phase using the nonlinear dipole inversion (NDI)4 approach, which deconvolves the susceptibility from the phase using a magnitude weighting based regularization and a nonlinear formulation using gradient descent.The same QSM estimation was repeated for the 150um isotropic multiecho GRE acquisition for the same hemisphere (TR = 34ms, TE = 5.65/11.95/18.25/24.55ms, FA=20o) with the exception that coils were combined using the traditional Hermitian inner product 12 approach.
To validate that the susceptibility we observe is from iron, an area from the prefrontal cortex was blocked for histology. 4um thick slices were stained for ferric iron using a 3,3’-diaminobenzidine (DAB) enhanced Perl’s stain13,14. To improve sensitivity, the incubation time and temperature of the 20% HCL/10% potassium ferrocyanide treatment step were increased to 2hr at 37oC 15.
Results
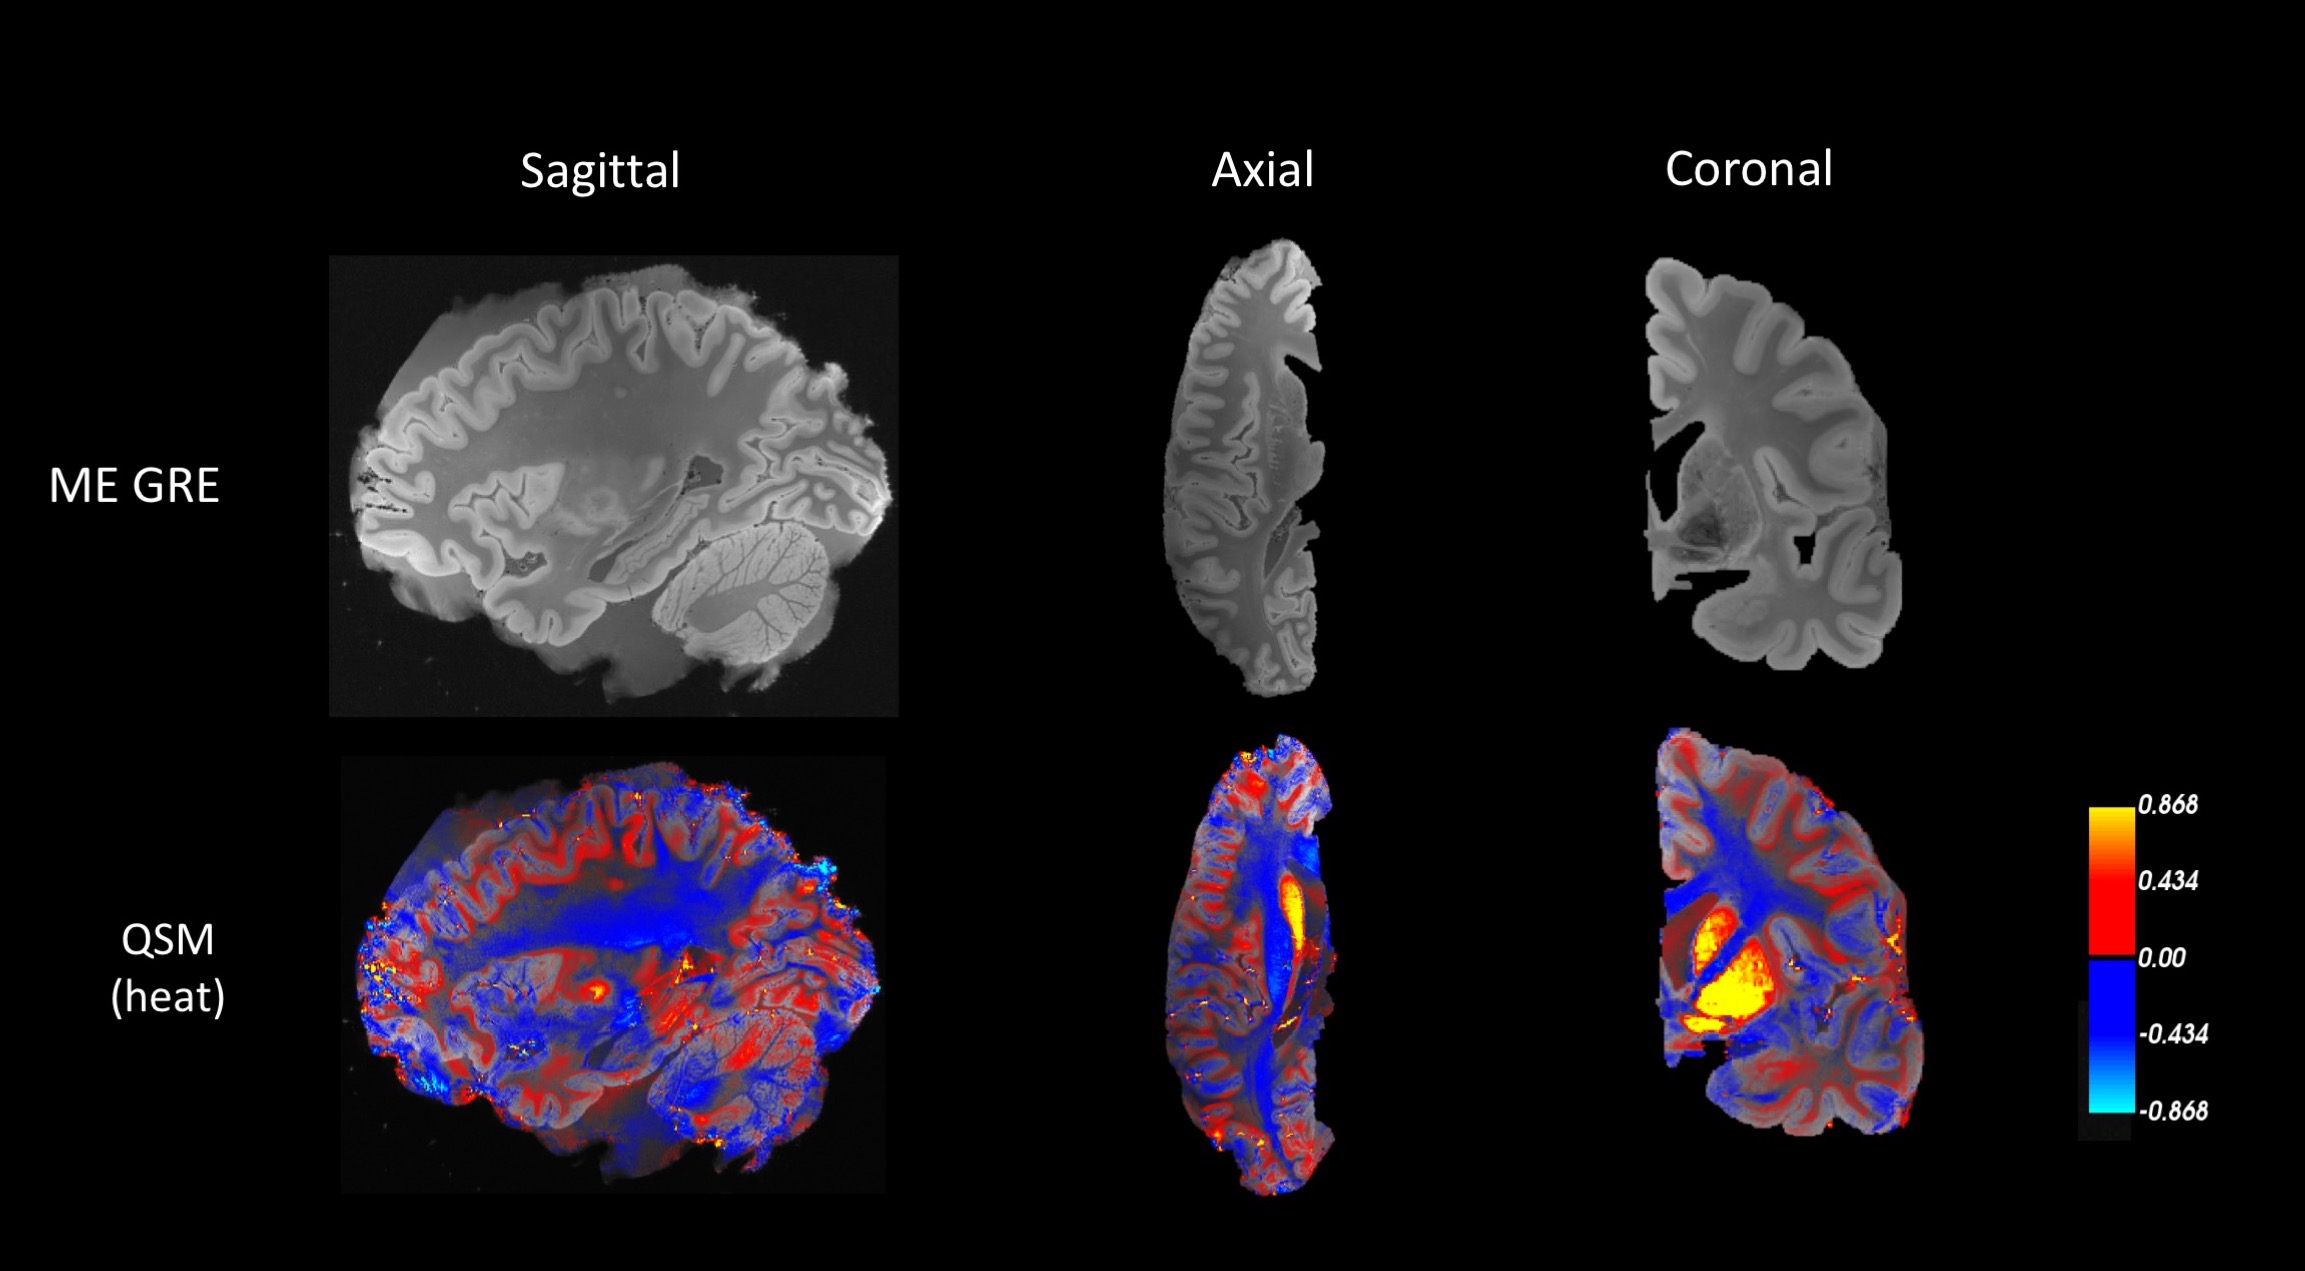
Fig.1 shows the first echo magnitude of the 500um MRI data alongside the QSM results displayed as a heat map. We see consistent patterns of positive susceptibility along the cortical ribbon suggesting potential iron concentration. This observation is consistent with earlier ex vivo studies validating the presence of iron at gray-white boundaries in the visual, motor and somatosensory cortex 16 and the superior parietal lobe 16,6.Fig.2 indicates the blocked section on the coronal slice from Figure 1. The four images above show the 500um MRI data, QSM, iron-stained histology and tissue block. The susceptibility map and iron staining are consistent with each other, particularly in the areas where black arrowheads indicate. The QSM map shows positive values (red) in regions correlating to iron stains in histology (brown).
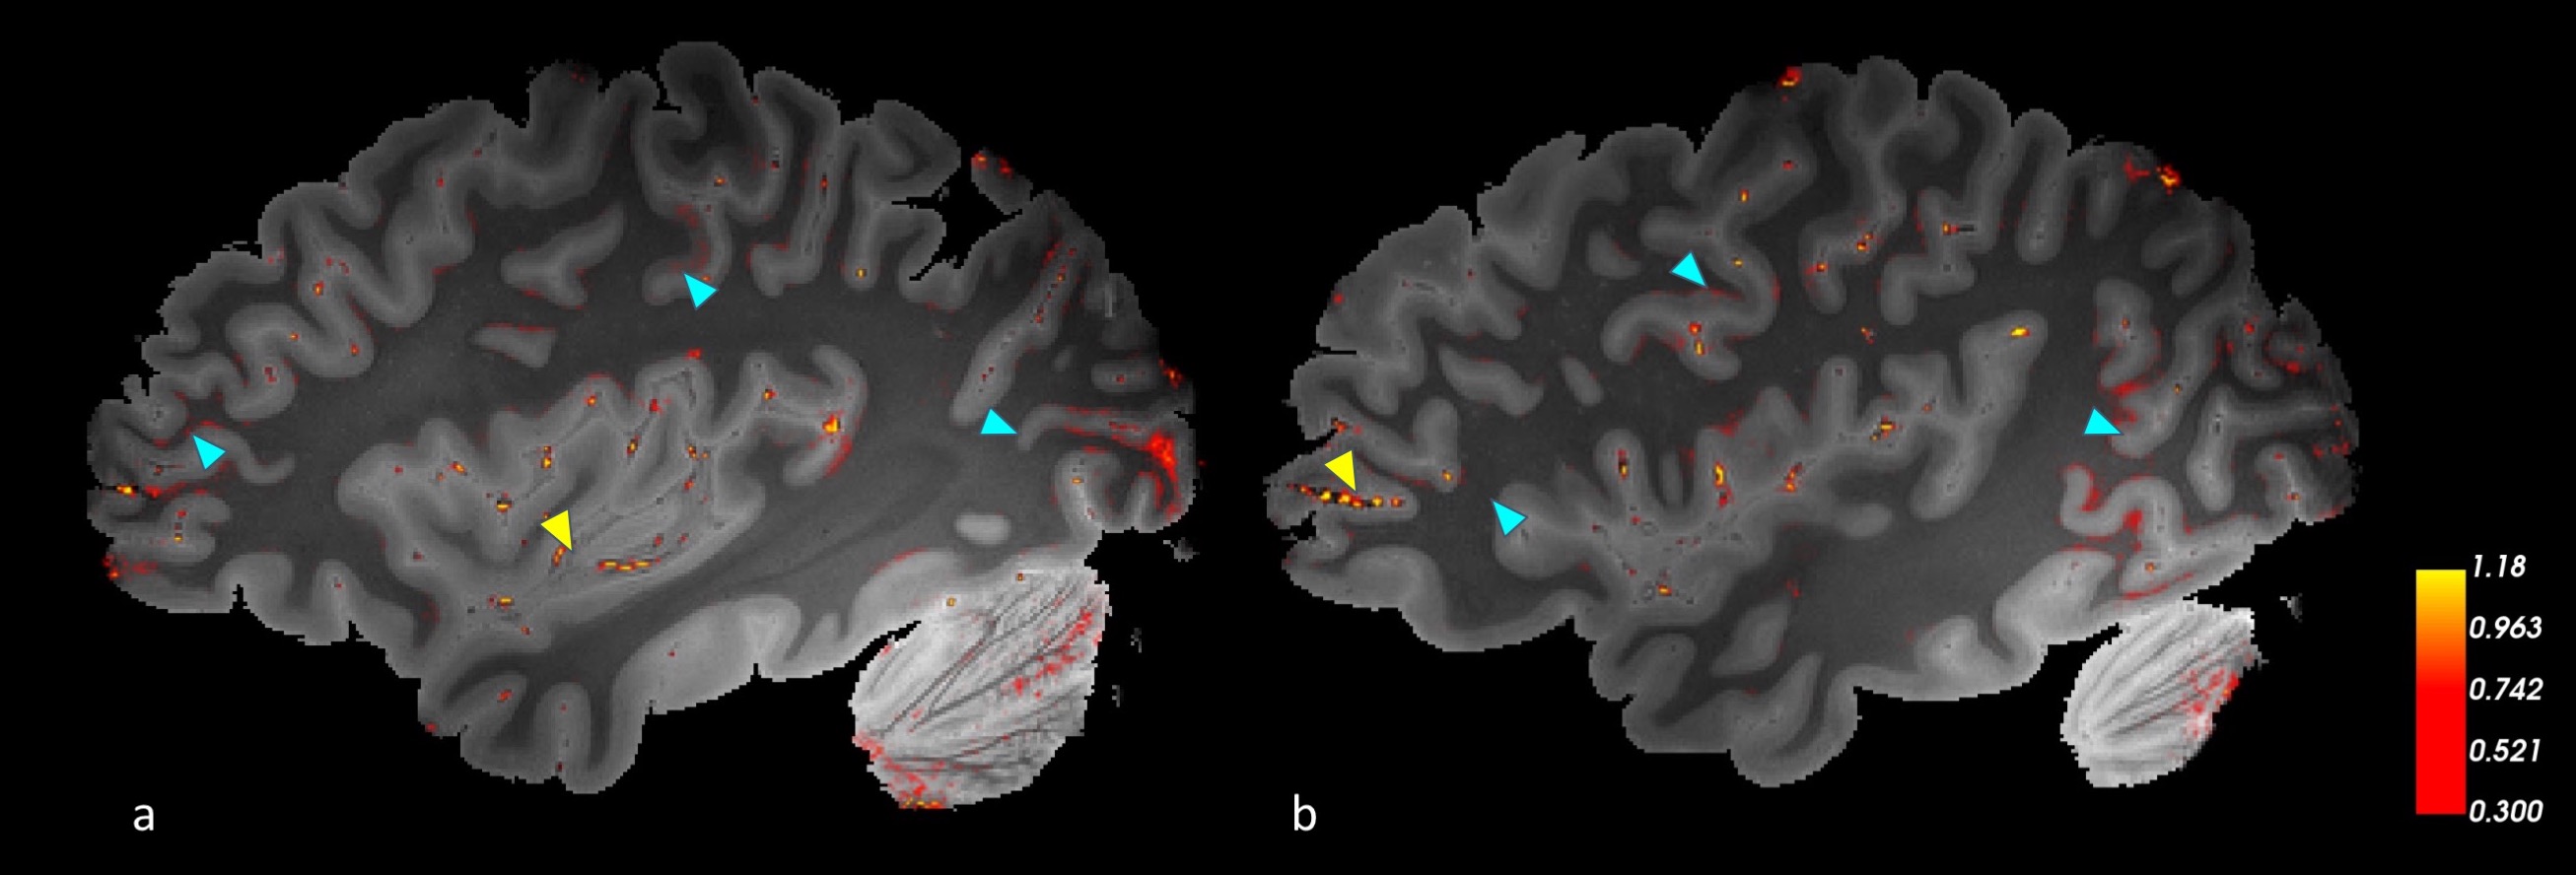
Fig.3 shows two sagittal slices of the magnitude image with QSM map thresholded at 0.3. Areas that remain after thresholding contain the highest positive susceptibility. We observe regions in visual cortex and parietal lobe having high values, as expected from in vivo literature17. In addition, a localized region in the frontal lobe passes the threshold and follows the anatomy. Areas of interest are marked with cyan arrowheads. Yellow arrowheads point to susceptibility artifacts from air trapped within vessels and gaps commonly seen in ex vivo imaging.
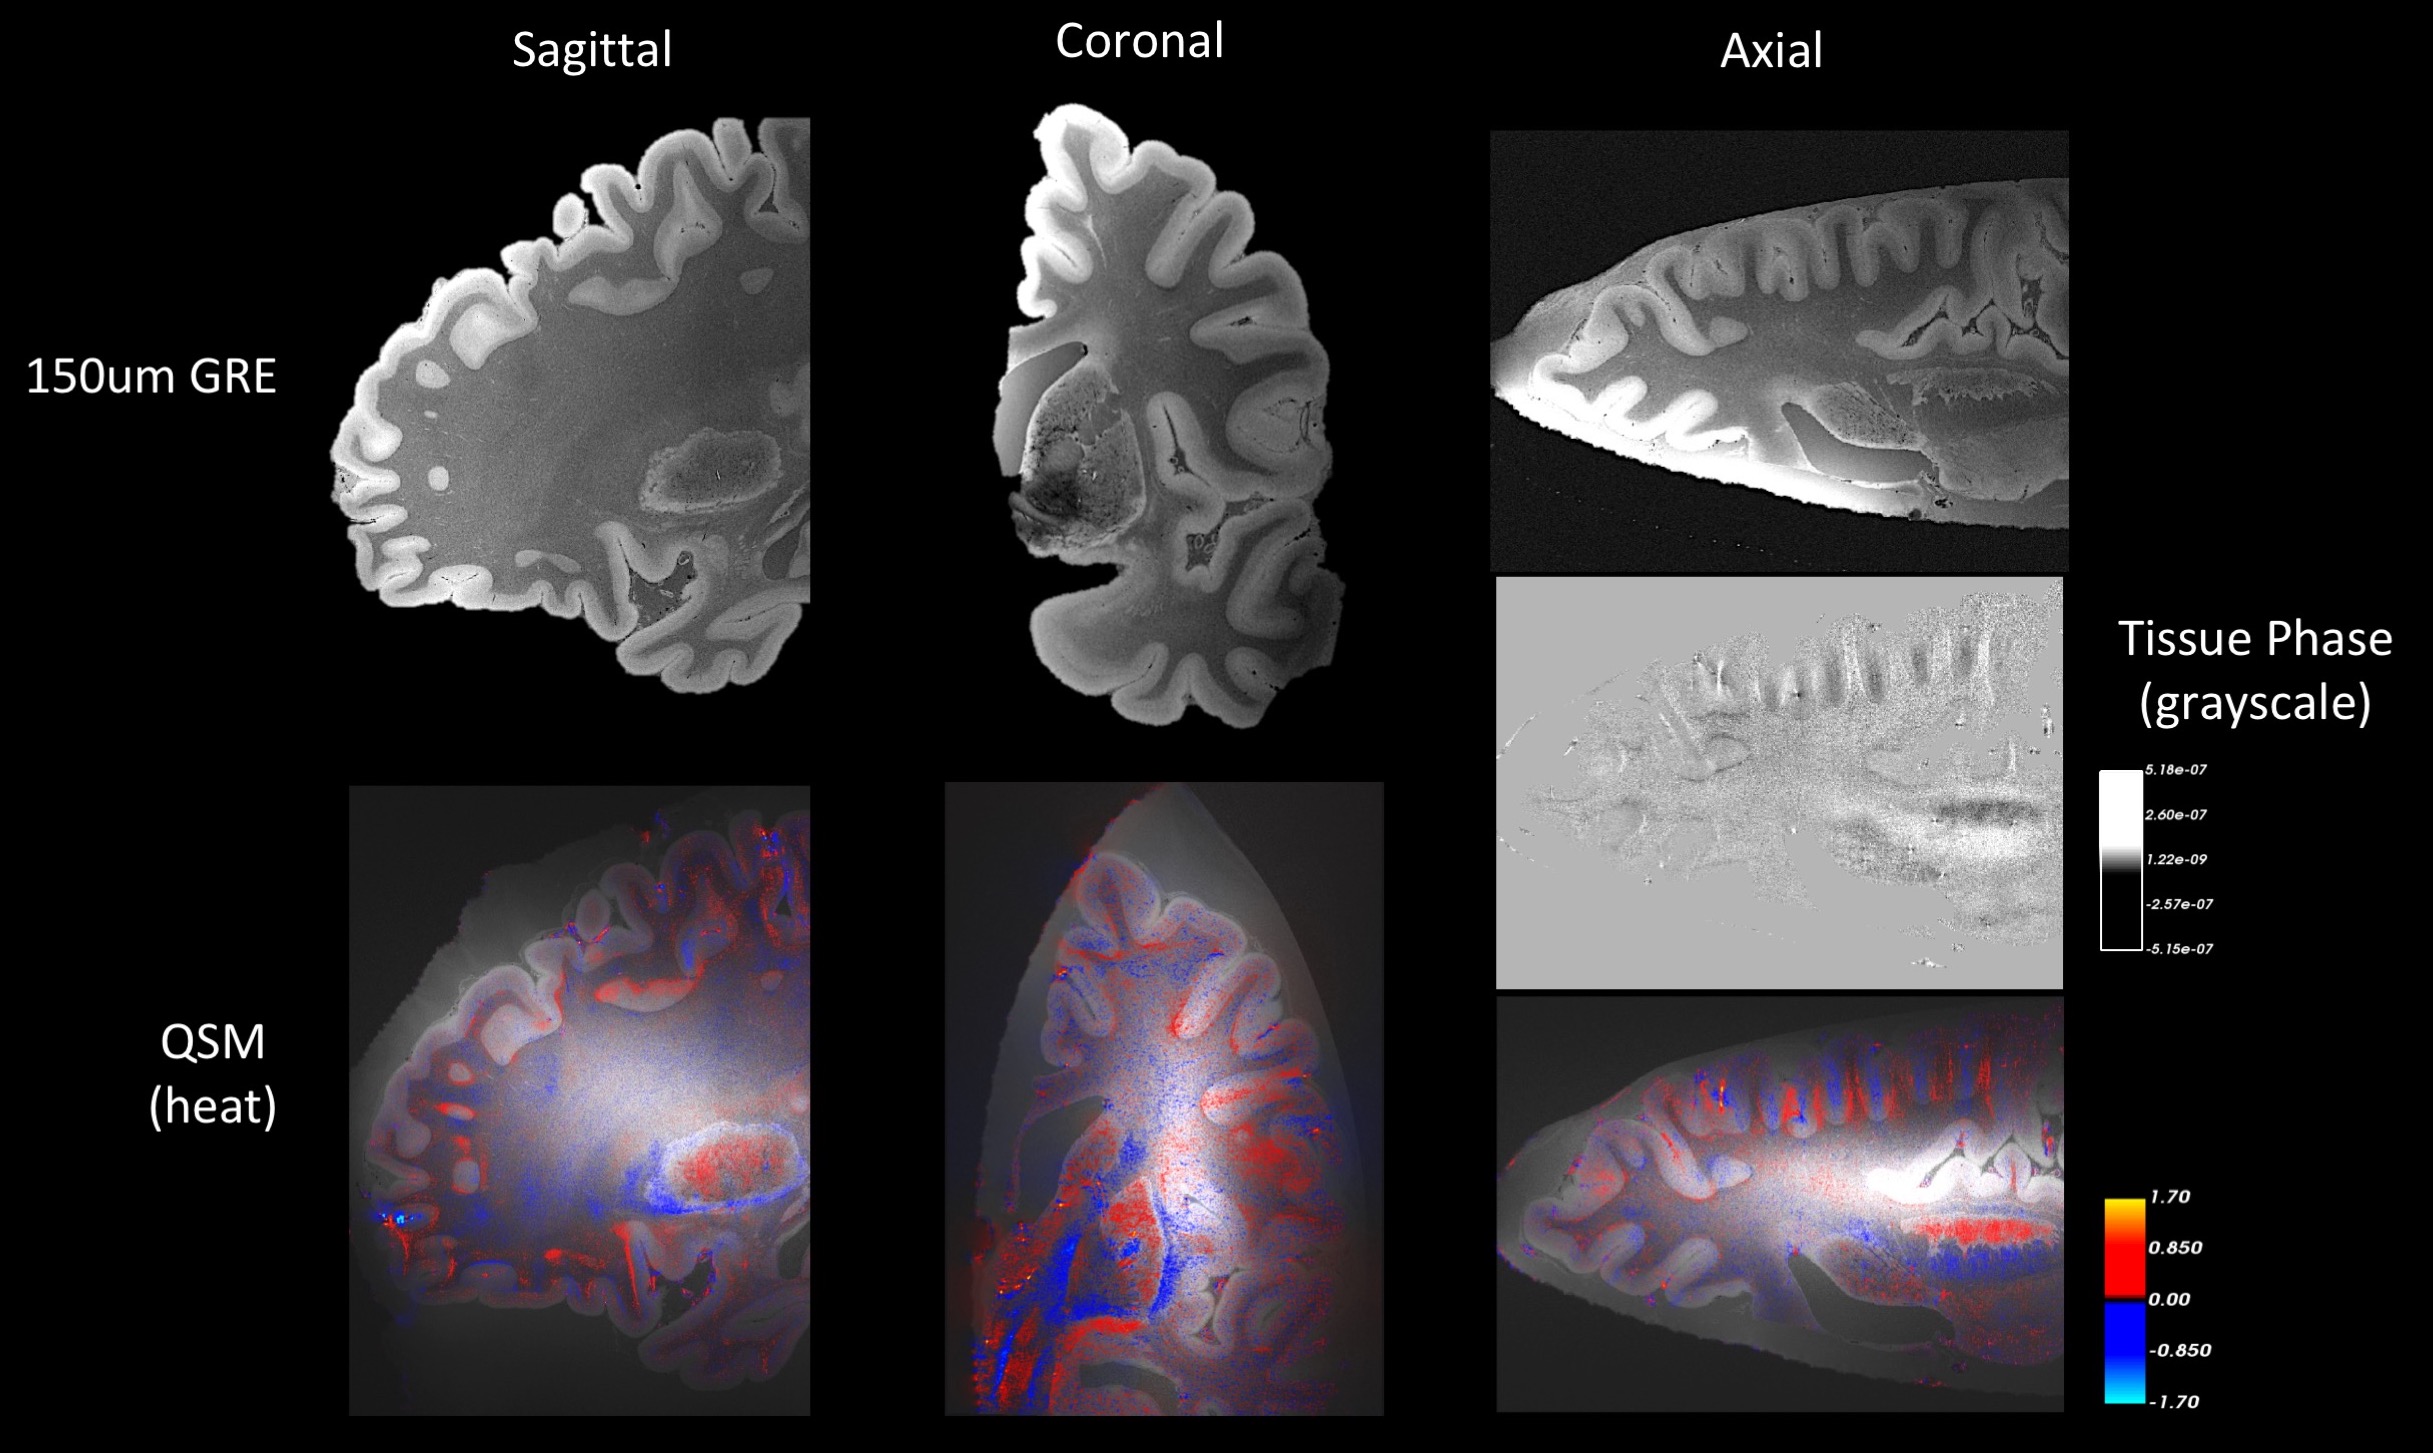
Fig.4 shows the results of QSM at 150um for the same hemisphere. Data is presented with the RMS image calculated across all four echoes of 150um MRI data above and the QSM calculation overlaid as a heat map below. Again, we see a consistent pattern of positive susceptibility, indicated in red, along the folds of cortex close to the gray-white boundary. This is synergistic with the 500um result, despite the low SNR setting. The same pattern is visible in the tissue phase map of the axial slice. In the tissue phase, it also becomes clear that changes in phase are of the order of 150 – 300um, further strengthening the need for such high resolution analysis of QSM using ex vivo MRI.
Conclusion
In this work we presented some preliminary results to demonstrate that QSM of the ex vivo human brain at high resolution can give a global insight into the microstructure that is not possible with blocked ex vivo tissue or low-resolution in vivo MRI.The QSM maps at 500um resolution showed positive susceptibility values across the cortex that we were able to validate as being correlated to iron in the prefrontal cortex. We also demonstrated that phase and QSM map at 150um were consistent with the 500um result.
Future directions will include performing surface based analysis on multiple human brain specimens to validate the consistency of the QSM maps across the cortex, particularly within the frontal lobe, and to improve the SNR of the 150um result.
Acknowledgements
Support for this research was provided in part by the BRAIN Initiative Cell Census Network grant U01MH117023, the National Institute for Biomedical Imaging and Bioengineering (P41EB015896, 1R01EB023281, R01EB006758, R21EB018907, R01EB019956), the National Institute on Aging (1R56AG064027, 5R01AG008122, R01AG016495), the National Institute of Mental Health the National Institute of Diabetes and Digestive and Kidney Diseases (1-R21-DK-108277-01), the National Institute for Neurological Disorders and Stroke (R01NS0525851, R21NS072652, R01NS070963, R01NS083534, 5U01NS086625, 5U24NS10059103, R01NS105820), and was made possible by the resources provided by Shared Instrumentation Grants 1S10RR023401, 1S10RR019307, and 1S10RR023043. Additional support was provided by the NIH Blueprint for Neuroscience Research (5U01-MH093765), part of the multi-institutional Human Connectome Project. In addition, BF has a financial interest in CorticoMetrics, a company whose medical pursuits focus on brain imaging and measurement technologies. BF's interests were reviewed and are managed by Massachusetts General Hospital and Partners HealthCare in accordance with their conflict of interest policies.
This work was supported in part by the MGH/HST Athinoula A. Martinos Center for Biomedical Imaging; and was made possible by the resources provided by NIH Shared Instrumentation Grants S10-RR023043 and S10-RR019371.
R01HD099846, R01HD093578, R01HD085813
References
1 Salomir, R, De Senneville, Baudouin D; Moonen, C TW, A fast calculation method for magnetic field inhomogeneity due to an arbitrary distribution of bulk susceptibility. Concepts in Magnetic Resonance. 19B: 26–34,(2003).
2. Wang, Yi Quantitative susceptibility mapping (QSM): Decoding MRI data for a tissue magnetic biomarker. Magnetic Resonance in Medicine. 73: 82–101,(2014).
3 Liu, T.; Liu, J.; de Rochefort, L.; Spincemaille, P.l; et al. Morphology enabled dipole inversion (MEDI) from a single-angle acquisition: Comparison with COSMOS in human brain imaging". Magnetic Resonance in Medicine. 66 (3): 777–83, (2011).
4 Polak, D, Chatnuntawech, I, Yoon, J, Iyer, S, Lee, J, Bachert, P, Adalsteinsson, E, Setsompop, K, Bilgic, B. Nonlinear Dipole Inversion (NDI) enables Quantitative Susceptibility Mapping (QSM) without parameter tuning, arXiv:1909.13692, (2019).
5. Liu, T, Spincemaille, P, De Rochefort, L, Kressler, B, et al., Calculation of susceptibility through multiple orientation sampling (COSMOS): A method for conditioning the inverse problem from measured magnetic field map to susceptibility source image in MRI". Magnetic Resonance in Medicine. 61 (1): 196–204, (2009).
6. Fukunaga, M, Li, T, van Gelderen, P, de Zwart, J.A., Shmueli, K, Yao, B, Lee, J, Maric, D, Aronova, M.A., Zhang, G, Leapman, R.D., Schenck, J.F., Merkle, H, Duyn, J.H., Layer-specific variation of iron content in cerebral cortex as a source of MRI contrast, Proceedings of the National Academy of Sciences Feb, 107 (8) 3834-3839, (2010).
7. Edwards, L.J., Kirilina, E, Mohammadi, S, Weiskopf, N,Microstructural imaging of human neocortex in vivo,NeuroImage,Volume 182,184-206,(2018).
8 Edlow B L., Mareyam A., Horn A., Polimeni J R., Tisdall D M., Augustinack J., Stockmann J P., Diamond B R., Stevens A, Tirrell L S., Folkerth R D., Wald L L., Fischl B., van der Kouwe A., 7 Tesla MRI of the ex vivo human brain at 100 micron resolution, bioRxiv 649822;(2019).
9. Eckstein K, Dymerska B, Bachrata B, Bogner W, Poljanc K, Trattnig S, Robinson SD. Computationally Efficient Combination of Multi-channel Phase Data From Multi-echo Acquisitions (ASPIRE). Magn. Reson. Med.,79:2996–3006, (2018).
10. Li, Wei; Wu, Bing; Liu, Chunlei, Quantitative susceptibility mapping of human brain reflects spatial variation in tissue composition. NeuroImage. 55 (4): 1645–56, (2011).
11. Schweser F., Sommer K, Deistung A, Reichenbach J R,Quantitative susceptibility mapping for investigating subtle susceptibility variations in the human brain,NeuroImage,Volume 62, Issue 3,Pages 2083-2100, (2012).
12. Bernstein MA, Grgic M, Brosnan TJ, Pelc NJ. Reconstructions of phase contrast, phased array multicoil data. Magn Reson Med, 32:330–334,(1994).
13. Perls M, Nachweis von Eisenoxyd in gewissen Pigmenten. Virchows Arch 39: 42–48, (1867) .
14. Nguyen-Legros J, Bizot J, Bolesse M, Pulicani JP, “Diaminobenzidine black” as a new histochemical demonstration of exogenous iron. Histochemistry 66:239–244, (1980).
15. Smith MA, Harris PL, Sayre LM, Perry G ,Iron accumulation in Alzheimer disease is a source of redox-generated free radicals. Proc Natl Acad Sci USA 94:9866–9868 (1997)
16. Stüber C., Morawski M., Schäfer A., Labadie C., Wähnert M., Leuze C., Streicher M., Barapatre N., Reimann K., Geyer S., Spemann D., Turner R., Myelin and iron concentration in the human brain: a quantitative study of MRI contrast,Neuroimage, 93 , pp. 95-106, (2014).
17. Marques J P., Khabipova D., Gruetter R.,Studying cyto and myeloarchitecture of the human cortex at ultra-high field with quantitative imaging: R1, R2* and magnetic susceptibility,NeuroImage (2017), Volume 147, Pages 152-163, (2017)
Figures