3206
Can Multi-Parametric Mapping Sequences Be Used for Accurate Quantitative Susceptibility Mapping?1Department of Medical Physics and Biomedical Engineering, University College London, London, United Kingdom, 2Great Ormond Street Institute of Child Health, University College London, London, United Kingdom, 3Biomedical Engineering & Imaging Sciences, King's College London, London, United Kingdom
Synopsis
We compared the results of Quantitative Susceptibility Mapping (QSM) in each of the Proton Density (PD-), Magnetization Transfer (MT-) and T1-weighted Multi-Echo Gradient-Echo (ME-GRE) sequences in Multi-Parametric Mapping (MPM) with QSM from a conventional ME-GRE sequence. In deep grey matter (GM) regions, we found significant susceptibility (χ) correlations between each sequence pair. Correlation coefficients were lower in white matter (WM), particularly in T1-w and MT-w sequences. Averaging χ over MPM sequences increased correlations in WM and reduced noise in GM and WM. Whole-brain χ difference maps showed the largest χ differences in and around large veins and air spaces.
Introduction
Multi-Parametric Mapping (MPM) gives high resolution maps of R1, R2*, magnetization transfer (MT) and effective proton density (PD*) from three 3D multi-echo gradient-echo (ME-GRE) sequences with PD-, MT- and T1-weighting1-3. T1 weighting is introduced by appropriate selection of the flip angle, whilst MT weighting is achieved by applying an off-resonance radio frequency pre-saturation pulse prior to excitation. Quantitative Susceptibility Mapping (QSM) can be applied to each MPM ME-GRE sequence to provide clinically useful susceptibility (χ) maps4. However, the effect of the three different weightings on the calculated χ is unclear and, therefore, it is not apparent which (combination) of the three sequences will provide an optimal measure of χ.We aimed to: 1) investigate the similarity between χ calculated from the three MPM 3D ME-GRE sequences and a conventional T2*-weighted 3D ME-GRE sequence 2) Investigate whether averaging QSM across the three ME-GRE sequences increases χ accuracy. Comparing χ maps is challenging as there is no ground truth available. Several metrics were used for comparison including: correlation of average χ in segmented regions of interest (ROI) across subjects, root mean square error (RMSE) and structural similarity index (SSIM)5. χ difference maps between each pair of sequences were calculated by registering all χ maps to a common study-wise space.
Methods
17 healthy subjects (mean ± standard deviation (SD) age: 16.89 ± 4.77 years) and 20 subjects with sickle cell anaemia (17.47 ± 4.00 years) were imaged at 3T (Siemens Magnetom Prisma) with a standard 3D ME-GRE sequence and the MPM ME-GRE sequences. Key sequence parameters are shown in Figure 1. The imaging protocol also included a 1 mm3 isotropic T1-weighted MP-RAGE sequence.For all sequences, χ maps were calculated using the following pipeline: Bz field maps were obtained from a nonlinear fit of the complex ME-GRE images6 and underwent Laplacian-based unwrapping7. Background field removal was performed using Projection onto Dipole Fields8. Field-to-χ inversion was performed using Tikhonov regularization9 with regularization parameter α=0.06, selected using L-Curve methods. Brain masks were calculated from the final echo PD-w magnitude image using FSL BET10.
Regions of interest were segmented based on co-registration of the EVE atlas11 to the final echo PD-w magnitude image using NiftyReg12. Correlation coefficients for the average χ, measured in five deep GM and five cortical WM regions, were calculated between every sequence pair. RMSE and SSIM were also calculated between χ from each of the MPM sequences and their average, relative to χ from the standard ME-GRE sequence.
To obtain χ difference maps for each sequence pair, χ maps were registered to a study-wise average template created from the bias-corrected MP-RAGE images using the diffeomorphic greedy-SyN algorithm in ANTs13. Each ME-GRE image was registered to their corresponding MP-RAGE image and then transformed to the study-wise template space. Intra-subject absolute χ difference maps were calculated for each sequence pair and then averaged across all subjects.
Results and Discussion
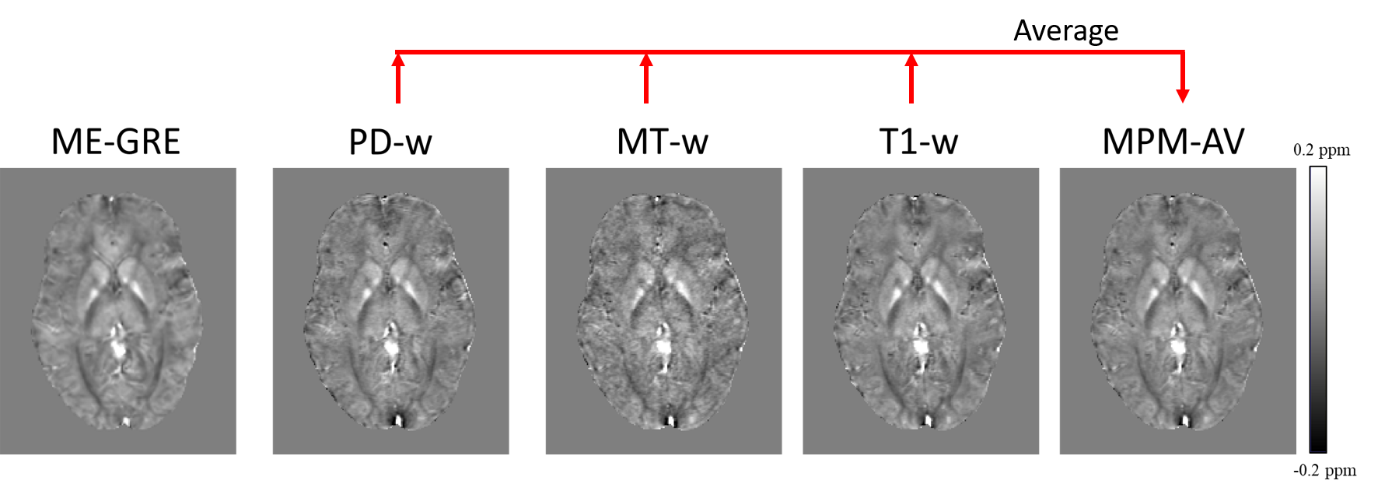
Figure 2 shows an axial slice of χ maps calculated from each sequence and the MPM average χ map in a representative HC subject. Figure 3a shows the results of the correlation analysis between the average χ values measured in the GM and WM ROI. Figure 3b shows a comparison of the ROI standard deviations (SDχ) averaged over GM and WM ROI and Figure 3c shows the results of the RMSE analysis.In GM, significant positive correlations were found between the mean χ from the ME-GRE and each of the MPM sequences. In WM, lower correlation coefficients were found between the ME-GRE and MPM sequences. Poor WM χ correlations for T1-w and MT-w sequences may be caused by χ values being close to zero and dependent on fiber orientation; and variable signal contributions from myelin water.
Averaging χ maps across the three MPM sequences increased correlations and reduced SDχ in both WM and GM. RMSE was lowest between the PD-w and ME-GRE sequences. SSIM values were uniform for all sequence pairs (mean ± SD: 0.741 ± 0.006).
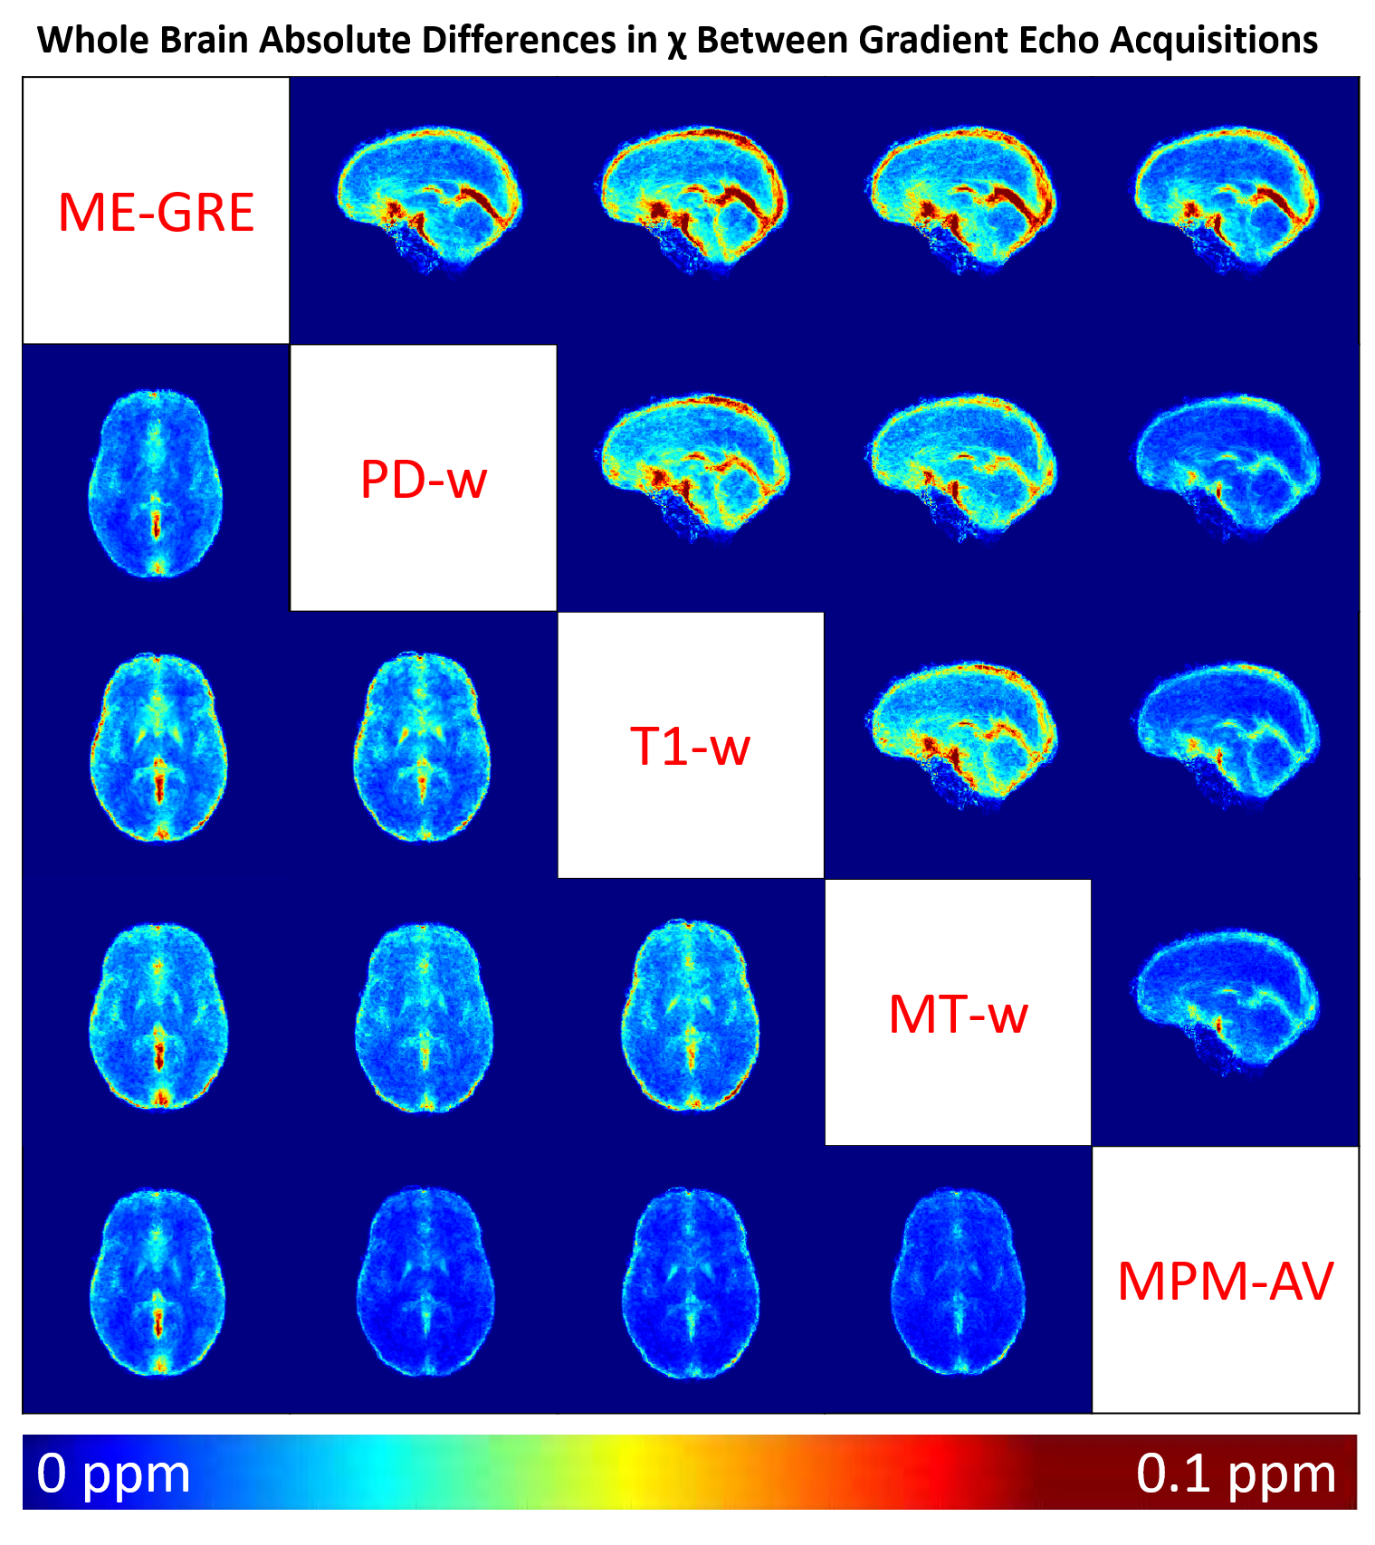
Figure 4 shows an axial and a sagittal slice from the absolute χ difference maps between each sequence pair averaged across all subjects. The largest differences between sequences occurred in and around large veins such as the straight sinus and superior sagittal sinus. Large χ differences were also observed in noisy frontal areas close to large χ gradients near the nasopharyngeal air spaces. These discrepancies likely arose due to differences between blood and tissue T1, variable effects of MT saturation on blood and tissue, and variations between the ME-GRE and MPM longest echo times (27ms vs 18.72ms). χ differences between the conventional ME-GRE and MT-w/T1-w sequences were observed throughout the brain and were not restricted to either GM or WM regions.
Future work will examine the effect of the χ differences observed in large veins on measures of venous oxygen saturation derived from the MPM χ maps.
Conclusion
Averaging χ across MPM ME-GRE sequences improved accuracy, as demonstrated by higher χ correlations and lower SDχ relative to individual MPM sequences. In white matter, χ was poorly correlated between different sequences. Whole-brain χ difference maps showed the largest χ differences in and around large veins and air spaces.Acknowledgements
Thanks to Nikolaus Weiskopf and Antoine Lutti who provided the MPM sequences, to Sati Sahota for helping with patient recruitment, and to the study participants who make this work possible.
This study was supported by the EPSRC-funded UCL Centre for Doctoral Training in Medical Imaging (EP/L016478/1).
References
1. Helms G, Dathe H, Dechent P. Quantitative FLASH MRI at 3T using a rational approximation of the Ernst equation. Magnetic Resonance in Medicine: 2008;59(3):667-72.
2. Helms G, Dechent P. Increased SNR and reduced distortions by averaging multiple gradient echo signals in 3D FLASH imaging of the human brain at 3T. Journal of Magnetic Resonance Imaging: An Official Journal of the International Society for Magnetic Resonance in Medicine. 2009 Jan;29(1):198-204.
3. Weiskopf N, Lutti A, Helms G, et al. Unified segmentation based correction of R1 brain maps for RF transmit field inhomogeneities (UNICORT). Neuroimage. 2011 Feb 1;54(3):2116-24.
4. Eskreis‐Winkler S, Zhang Y, Zhang J,et al. The clinical utility of QSM: disease diagnosis, medical management, and surgical planning. NMR in Biomedicine. 2017 Apr;30(4):e3668.
5. Langkammer C, Schweser F, Shmueli K,et al. Quantitative susceptibility mapping: report from the 2016 reconstruction challenge. Magnetic resonance in medicine. 2018 Mar;79(3):1661-73.
6. Liu T, Wisnieff C, Lou M, et al. Nonlinear formulation of the magnetic field to source relationship for robust quantitative susceptibility mapping. Magnetic Resonance in Medicine. 2013;69(2):467–76.
7. Schweser F, Deistung A, Sommer K,et al. Toward online reconstruction of quantitative susceptibility maps: Superfast dipole inversion. Magnetic Resonance in Medicine. 2013;69(6):1582–94.
8. Liu T, Khalidov I, de Rochefort L, et al. A novel background field removal method for MRI using projection onto dipole fields (PDF). NMR in Biomedicine. 2011;24(9):1129–36.
9. Kressler B, De Rochefort L, Liu T, et al. Nonlinear regularization for per voxel estimation of magnetic susceptibility distributions from MRI field maps. IEEE Transactions on Medical Imaging. 2010;29(2):273–81.
10. Smith SM. Fast robust automated brain extraction. Human Brain Mapping. 2002;17(3):143–55.
11. Lim IAL, Faria A V., Li X, Hsu JTC, Airan RD, Mori S, et al. Human brain atlas for automated region of interest selection in quantitative susceptibility mapping: Application to determine iron content in deep gray matter structures. Neuroimage. 2013;82:449–69.
12. Modat M, Ridgway GR, Taylor ZA, Lehmann M, Barnes J, Hawkes DJ, et al. Fast free-form deformation using graphics processing units. Computer Methods and Programs in Biomedicine. 2010;98(3):278–84.
13. Avants BB, Epstein CL, Grossman M, Gee JC. Symmetric diffeomorphic image registration with cross-correlation: evaluating automated labeling of elderly and neurodegenerative brain. Medical image analysis. 2008 Feb 1;12(1):26-41.
Figures

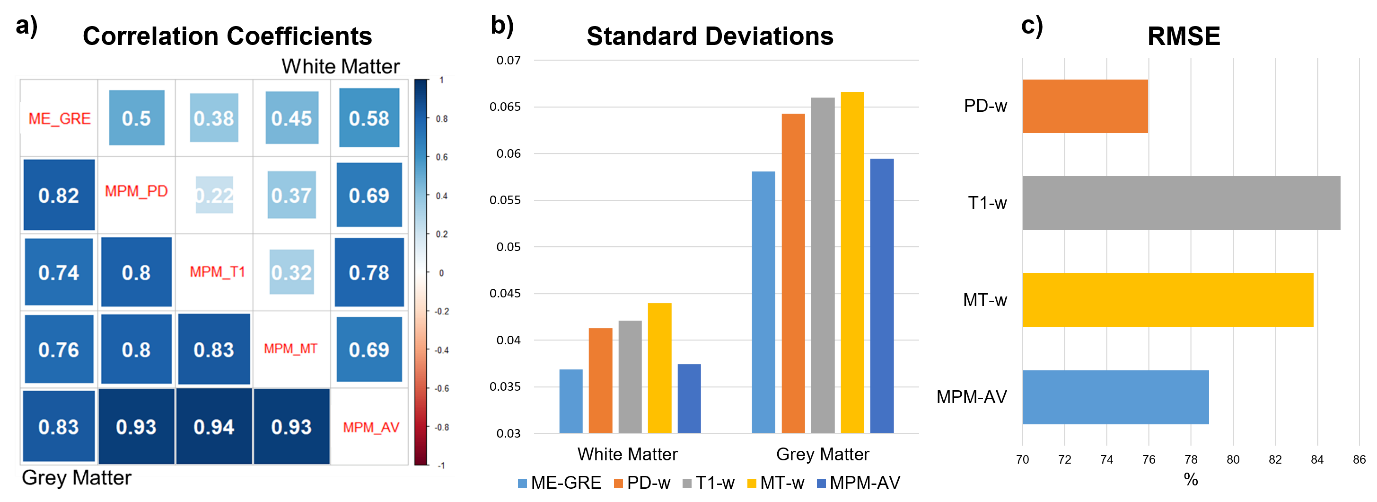
a) Pearson correlation coefficients between regional χ averaged across five white matter (WM) and five grey matter (GM) regions of interest (ROI) .
b) Comparison of standard deviations χ measured within the WM and GM ROI.
c) Comparison of the Root Mean Square Error calculated for χ from each MPM sequence and the MPM average relative to χ from the standard ME-GRE sequence.