3204
Phantom Validation of Simultaneous Mapping of PDFF, R2*, and Susceptibility1Medical Physics, University of Wisconsin-Madison, Madison, WI, United States, 2Radiology, University of Wisconsin-Madison, Madison, WI, United States, 3Biomedical Engineering, University of Wisconsin-Madison, Madison, WI, United States, 4Medicine, University of Wisconsin-Madison, Madison, WI, United States, 5Emergency Medicine, University of Wisconsin-Madison, Madison, WI, United States
Synopsis
Chemical shift-encoded (CSE) MRI can be used to simultaneously obtain multi-parametric maps, including R2*, proton density fat fraction (PDFF), and tissue susceptibility, to aid in the diagnosis of diffuse liver disease. However, the presence of fat in tissue can confound both R2* and B0 field estimation and consequently quantitative susceptibility mapping (QSM). To validate this multi-parametric mapping, comparison of quantitative maps to phantoms with known iron concentrations were performed. This work demonstrated the feasibility of accurate PDFF mapping, and R2* and susceptibility measurements that are linearly dependent on both iron and fat concentration.
Introduction
Chemical shift-encoded (CSE) MRI techniques enable the simultaneous quantification of proton-density fat-fraction (PDFF, an established biomarker of triglyceride concentration), and R2* (an emerging biomarker of liver iron content). Further, CSE-MRI also enables mapping of the B0 field, which can be used for the estimation of tissue susceptibility in quantitative susceptibility mapping (QSM). Importantly, tissue susceptibility is also showing promise as an emerging biomarker of iron quantification, which may provide highly complementary information with R2* regarding iron deposition[1].Thus, comprehensive assessment of liver iron content using R2* and susceptibility simultaneously measured using CSE-MRI is of great interest. However, R2*, susceptibility and PDFF may confound each other [2] and previous studies on susceptibility-based iron quantification have not considered the effect of fat[3]. Highly-controlled validation of the accuracy of R2*, susceptibility and PDFF from CSE-MRI acquisitions is highly desirable. Therefore, the purpose of this work was to validate CSE-MRI techniques for simultaneous estimation of PDFF, R2*, and susceptibility in a fat-iron phantom that closely mimics liver MRI signals in the presence of fat and iron deposition.Methods
Twenty four vials were constructed to mimic the simultaneous presence of fat and iron using a recently proposed phantom formulation[4]. Four sets of vials, each with constant fat fraction, were constructed. The nominal fat fractions designed in each set were 0%, 10%, 20%, and 40%. Each set contained six vials of different iron concentration, obtained by varying the concentration of iron particles (2.9 μm diameter magnetite spheres, COMPEL, Bangs Labs, Fishers, IN). The four sets were separated into two batches of 12 vials each, which were scanned sequentially. The 12 vials in each batch were placed in a holder within a custom designed spherical housing filled with distilled water. Phantoms were placed in the scanner with the long axis of the vials parallel to the main magnetic field.Images were acquired on a clinical 3T MR system (GE Healthcare Signa Premier, Waukesha, WI) using a 48 channel phased array head coil. 3D multi-echo spoiled gradient recalled echo (SGRE) images were acquired using the following imaging parameters: 25x25x17.2 cm3 FOV, 128x128x86 imaging matrix, 1.95x1.95x2 mm3 resolution, 6 echoes with initial echo time 1.1 ms, 0.9 ms echo spacing, echo train length of 3, repetition time 7.2 ms, and 1° flip angle to avoid T1-related bias.
Image reconstruction and data analysis were performed offline. Images of the multichannel data are reconstructed using the Walsh method[5]. Signal fitting was performed using a graphcut method to avoid fat-water swaps [6] followed by voxel-independent fitting of a signal model including R2*, B0 field, and PDFF [7]. Subsequently, tissue susceptibility was calculated using an iterative L2 regularized reconstruction[3].
Region-of-interest (ROI) measurements of PDFF, R2*, and susceptibility values were performed at the center of each vial. The susceptibility of each vial was measured using the adjacent water bath as the susceptibility reference. Linear regressions were performed to validate PDFF measurements with the known fat fraction, and to assess the relationship between R2* and iron concentration. A multi-variable linear regression was performed to assess the relationship between susceptibility and both iron concentration and PDFF.
Results
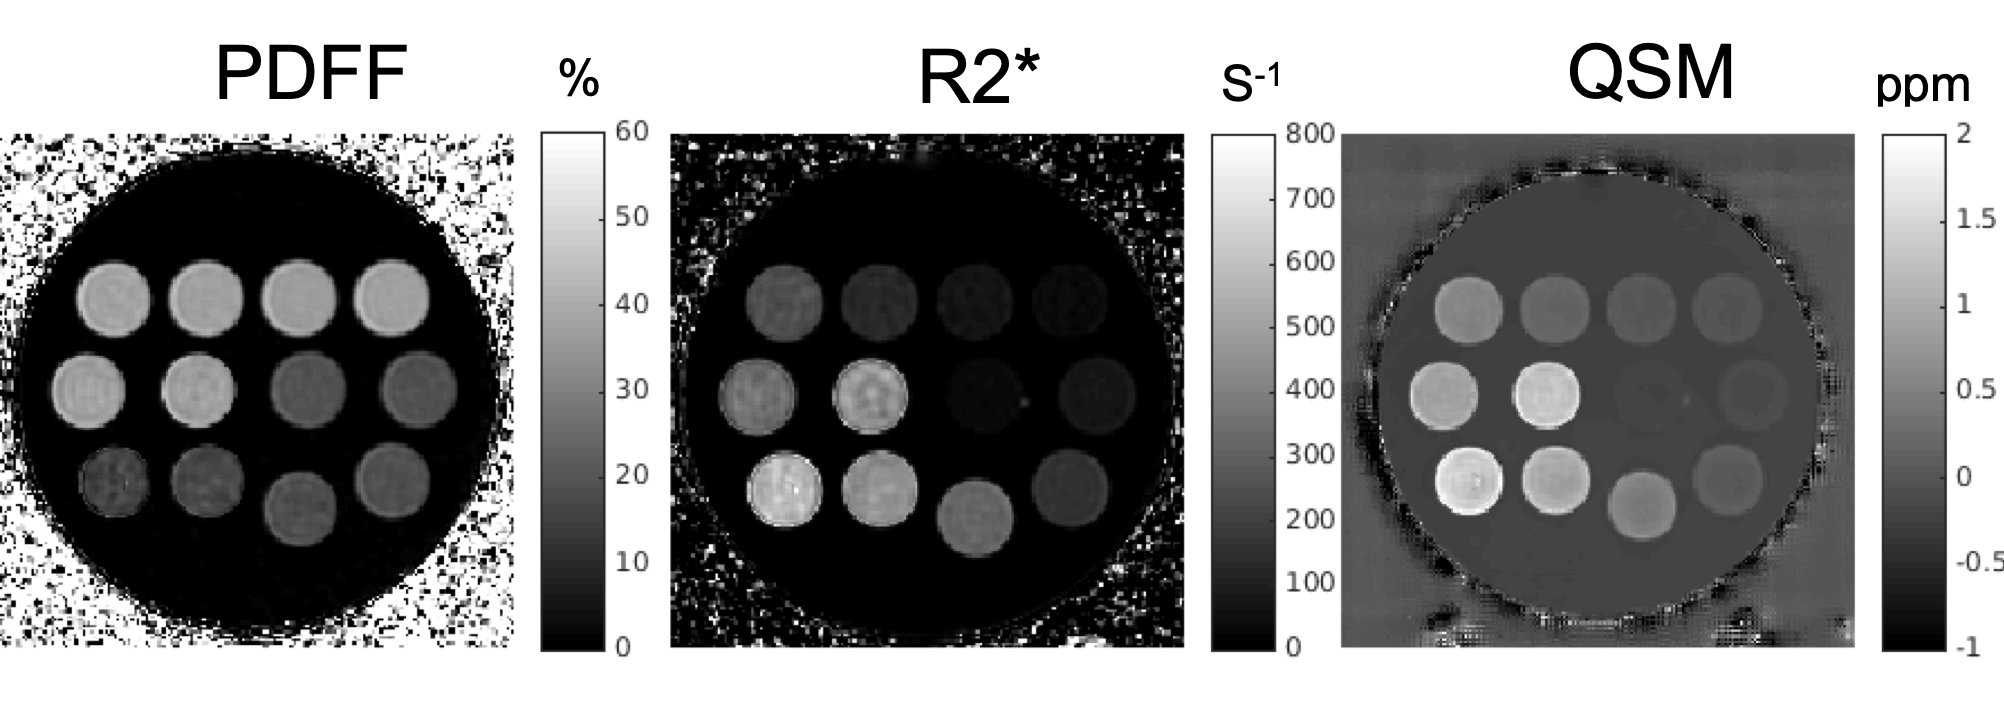
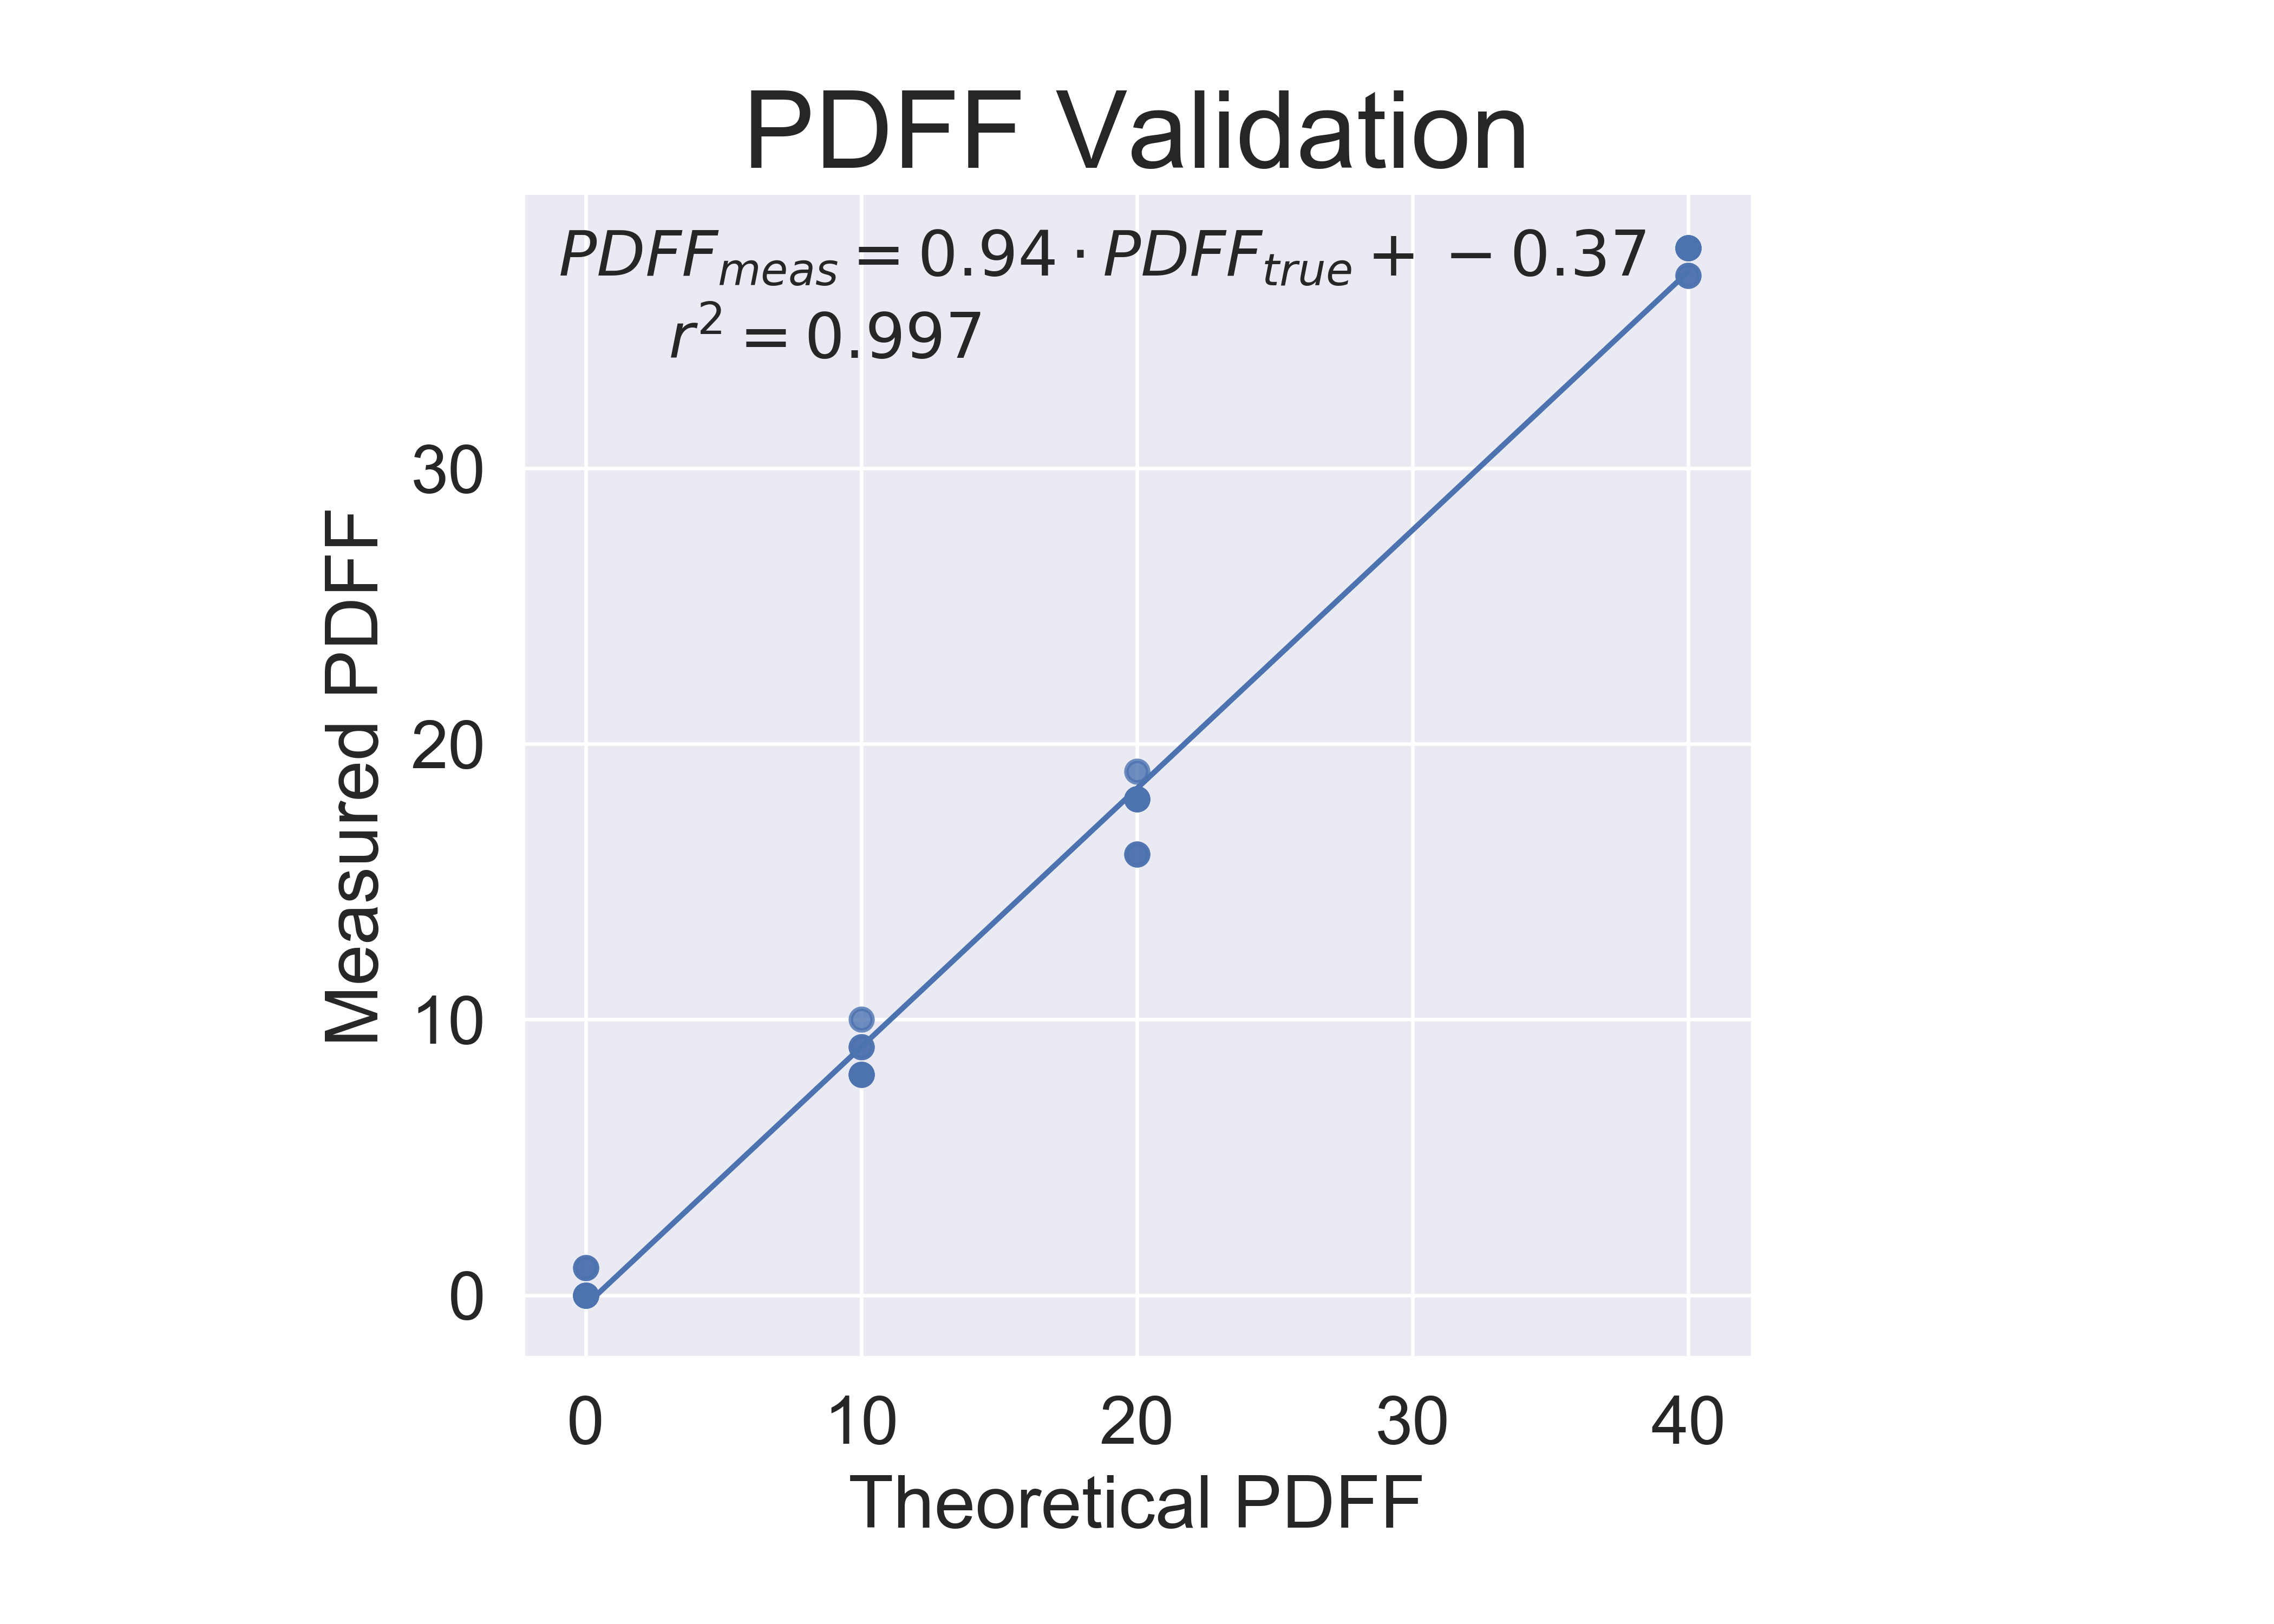
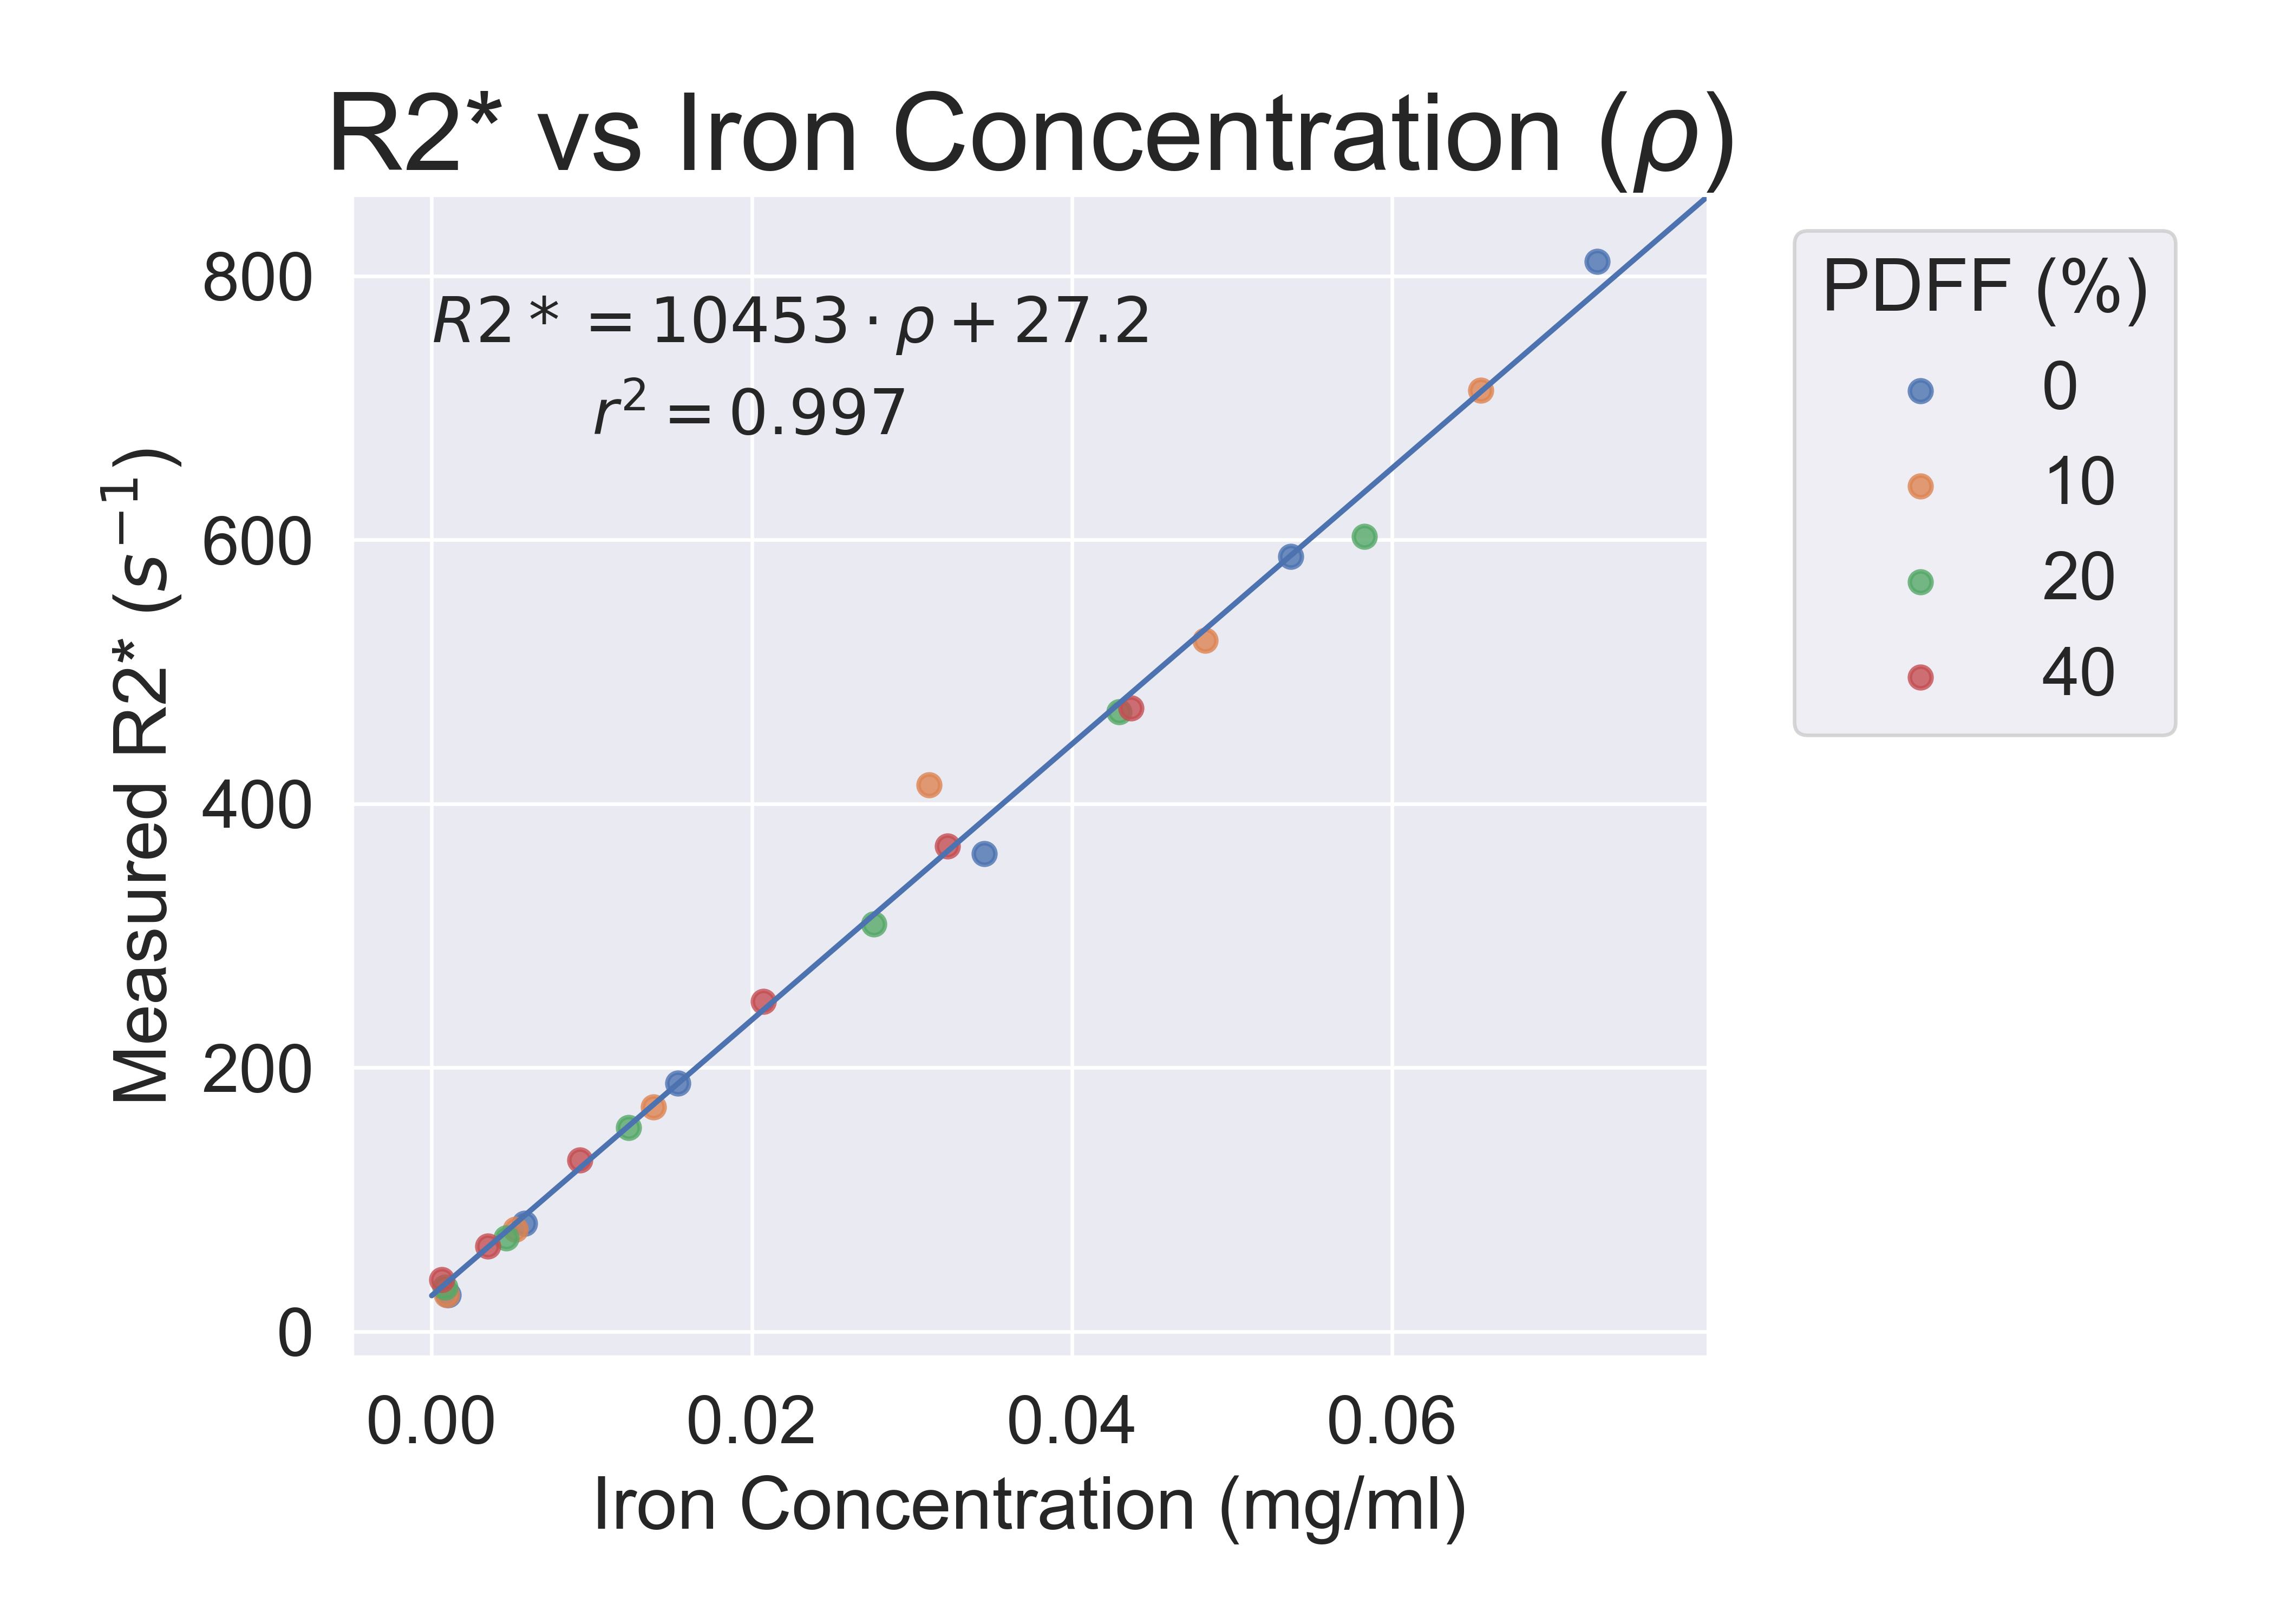
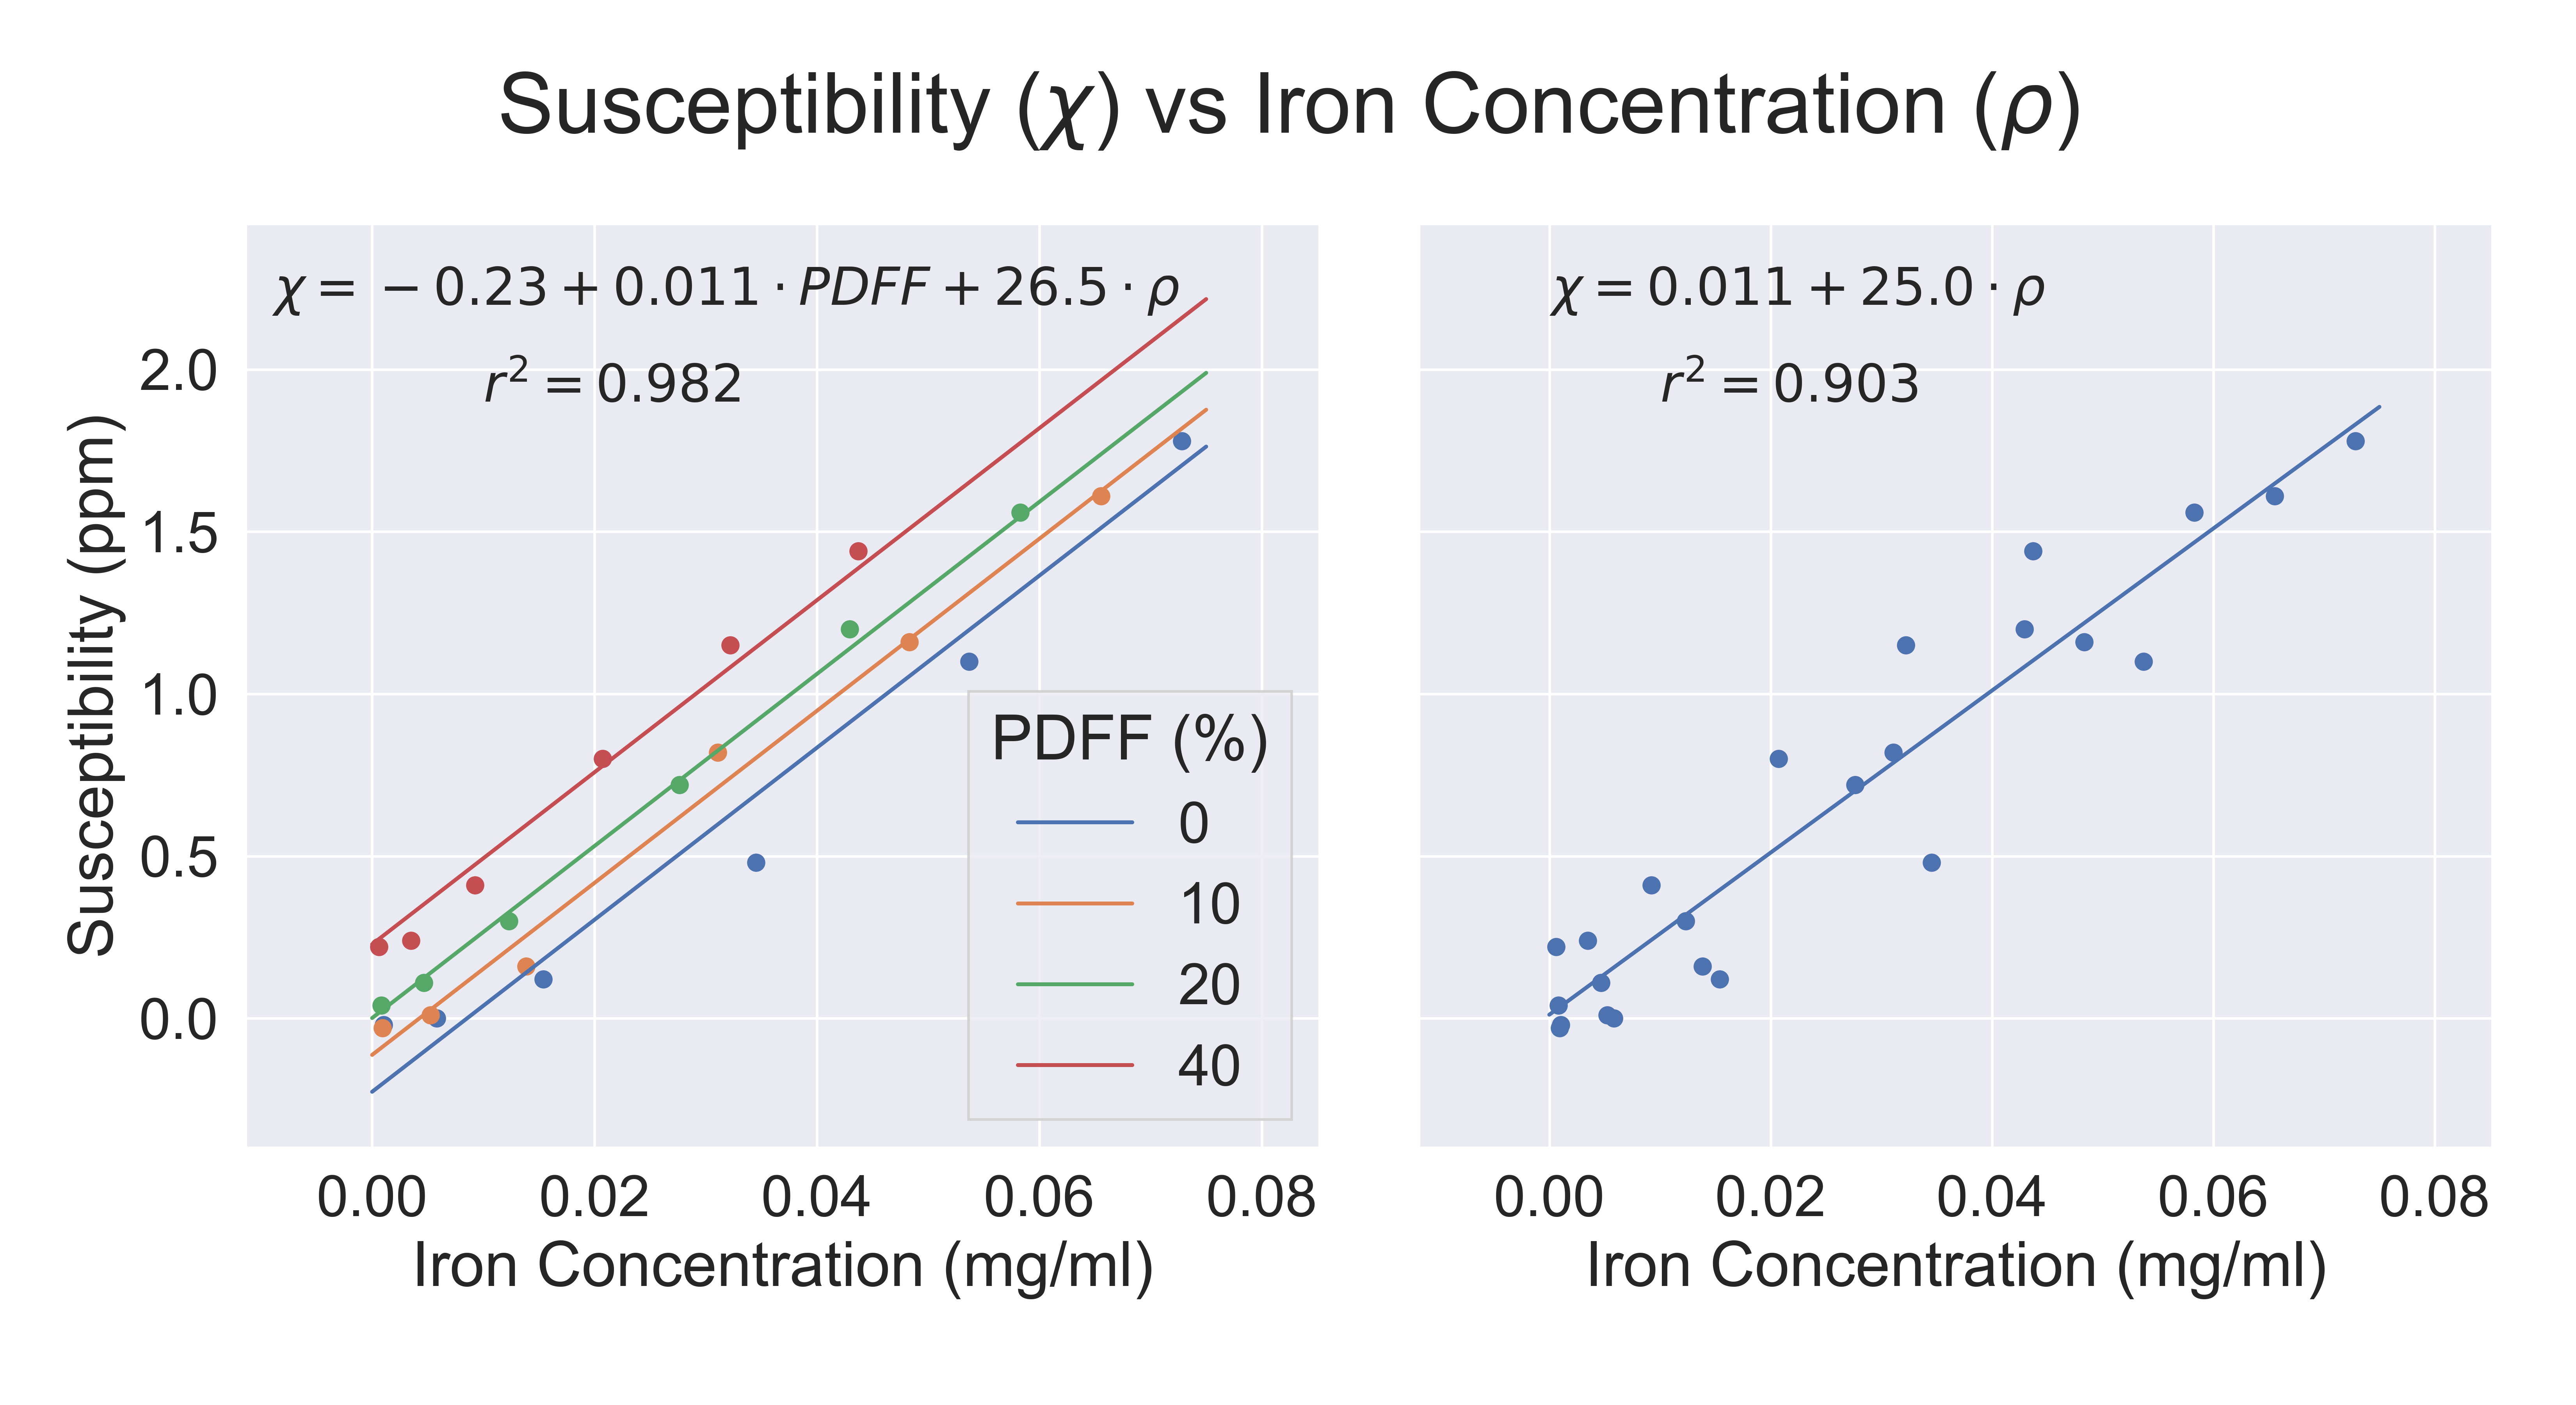
Reconstructed R2*, PDFF, and susceptibility images can be seen in Figure 1. Accurate PDFF values were obtained at varying iron concentrations (Figure 2). Fat-corrected R2* measurements ranged from 27 s-1 to 811 s-1 and were observed to correlate linearly with iron concentration across PDFF values (slope = 7567 s-1 ml/mg, intercept = 27.2 s-1, r2 = 0.99) (Figure 3).Susceptibility was observed to linearly correlate with both iron concentration and PDFF (Figure 4a). A multi-variable linear fit was obtained: $$$ \chi = -0.23+0.011PDFF+19.2\rho_{Fe} $$$ with high r2 = 0.982. If PDFF is not considered in the regression, a lower coefficient of determination is observed (r2 = 0.903) (Figure 4b). Previous works show human fat tissue to have a higher susceptibility than water [8][9], which agrees with the direction of the shift observed in these phantom experiments.
Discussion
This work validated the accuracy of simultaneous CSE-based mapping of R2*, susceptibility and PDFF in a tissue-mimicking fat-iron phantom. Importantly, the presence of fat affects tissue susceptibility, and consequently susceptibility-based iron quantification if unaccounted for. Therefore, correction for the effects of fat may be needed for susceptibility-based iron quantification[10]. Fortunately, PDFF is readily estimated from the same CSE-MRI acquisition, providing additional synergy between the estimated parameters. These results suggest the potential for comprehensive tissue characterization from a single CSE-MRI acquisition in diffuse liver disease.A limitation of this work is that the experiments were performed solely on phantoms, in order to enable highly controlled fat and iron concentration. Future work includes validation of this approach in-vivo in patients with fat and iron deposition in the liver. Additionally, in this phantom iron was added in the form of magnetite microspheres. Different forms of iron will generally result in different MRI properties.
Acknowledgements
We wish to acknowledge support from the NIH (R01 DK083380, R01 DK088925, K24 DK102595) and from the University of Wisconsin SEED grant program. Further, we wish to acknowledge GE Healthcare and Bracco Diagnostics who provides research support to the University of Wisconsin. Finally, Dr. Reeder is a Romnes Faculty Fellow, and has received an award provided by the University of Wisconsin-Madison Office of the Vice Chancellor for Research and Graduate Education with funding from the Wisconsin Alumni Research Foundation.References
[1] T. J. Colgan, G. Knobloch, S. B. Reeder, and D. Hernando, “Sensitivity of quantitative relaxometry and susceptibility mapping to microscopic iron distribution,” Magn. Reson. Med., vol. 83, no. 2, pp. 673–680, 2020.
[2] S. B. Reeder, I. Cruite, G. Hamilton, and C. B. Sirlin, “Quantitative Assessment of Liver Fat with Magnetic Resonance Imaging and Spectroscopy,” J. Magn. Reson. Imaging JMRI, vol. 34, no. 4, p. spcone, Oct. 2011.
[3] S. D. Sharma, D. Hernando, D. E. Horng, and S. B. Reeder, “Quantitative susceptibility mapping in the abdomen as an imaging biomarker of hepatic iron overload: QSM as a Biomarker of Hepatic Iron Overload,” Magn. Reson. Med., vol. 74, no. 3, pp. 673–683, Sep. 2015.
[4] R. Zhao, G. Hamilton, J. H. Brittain, S. B. Reeder, and D. Hernando, “A Quantitative MRI Phantom to Mimic the Simultaneous Presence of Fat, Iron, and Fibrosis,” presented at the ISMRM, 2019, vol. 1777.
[5] D. O. Walsh, A. F. Gmitro, and M. W. Marcellin, “Adaptive reconstruction of phased array MR imagery,” Magn. Reson. Med., vol. 43, no. 5, pp. 682–690, May 2000.
[6] D. Hernando, P. Kellman, J. P. Haldar, and Z.-P. Liang, “Robust water/fat separation in the presence of large field inhomogeneities using a graph cut algorithm,” Magn. Reson. Med., p. NA-NA, 2009.
[7] D. Hernando, J. H. Kramer, and S. B. Reeder, “Multipeak fat-corrected complex R2* relaxometry: Theory, optimization, and clinical validation,” Magn. Reson. Med., vol. 70, no. 5, pp. 1319–1331, 2013.
[8] C. Wang, B. A. Ratliff, C. B. Sirlin, S. B. Reeder, and D. Hernando, “Monte Carlo Modeling of Liver MR Signal in the Presence of Fat,” presented at the ISMRM, 2018, vol. 2264.
[9] S. M. Sprinkhuizen, C. J. G. Bakker, J. H. Ippel, R. Boelens, M. A. Viergever, and L. W. Bartels, “Temperature dependence of the magnetic volume susceptibility of human breast fat tissue: an NMR study,” Magn. Reson. Mater. Phys. Biol. Med., vol. 25, no. 1, pp. 33–39, Feb. 2012.
[10] J. Li et al., “Quantitative susceptibility mapping (QSM) minimizes interference from cellular pathology in R2* estimation of liver iron concentration,” J. Magn. Reson. Imaging, vol. 48, no. 4, pp. 1069–1079, 2018.
Figures