3200
Improved signal modeling in Quantitative Susceptibility Mapping using multi-echo complex Total Field Inversion (mcTFI)1Meinig School of Biomedical Engineering, Cornell University, new york, NY, United States, 2Radiology, Weill Cornell Medicine, New York, NY, United States, 3Meinig School of Biomedical Engineering, Cornell University, New York, NY, United States, 4Radiology, Weill Cornell Medicine, new york, NY, United States
Synopsis
Multi-echo Complex Total Field Inversion (mcTFI) is a Total Field Inversion (TFI) method that computes QSM directly from the complex gradient echo data, for which the assumption of Gaussian noise is well justified. mcTFI demonstrated improvement over TFI in simulation and hemorrhage brain.
Introduction
Quantitative Susceptibility Mapping (QSM) is an emerging non-invasive MRI method to quantify iron, calcium, oxygenation and other susceptibility sources (1-3). Appropriate modeling of the data requires the use of nonlinear estimation and weighting the data according to the noise properties of the magnetic field data (4). The latter noise properties are derived using the known covariance properties of the field obtained using least squares fitting. Nevertheless, errors in the estimated noise weighting propagate into the susceptibility map. The use of iterative re-weighted least squares (MERIT) (5) helps alleviate some of the resulting artifacts but its implementation remains empirical.In this work, we investigate a method, named multi-echo complex Total Field Inversion (mcTFI), that computes a susceptibility map directly from the complex gradient echo data, for which the assumption of Gaussian noise is well justified. We show in simulations that this leads to superior image quality and superior quantification. In patient data, this is shown to lead to a further reduction of artifacts induced by low signal to noise voxels.
Methods
Algorithm:Multi-echo Complex Total Field Inversion (mcTFI) is a Total Field Inversion (TFI) method (6), that computes QSM directly from the complex gradient echo data. The cost function of mcTFI is formulated as follows:
$$(m_0^{'},R_2^{*'},\phi_0^{'},y^{'})=argmin_{m_0,R_2^{*},\phi_0,y}\sum_{j=1}^N{\parallel}m_0e^{-t_jR_2^{*}}e^{i\phi_0}e^{it_jDPy}-S_j{\parallel}^2_2+\lambda{\parallel}M_G{\triangledown}Py{\parallel}^2_2\space\space\space\space\space\space\space\space\space\space[1]$$
Where $$$m_0$$$ is the initial magnetization, $$$t_j$$$ is time at each echo, $$$R_2^*$$$ is T2* relaxation rate, $$$\phi_0$$$ is initial phase, $$$D$$$ is the dipole kernel, $$$P$$$ is a preconditioner so that the susceptibility is $$$\chi=Py$$$, $$$S_j$$$ is the measured complex multi-echo GRE images, $$$M_G$$$ is the binary edge mask, and $$${\triangledown}$$$ denotes the gradient operation. Eq.1 was solved using the Gauss-Newton method.
For efficiency, Eq.1 was broken down into two smaller subproblems at each Gauss-Newton iteration: 1) with $$$y$$$ fixed,$$$m_0$$$ ,$$$R_2^*$$$ , and $$$\phi_0$$$ were solved using a voxel-wise direct inversion, and then 2) with $$$m_0$$$, $$$R_2^*$$$, and $$$\phi_0$$$ fixed, $$$y$$$ was solved with conjugate gradient method while also imposing anatomical regularization (7).
Proper initializations were obtained as follows: $$$R^*_{2,init}$$$ was obtained using ARLO (8), and $$$m_{0,init}=|S_1|-e^{-t_1R^*_{2,init}}$$$. $$$\phi_{0,init}$$$ and total field, $$$f$$$, were obtained by solving:
$$(\phi_{0,init}^{'},f)=argmin_{\phi_0,f}\sum_{j=1}^N{\parallel}|S_j|e^{i\phi_0}e^{it_jf}-S_j{\parallel}^2_2\space\space\space\space\space\space\space\space\space\space[2]$$
Finally, with $$$m_{0,init}$$$, $$$R^*_{2,init}$$$, and $$$\phi_{0,init}$$$ fixed, $$$y_{init}$$$ was obtained by solving:
$$y_{init}=argmin_{y}\sum_{j=1}^N{\parallel}m_{0,init}e^{-t_jR_{2,init}^{*}}e^{i\phi_{0,init}}e^{it_jDPy}-S_j{\parallel}^2_2+{\parallel}w(DPy-f){\parallel}^2_2+\lambda{\parallel}M_G{\triangledown}Py{\parallel}^2_2\space\space\space\space\space\space\space\space\space\space[3]$$
Comparison with TFI:
mcTFI was first compared with TFI (6), both with and without iterative reweighting (MERIT) using the QSM Challenge 2.0 dataset (9), and the results were evaluated according to the metrics of QSM Challenge 2.0. Next, the three approaches were compared on the brain of a hemorrhage brain.
Results
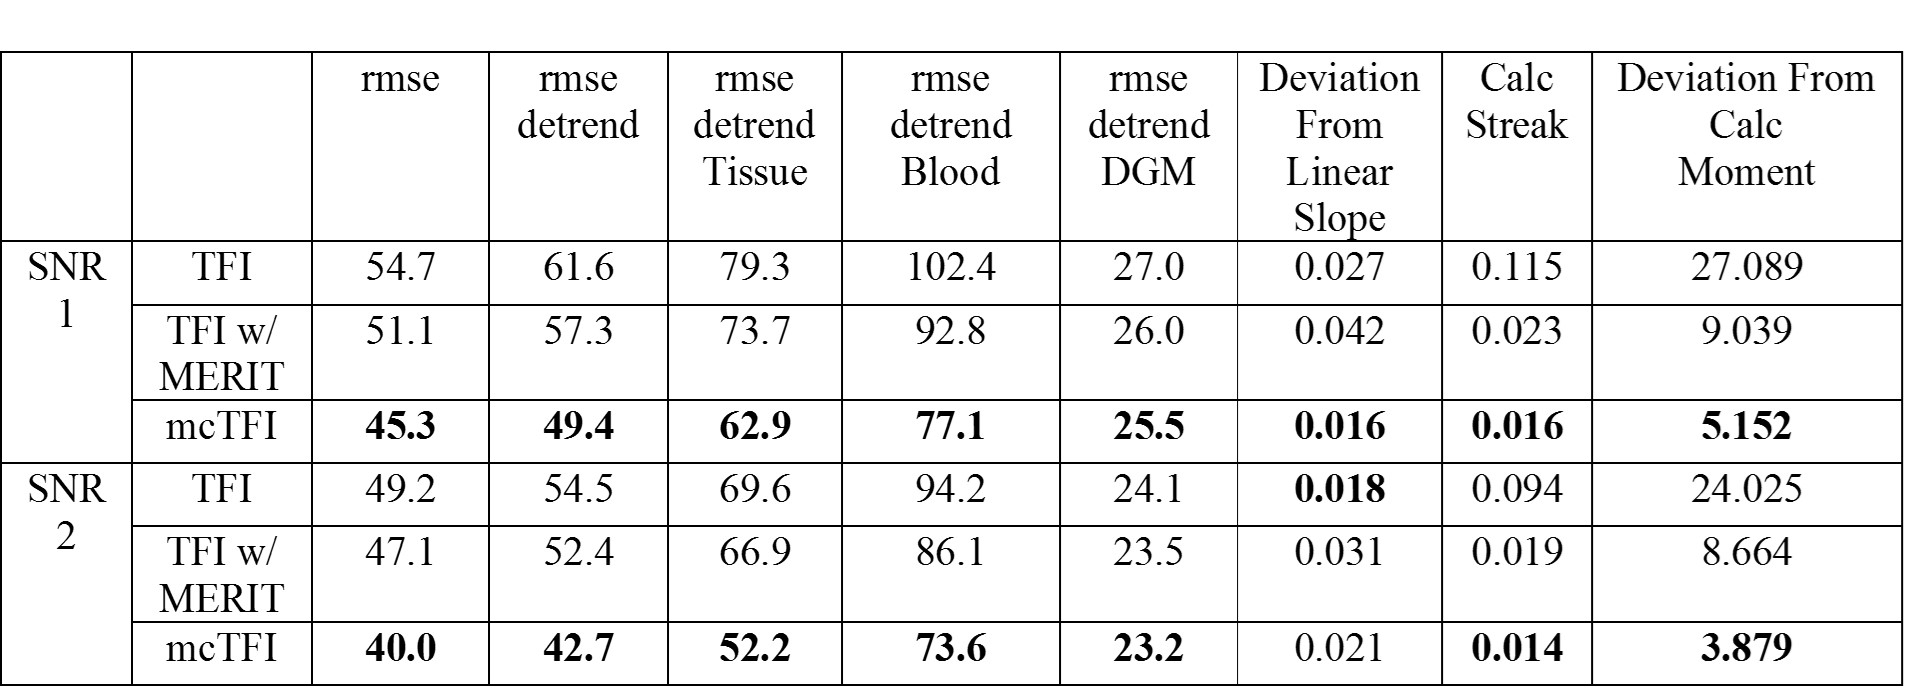
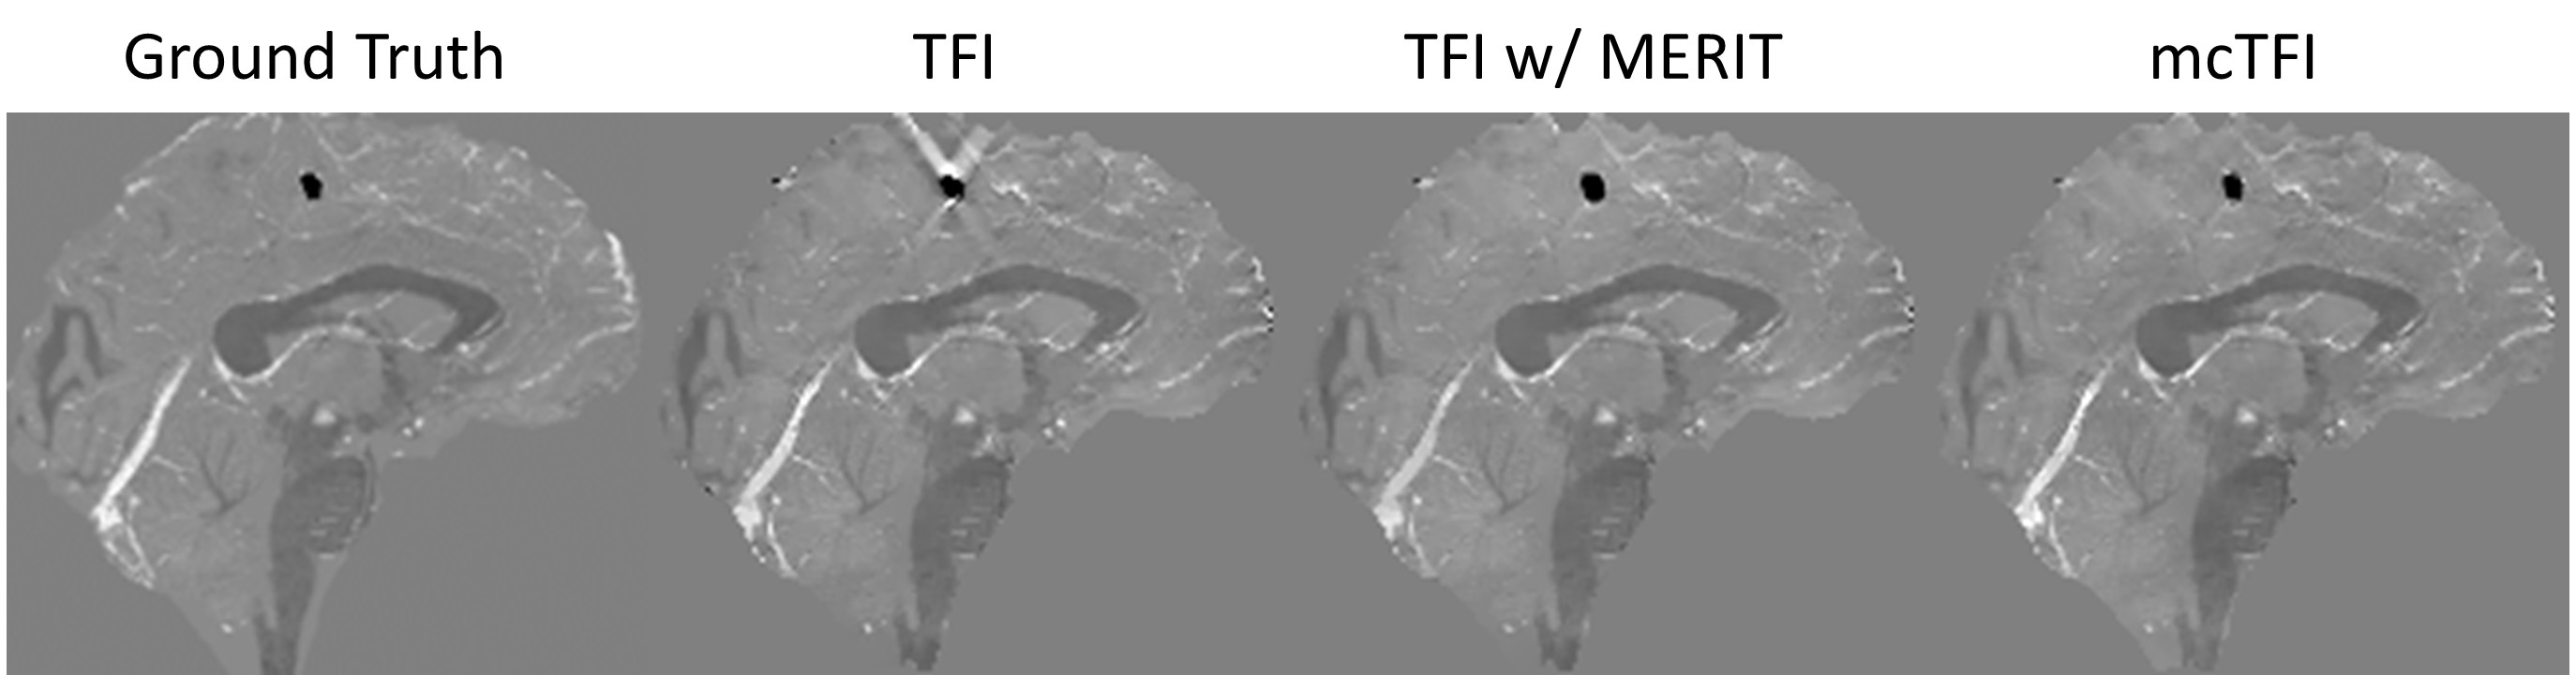
QSM Challenge 2.0:Table 1 shows the performance metrics evaluated according to the QSM challenge 2.0, where mcTFI consistently outperforms TFI with or without MERIT except for deviation from linear Slope for the SNR 2, with a low deviation of 0.021. This is further illustrated in Figure 1 showing a comparison of three methods with the ground truth. Note that mcTFI greatly improved the calcified lesion reconstruction as compared to either TFI method. TFI without MERIT suffers from considerable streaking around the calcification as expected. TFI with MERIT has a modestly enlarged depiction of the calcification and because streaking artifacts arising from the calcification, when present, intersect with the straight sinus (arrows), their removal using MERIT cause a small decrease in its estimated susceptibility compared to the ground truth. The mean straight sinus susceptibility values was 117.6ppb from ground truth, 106.0ppb from TFI, 95.9ppb from TFI with MERIT, and 103.5ppb from mcTFI.
Hemorrhage Brain:
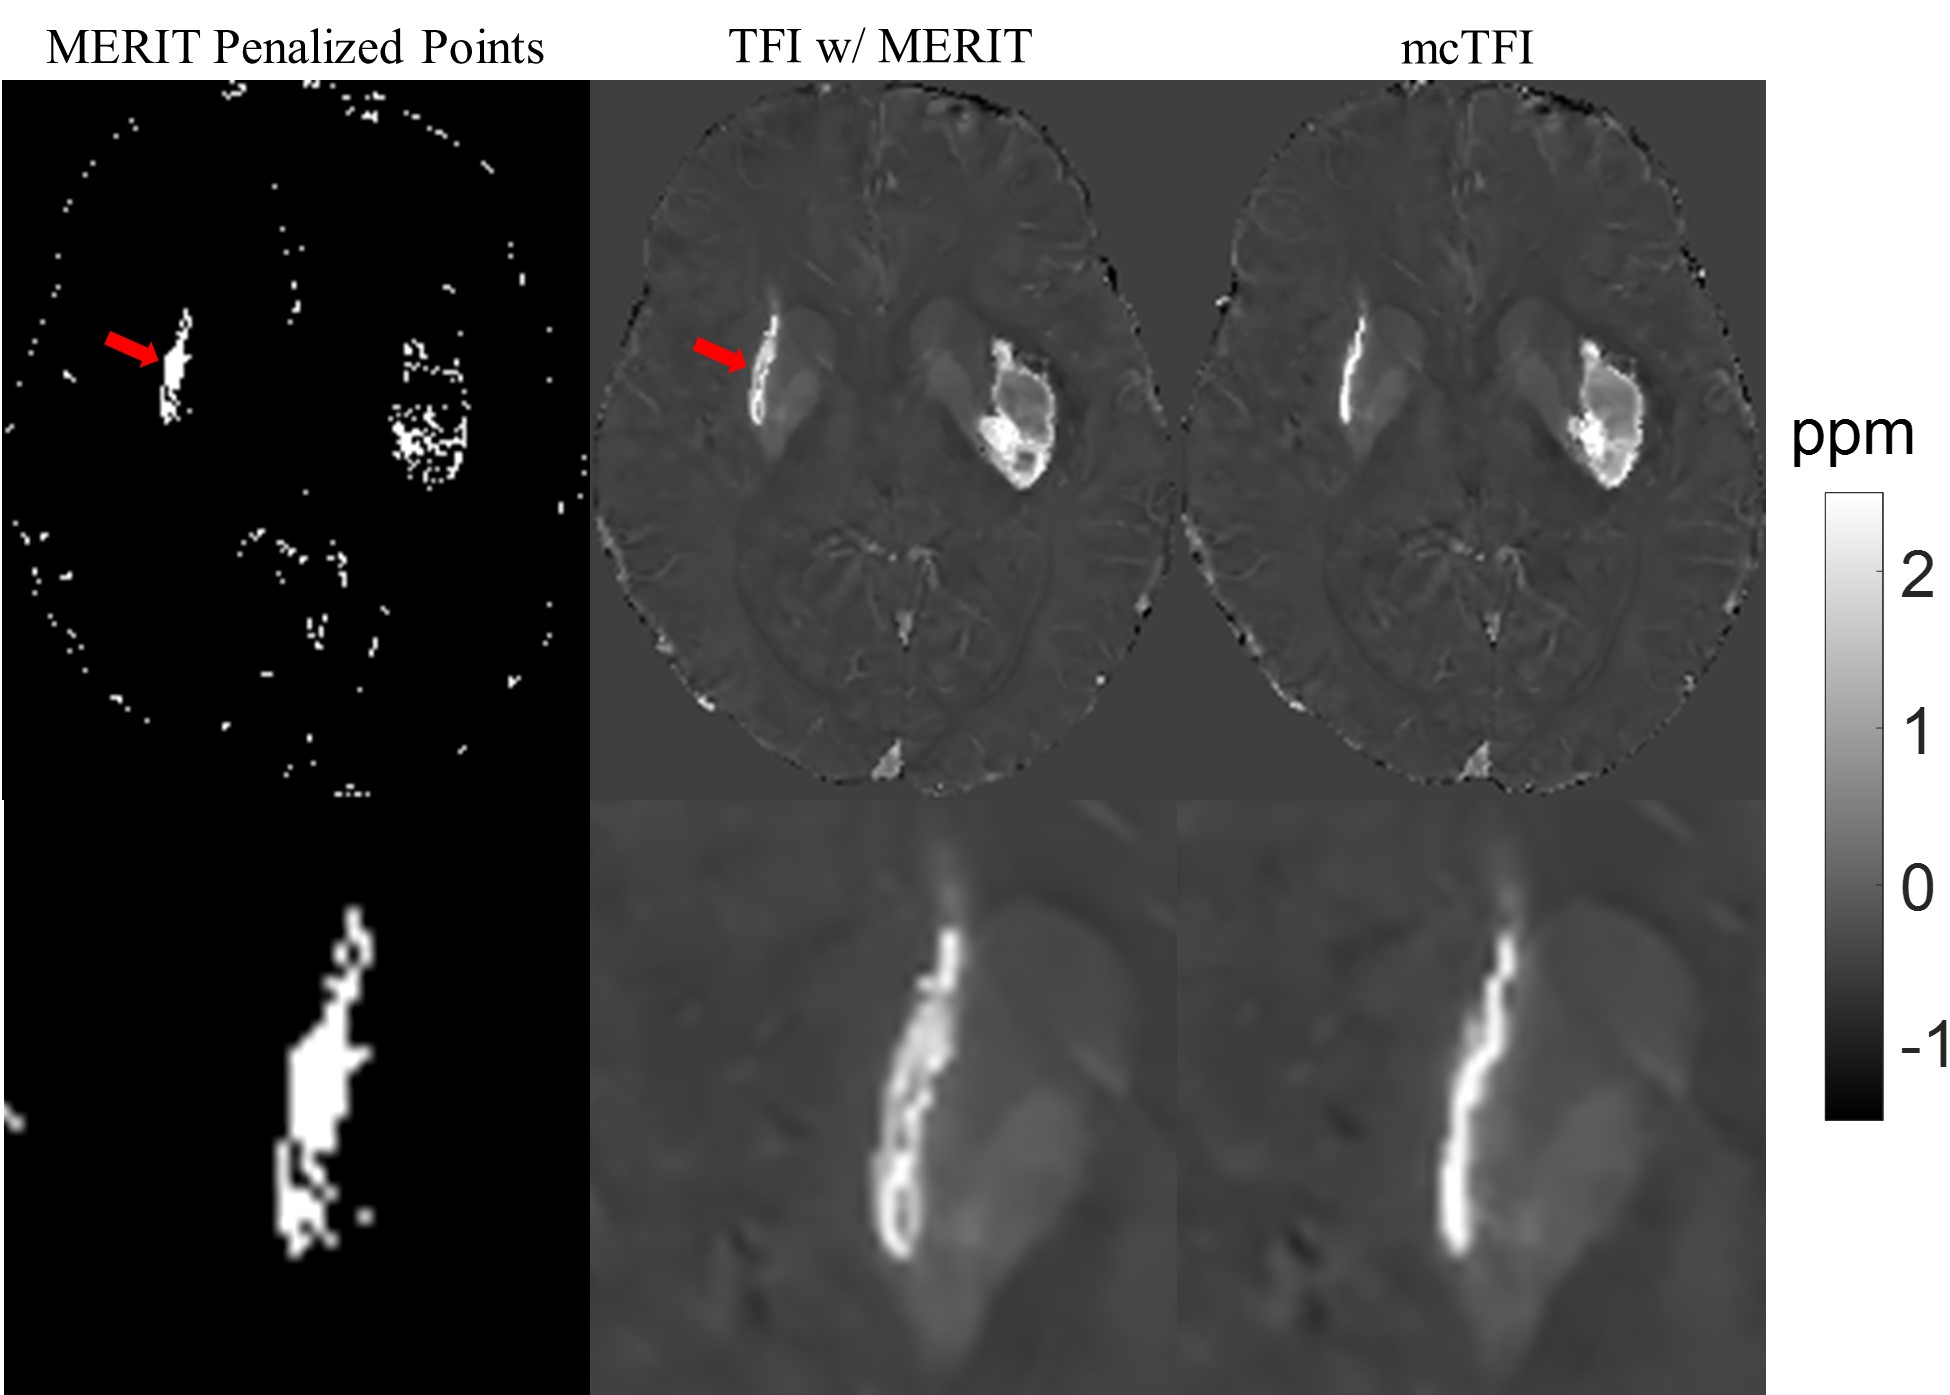
Figure 2 shows the QSM of a hemorrhage brain reconstructed using TFI with MERIT and mcTFI. The hemorrhage on TFI based QSM appeared to be larger and has a low susceptibility core (red arrow), whereas the hemorrhage on the mcTFI QSM is sharp.
Discussion
The multi-echo complex Total Field Inversion computes a susceptibility map directly from complex gradient echo data; improvement is expected because the noise model assumed in mcTFI is that of the acquired imaging data directly. Indeed, as evaluated on the simulated brain data from the QSM challenge 2.0, mcTFI outperformed TFI, especially in the region around the calcified lesion, where the voxels becomes noisy due to close proximity to strong susceptibility source. On the hemorrhage brain, the hemorrhage on the TFI reconstructed QSM appears larger compare the mcTFI reconstructed QSM. This may be due to MERIT penalizing most hemorrhage voxels, leading the solver to fit for the field around the hemorrhage first, resulting in a larger susceptibility source.Conclusion
This work introduces the multi-echo complex Total Field Inversion algorithm as a better way to model signal noise. It is shown to improve QSM reconstruction over prior total field methods.Acknowledgements
This work was supported in part from NIH grant R01NS072370, R01NS090464, R01NS095562, and R01CA181566.References
1. Rochefort L, Liu T, Kressler B, Liu J, Spincemaille P, Lebon V. Quantitative susceptibility map reconstruction from MR phase data using bayesian regularization: validation and application to brain imaging. Magn Reson Med 2010;63. 2. Wang Y, Liu T. Quantitative susceptibility mapping (QSM): Decoding MRI data for a tissue magnetic biomarker. Magnetic Resonance in Medicine 2015;73(1):82-101. 3. Wen Y, Weinsaft JW, Nguyen TD, Liu Z, Horn EM, Singh H, Kochav J, Eskreis‐Winkler S, Deh K, Kim J, Prince MR, Wang Y, Spincemaille P. Free breathing three-dimensional cardiac quantitative susceptibility mapping for differential cardiac chamber blood oxygenation – initial validation in patients with cardiovascular disease inclusive of direct comparison to invasive catheterization. JCMR 2019;In Presss. 4. Wang S, Liu T, Chen W, Spincemaille P, Wisnieff C, Tsiouris AJ, Zhu W, Pan C, Zhao L, Wang Y. Noise Effects in Various Quantitative Susceptibility Mapping Methods. IEEE Trans Biomed Eng 2013;60(12):3441-3448. 5. Liu T, Wisnieff C, Lou M, Chen W, Spincemaille P, Wang Y. Nonlinear formulation of the magnetic field to source relationship for robust quantitative susceptibility mapping. Magnetic Resonance in Medicine 2013;69(2):467-476. 6. Liu Z, Kee Y, Zhou D, Wang Y, Spincemaille P. Preconditioned total field inversion (TFI) method for quantitative susceptibility mapping. Magnetic Resonance in Medicine 2017;78(1):303-315. 7. Liu J, Liu T, de Rochefort L, Ledoux J, Khalidov I, Chen W, Tsiouris AJ, Wisnieff C, Spincemaille P, Prince MR, Wang Y. Morphology enabled dipole inversion for quantitative susceptibility mapping using structural consistency between the magnitude image and the susceptibility map. NeuroImage 2012;59(3):2560-2568. 8. Pei M, Nguyen TD, Thimmappa ND, Salustri C, Dong F, Cooper MA, Li J, Prince MR, Wang Y. Algorithm for fast monoexponential fitting based on Auto-Regression on Linear Operations (ARLO) of data. Magnetic resonance in medicine 2015;73(2):843-850. 9. Marques JP, Bilgic B, Meineke J, Milovic C, Chan K-s, van der Zwaag W, Hedouin R, Langkammer C, Schweser F. Towards QSM Challenge 2.0: Creation and Evaluation of a Realistic Magnetic Susceptibility Phantom. 27th ISMRM proceedings 2019:#1122.
Figures