3199
Recovering phase from homodyne filtered phase data using a residual dense network1Department of Physics and Astronomy, University of British Columbia, Vancouver, BC, Canada, 2UBC MRI Research Centre, University of British Columbia, Vancouver, BC, Canada, 3Department of Pediatrics, University of British Columbia, Vancouver, BC, Canada
Synopsis
In this work we train a residual dense network to recover homodyne filtered phase data. The proposed approach is able to accurately recover phase information. Susceptibility maps computed from the recovered phase yield the same accuracy as susceptibility maps computed from the original phase when compared to COSMOS.
Introduction
Standard susceptibility-weighted imaging (SWI) uses phase masks computed from high pass filtered phase images to enhance conspicuity of blood structures such as vessels or microbleeds. Filtering is performed by multiplying k-space with a low pass filter kernel, followed by complex division of the original data by the filtered data in image space. The phase of the resulting complex data has reduced phase wraps, apart from being high pass filtered. With clinical MRI scans, only such processed phase images but not the original phase images are stored. Since quantitative susceptibility mapping (QSM), which is based on the unfiltered phase, provides a wealth of information, it would be desirable to restore the original phase information from existing homodyne filtered phase. In this work we propose a residual dense network (RDN) for recovering the filtered data and demonstrate that the full local phase information is not lost.Methods
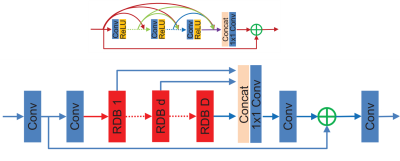
Suppose $$$f$$$ is the phase image that is the result of applying the nonlinear filter $$$w$$$ to the wrapped phase measurement $$$u$$$. Let $$$v$$$ denote a non-filtered version of $$$u$$$. Our goal is to recover $$$v$$$ from $$$f$$$. To do so, we introduce a residual dense network1 (Figure 1). The network parameters are: 16 residual dense blocks (RDB), 8 convolution layers per RDB block, growth rate = 16, 3x3 convolution kernels, and the # of filters is 64. Adam with decoupled weight decay (AdamW)2 was used to train the network, with a constant learning rate of 3e-4 and weight decay of 1e-5, and l1 was used as loss function. Training data was generated by randomly extracting 128x128 patches from 234 3D high-resolution GRE images (0.49x0.49x0.49mm)3 for a total of ~15k 2D images. 90% of the 3D volumes were used for training while the remaining 10% were used for testing. The complex images were homodyne filtered using a 96x96 hann window. Because we are interested in the local field in susceptibility mapping we apply Laplacian phase unwrapping4 and v-SHARP5 to the homodyne filtered phase in order to remove residual phase wraps and background fields. The homodyne filtered local field was then used as input to the RDN and the Laplacian unwrapped, v-SHARP background field removed, non-homodyne filtered, field was used as reference. No further data augmentation was performed. Batch size used was 10. The network was trained using a NVIDIA Quadro P6000 GPU with 24GB of memory. The network was implemented using the Julia programming language. The network took roughly 12 hours to train.Results
The table shows the mean mean root-mean-square-errors (RMSE) for the 25 high-resolution 3D images in the test set. The mean RMSE of the recovered phase compared to the original phase is 19%. Since the main goal of this approach is to enable QSM we further compute susceptibility maps6 from the recovered and true fields. When compared to COSMOS, the recovered homodyne filtered susceptibility maps achieve the same accuracy than the susceptibility maps computed from their original phase. Figure 2 shows the recovered phase compared to the homodyne filtered and reference phase. The recovered phase looks identical to the reference. Figure 3 shows the susceptibility maps computed from the three phases in Figure 2. The susceptibility maps also look identical.Discussion and Conclusion
In this work propose to recover phase from homodyne filtered phase data using a residual dense network. The proposed approach has short training times (< 0.5 days) and can be quickly adapted to accomodate different Hann window sizes and acquisition protocols. This method can be used to perform QSM on clinical SWI scans where usually only the homodyne filtered phase is stored.Acknowledgements
Natural Sciences and Engineering Research Council of Canada, Grant/Award Number 016-05371 and the Canadian Institutes of Health Research, Grant Number RN382474-418628.References
1. Zhang, Y., Tian, Y., Kong, Y., Zhong, B. & Fu, Y. Residual Dense Network for Image Super-Resolution. in 2018 IEEE/CVF Conference on Computer Vision and Pattern Recognition 2472–2481 (2018). doi:10.1109/CVPR.2018.00262.
2. Loshchilov, I. & Hutter, F. Decoupled Weight Decay Regularization. ArXiv171105101 Cs Math (2017).
3. Weber, A. M. et al. Pathological Insights From Quantitative Susceptibility Mapping and Diffusion Tensor Imaging in Ice Hockey Players Pre and Post-concussion. Front. Neurol. 9, (2018).
4. Schofield, M. A. & Zhu, Y. Fast phase unwrapping algorithm for interferometric applications. Opt. Lett. 28, 1194–1196 (2003).
5. Wu, B., Li, W., Guidon, A. & Liu, C. Whole brain susceptibility mapping using compressed sensing. Magn. Reson. Med. 67, 137–147 (2012).
6. Kames, C., Wiggermann, V. & Rauscher, A. Rapid two-step dipole inversion for susceptibility mapping with sparsity priors. NeuroImage 167, 276–283 (2018).
Figures


