3197
Sharper Images in Quantitative Susceptibility Mapping with Magnetometric Dipole Kernels1Center for Funcionally Integrative Neuroscience, Institute of Clinical Medicine, Aarhus University, Aarhus, Denmark, 2Department of Physics and Astronomy, Aarhus University, Aarhus, Denmark
Synopsis
The purpose of this study is to consider the GRE signal phase in a voxel for short echo times, from an MRI-visible fluid induced by MRI-invisible magnetic inclusions. We find that the signal phase relates to the magnetometric demagnetization field. In Fourier space, this defines a magnetometric dipole kernel which can be used to perform QSM. Using the data from the 2016 QSM challenge, we show that applying the magnetometric dipole kernel increases the sharpness, and that it is possible to increase the sharpness of already made STI susceptibility maps.
Introduction
Quantitative susceptibility mapping (QSM) is a potential method in MRI for mapping the magnetic microstructure of the brain1. In current QSM2-5, the gradient recalled echo (GRE) signal phase is related to a discrete convolution between an apparent bulk magnetic susceptibility tensor (BMST) and the point-dipole kernel. In this study, we show that the contribution from the demagnetization field measured in a voxel, for short echo times, is related instead to the magnetometric demagnetization field. This introduces a new “magnetometric dipole kernel” for QSM. We implemented this new technique and tested it on the 2016 QSM Challenge6 phase data, where this lead to sharper looking susceptibility maps.Methods
Consider a medium with impermeable, MRI-invisible magnetic inclusions with an associated susceptibility tensor $$$\chi_{\alpha\beta}(\vec{r})$$$ relative to the surrounding MRI-visible fluid. The water containing volume is characterized by the indicator function $$$u(\vec{r})$$$ equal to one inside the fluid and zero otherwise. When placed in a static magnetic field $$$(B_0)_\alpha=B_0n_\alpha$$$ along $$$\hat{n}$$$, the inclusions generate a secondary field which induces a shift in the local Larmor frequency in the MRI-visible fluid7$$\Delta\Omega(\vec{r})=u(\vec{r}){\gamma}B_{0}n_{\alpha}\left\{\int_{LC(\vec{r})}d\vec{r}^{\prime} N_{\alpha\beta}^{(P)}\left(\vec{r}-\vec{r}^{\prime}\right)\chi_{\beta\gamma}\left(\vec{r}^{\prime}\right)-{\int}d \vec{r}^{\prime}N_{\alpha\beta}^{(P)}\left(\vec{r}-\vec{r}^{\prime}\right)\chi_{\beta\gamma}\left(\vec{r}^{\prime}\right)\right\}n_{\gamma},$$ where
$$N_{\alpha\beta}^{(P)}(\vec{r})=\frac{3r_{\alpha}r_{\beta}-\delta_{\alpha\beta}}{r^{3}}$$
is the elementary dipole field and $$$"LC(\vec{r})"$$$ denotes the region of the local Lorentz cavity field correction at $$$\vec{r}$$$, where the shape of the cavity accounts for the magnetic microstructure8, and a zero average field inside by summation of the explicit dipole fields, from the near environment of $$$\vec{r}$$$.
The normalized GRE signal in the rotating frame from the MRI-visible fluid within a volume $$$V_i$$$ exposed to this field perturbation is given by the ensemble average $$$\langle\cdot\rangle_{\mathrm{spin}}$$$
$$S(t,i)=\left\langle{e^{i\varphi(t,i))}}\right\rangle_{\mathrm{spin}},\quad\varphi(t,i)=\int_{0}^{t}dt^{\prime} \Delta\Omega\left(t^{\prime},i\right),$$
where $$$"i"$$$ denote the center of the voxel $$$V_i$$$, and $$$\Delta \Omega\left(t,i\right)$$$ is the instantaneous Larmor frequency offset felt by a spin along its trajectory within the volume $$$V_i$$$. Assuming that the signal is sampled at a sufficiently short echo time, so the diffusion length is much shorter than the characteristic length scale of the induced field, the signal can be characterized by the first cumulant $$$\left\langle\varphi(t,i)\right\rangle=\left\langle\Omega \right\rangle_it$$$, where $$$\left\langle\cdot\right\rangle_i$$$ denotes a spatial average over $$$V_i$$$. The signal phase then arises as a spatial average over the entire medium, which we sub-divide into voxels of volume $$$V_j$$$
$$\begin{aligned}\langle\Delta\Omega\rangle_{i}={\gamma}B_{0}n_{\alpha}\frac{1}{\zeta_{i}V_{i}} \int_{V_{i}}d\vec{r}^{\prime}u\left(\vec{r}^{\prime}\right)\left\{\int_{LC\left(\vec{r}^{\prime}\right)}d\vec{r}^{\prime\prime}N_{\alpha\beta}^{(P)}\left(\vec{r}^{\prime}-\vec{r}^{\prime\prime}\right)\chi_{\beta\gamma}\left(\vec{r}^{\prime\prime}\right)-\sum_{j}\int_{V_{j}}d\vec{r}^{\prime\prime}N_{\alpha\beta}^{(P)}\left(\vec{r}^{\prime}-\vec{r}^{\prime\prime}\right)\chi_{\beta\gamma}\left(\vec{r}^{\prime\prime}\right)\right\}n_{\gamma}, \end{aligned}$$ where $$$\zeta_i$$$ denotes the MRI-visible volume fraction in $$$V_i$$$. The indicator function, dipole field and magnetic susceptibility can also be expressed by their voxel averages $$\begin{aligned}u\left(\vec{r}^{\prime}\right)=\frac{1}{V_{i}} \int_{V_{i}}d\vec{r}^{\prime\prime}u\left(\vec{r}^{\prime\prime}\right)+\delta{u}\left(\vec{r}^{\prime}\right)=\zeta_{i}+\delta{u}\left(\vec{r}^{\prime}\right),\\
N_{\alpha\beta}^{(P)}\left(\vec{r}^{\prime}-\vec{r}^{\prime\prime}\right)= \frac{1}{V_j}\int_{V_j}d\vec{r}^{\prime\prime\prime}N_{\alpha\beta}^{(P)}\left(\vec{r}^{\prime}-\vec{r}^{\prime\prime\prime}\right)+\delta N_{\alpha \beta}^{(P)}\left(\vec{r}^{\prime}-\vec{r}^{\prime\prime}\right),\\\chi_{\alpha\beta}\left(\vec{r}^{\prime\prime}\right)= \frac{1}{V_j}\int_{V_j}d\vec{r}^{\prime\prime\prime}\chi_{\alpha\beta}\left(\vec{r}^{\prime\prime\prime}\right)+\delta\chi_{\alpha\beta}\left(\vec{r}^{\prime\prime}\right).\end{aligned}$$
Assuming $$$\zeta_i\approx1$$$, a low intra-voxel variation in the susceptibility and demagnetization tensor convolution $$$\sum_{j}\int_{V_{j}}d\vec{r}^{\prime\prime}{\delta}N_{\alpha\beta}^{(P)}\left(\vec{r}^{\prime}-\vec{r}^{\prime\prime}\right)\delta\chi_{\beta\gamma}\left(\vec{r}^{\prime\prime}\right)\approx{0}$$$ and that the average Larmor correction within $$$V_i$$$ corresponds to an isotropic magnetic compartment, we obtain an average Larmor frequency shift
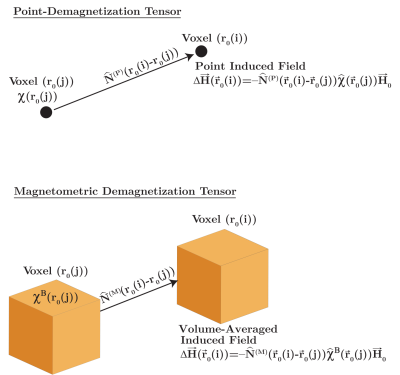
$$\begin{aligned}\langle\Delta\Omega\rangle_{i}&={\gamma}B_{0}n_{\alpha}\left\{\frac{1}{3} \delta_{\alpha\beta}\chi_{\beta\gamma}^{B}(i)-\sum_{j}N_{\alpha\beta}^{(M)}(i-j)\chi_{\beta\gamma}^{B}(j)\right\}n_{\gamma},\\N_{\alpha\beta}^{(M)}(i-j)&\equiv\frac{1}{V_{i}}\int_{V_{i}}d\vec{r}^{\prime}\int_{V_{j}}d\vec{r}^{\prime\prime}N_{\alpha\beta}^{(P)}\left(\vec{r}^{\prime}-\vec{r}^{\prime\prime}\right),\end{aligned}$$ where $$$\chi_{\alpha\beta}^{B}(j)\equiv\frac{1}{V_{j}}\int_{V_{j}}d\vec{r}^{\prime\prime}\chi_{\alpha\beta}\left(\vec{r}^{\prime\prime}\right)$$$ and $$$N_{\alpha\beta}^{(M)}(i-j)$$$ denotes the BMST and magnetometric demagnetization tensor respectively. Figure 1 illustrates the difference between $$$N_{\alpha\beta}^{(M)}$$$ and $$$N_{\alpha\beta}^{(P)}$$$. In Fourier space we obtain
$$\begin{aligned}\langle\Delta \Omega\rangle_{i}(\vec{k})&={\gamma}B_{0}n_{\alpha}K_{\alpha\beta}^{(M)}(\vec{k})\chi_{\beta\gamma}^{B}(\vec{k})n_{\gamma},\\K_{\alpha\beta}^{(M)}(\vec{k})&\equiv\frac{1}{3}\delta_{\alpha\beta}-N_{\alpha\beta}^{(M)}(\vec{k}),\end{aligned}$$ where $$$K_{\alpha\beta}^{(M)}(\vec{k})$$$ defines the magnetometric dipole kernel, which yields a different demagnetization field compared to the point-dipole kernel9,10 $$K_{\alpha\beta}^{(P)}(\vec{k})=\frac{1}{3}\delta_{\alpha\beta}-N_{\alpha\beta}^{(P)}(\vec{k})=\frac{1}{3}\delta_{\alpha\beta}-\frac{k_{\alpha}k_{\beta}}{k^{2}}.$$ For rectangular voxels with dimensions $$$\left(d_{x},d_{y},d_{z}\right),$$$ $$$N_{\alpha\beta}^{(M)}\left(i-j)\right)=N_{\alpha\beta}^{(M)}(x,y,z)$$$ can be calculated analytically11,12
$$N_{\alpha\beta}^{(M)}(x,y,z)=\frac{1}{4{\pi}d_{x}d_{y} d_{z}}\sum_{\epsilon_{1},\epsilon_{2},\epsilon_{3}=-1}^{1}\frac{8}{(-2)^{\left(\left|\epsilon_{1}\right|+\left|\epsilon_{2}\right|+\left|\epsilon_{3}\right|\right)}}\Phi_{\alpha\beta}\left(x+\epsilon_{1}d_{x},y+\epsilon_{2}d_{y},z+\epsilon_{3}d_{z}\right),$$ with auxiliary functions
$$\begin{aligned}\Phi_{xx}=&\frac{1}{6}\left(2x^{2}-y^{2}-z^{2}\right)R+\frac{1}{2}y\left(z^{2}-x^{2}\right)\log(y+R)+\frac{1}{2}z\left(y^{2}-x^{2}\right)\log(z+R)-xyz\operatorname{atan}\left(\frac{yz}{xR}\right),\\\Phi_{xy}=&-\frac{1}{3}xyz+xyz\log(z+R)+\frac{1}{6}y\left(3z^{2}-y^{2}\right)\log(x+R)+\frac{1}{6}x\left(3z^{2}-x^{2}\right)\log(y+R)\\&-\frac{1}{6}z^{3}\operatorname{atan}\left(\frac{xy}{zR}\right)-\frac{1}{2}y^{2}z\operatorname{atan}\left(\frac{xz}{yR}\right)-\frac{1}{6}x^{2}\operatorname{atan}\left(\frac{yz}{xR}\right),\\R=&\sqrt{x^{2}+y^{2}+z^{2}}.\end{aligned}$$ The remaining components are given by cyclic permutation and the symmetry of the auxiliary functions.
Application:
As the average frequency shift has the same functional form as in previous QSM methods, it is straightforward to adapt an LSQR algorithm for “Magnetometric” STI (MSTI). Based on phase data openly available from the 2016 QSM challenge6 we estimate the apparent BMST based on regular STI and MSTI.
Results
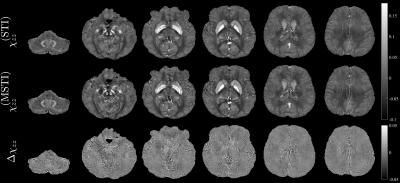
Figure 2 shows $$$\chi_{zz}^{(MSTI)}$$$, $$$\chi_{zz}^{(STI)}$$$, and $$$\Delta\chi_{zz}=\chi_{zz}^{(MSTI)}-\chi_{zz}^{(STI)}$$$ from the 2016 QSM challenge phase data based on both STI and MSTI LSQR algorithms.Discussion
Figure 2 demonstrates an obvious improvement in the sharpness of MSTI compared to STI, with much more detail visible in MSTI. The reason for this effect, when performing STI, stems from not performing the spatial averaging over $$$V_i$$$ and $$$V_j$$$ in STI. To estimate the relationship between the susceptibility derived from $$$K_{\alpha\beta}^{(M)}$$$ and $$$K_{\alpha\beta}^{(P)},$$$ we define a BMST $$$\tilde{\chi}_{\alpha\beta}^{B}(j)$$$ by forcing the equality$$\langle\Delta\Omega\rangle_{i}={\gamma}B_{0}n_{\alpha}\left[\frac{1}{3}\delta_{\alpha\beta}\tilde{\chi}_{\beta\gamma}^{B}(i)-\sum_{j}N_{\alpha\beta}^{(P)}(i-j)\tilde{\chi}_{\beta\gamma}^{B}(j)\right] n_{\gamma},$$
which leads to a LSQR expression
$$\tilde{\chi}_{\beta\gamma}^{B}(\vec{k})=\left(K_{\beta\rho}^{(P)}(\vec{k})K_{\rho\mu}^{(P)}(\vec{k})\right)^{-1}K_{\mu\epsilon}^{(P)}(\vec{k})K_{\epsilon\alpha}^{(M)}(k)\chi_{\alpha\gamma}^{B}(\vec{k})\equiv{T_{\beta\alpha}}\left[\chi_{\alpha\gamma}^{B}(\vec{k})\right],$$
where $$$T_{\beta\alpha}$$$ defines a linear transformation between the susceptibilities. This is visualized in figure 3 by applying $$$T_{\beta\alpha}$$$ on $$$\chi_{zz}^{(STI)}$$$ and $$$\chi_{zz}^{(MSTI)}$$$.
Limitations:
$$$K_{\alpha\beta}^{(M)}$$$ shares other model assumptions with $$$K_{\alpha\beta}^{(P)}$$$, such as a high water fraction, a low intra-voxel variation in both susceptibility and demagnetization tensor components, and an average spherical Lorentz cavity. These assumptions are violated in many areas of the brain13, such as in white matter, and must be properly accounted for. Calculating the components of $$$N_{\alpha\beta}^{(M)}$$$ must also be done with high numerical precision as they are prone to catastrophic cancellation.
Conclusion
By examining the voxel signal for short echo times from an MRI-visible fluid surrounded by MRI-invisible magnetic inclusions, we find that the voxel-averaged Larmor frequency shift is related to the magnetometric demagnetization field. This defines a new “magnetometric dipole kernel”. Using the phase data from the 2016 QSM Challenge, we find that the magnetometric dipole kernel increases the sharpness of the apparent BMST maps. In the future, more work will be put in to relaxing the model assumptions further, evaluating the accuracy and regime of validity, and hopefully, getting QSM one step closer to becoming a useful tool in mapping important biomarkers of neurodegenerative diseases.Acknowledgements
This study is funded by the Independent Research Fund (grant 8020-00158B), Denmark. The authors would like to thank PhD student Jonas Lynge Olesen for many fruitful discussions.References
1. Deistung, Andreas,
Ferdinand Schweser, and Jürgen R. Reichenbach. "Overview of quantitative susceptibility mapping." NMR in Biomedicine 30.4 (2017): e3569.
2. Liu, Chunlei.
"Susceptibility tensor imaging." Magnetic Resonance in Medicine: An
Official Journal of the International Society for Magnetic Resonance in
Medicine 63.6 (2010): 1471-1477.
3. Liu, Tian, et al.
"Calculation of susceptibility through multiple orientation sampling
(COSMOS): a method for conditioning the inverse problem from measured magnetic
field map to susceptibility source image in MRI." Magnetic Resonance in Medicine: An
Official Journal of the International Society for Magnetic Resonance in
Medicine 61.1 (2009): 196-204.
4. Marques, J. P., and R. Bowtell. "Application of a Fourier‐based method for rapid calculation of field inhomogeneity due to spatial variation of magnetic susceptibility." Concepts in Magnetic Resonance Part B: Magnetic Resonance Engineering: An Educational Journal 25.1 (2005): 65-78.
5. Salomir, Rares, Baudouin Denis de Senneville, and Chrit TW Moonen. "A fast calculation method for magnetic field inhomogeneity due to an arbitrary distribution of bulk susceptibility." Concepts in Magnetic Resonance Part B: Magnetic Resonance Engineering: An Educational Journal 19.1 (2003): 26-34.
6. Langkammer, Christian, et al. "Quantitative susceptibility mapping: report from the 2016 reconstruction challenge." Magnetic resonance in medicine 79.3 (2018): 1661-1673.
7. Dickinson, W. C. "The time average magnetic field at the nucleus in nuclear magnetic resonance experiments." Physical Review 81.5 (1951): 717.
8. Kiselev, Valerij G. "Larmor frequency in heterogeneous media." Journal of Magnetic Resonance 299 (2019): 168-175.
9. Tandon, S., et al. "On the computation of the demagnetization tensor for uniformly magnetized particles of arbitrary shape. Part I: Analytical approach." Journal of Magnetism and Magnetic Materials 271.1 (2004): 9-26.
10. Beleggia, M., and M. De Graef. "On the computation of the demagnetization tensor field for an arbitrary particle shape using a Fourier space approach." Journal of magnetism and magnetic materials 263.1-2 (2003): L1-L9.
11. Newell, Andrew J., Wyn Williams, and David J. Dunlop. "A generalization of the demagnetizing tensor for nonuniform magnetization." Journal of Geophysical Research: Solid Earth 98.B6 (1993): 9551-9555.
12. Donahue, Michael J.
"Accurate computation of the demagnetization tensor." 6th International Symposium on
Hysteresis Modeling and Micromagnetics. Vol. 20. No. 07. 2007.
13. Yablonskiy, Dmitriy A., and Alexander L. Sukstanskii. "Effects of biological tissue structural anisotropy and anisotropy of magnetic susceptibility on the gradient echo MRI signal phase: theoretical background." NMR in Biomedicine 30.4 (2017): e3655.
Figures


