3196
SOJU-Net—Denoising MR phase images with physics-informed deep learning using artificial Rician noise augmentation1Department of Computer Science and Automation, Technische Universität Ilmenau, Ilmenau, Germany, 2Buffalo Neuroimaging Analysis Center, Dept. of Neurology, Jacobs School of Medicine and Biomedical Sciences, University at Buffalo, The State University of New York, Buffalo, NY, United States, 3Center for Biomedical Imaging, Clinical and Translational Science Institute, University at Buffalo, The State University of New York, Buffalo, NY, United States
Synopsis
Phase noise follows the Rician distribution, with a non-linear dependency of the phase noise on the local magnitude signal intensity. In this work, we present SOJU-Net, a deep-learning based denoising for MR phase images. SOJU-Net reduces Rician noise while preserving boundary contrast.
Introduction
Susceptibility-weighted MRI phase images form the basis of methods such as Susceptibility Weighted Imaging (SWI) and Quantitative Susceptibility Mapping (QSM).3 Phase noise follows the Rician distribution,1 with a non-linear dependence of the phase noise on the local magnitude signal intensity.1QSM is known to suffer from noise amplification and streaking artifacts if the Rician noise model is not properly incorporated into the solution algorithm. Regularization can mitigate noise amplification but often comes at the cost of overly smoothed solutions. The reconstruction of veins is particularly prone to noise-related artifacts because of the low magnitudes signal in their lumen and their small spatial diameter.
In this work, we present SOJU-Net, deep-learning-based denoising for MR phase images. SOJU-Net reduces Rician noise while preserving boundary contrast.
Methods
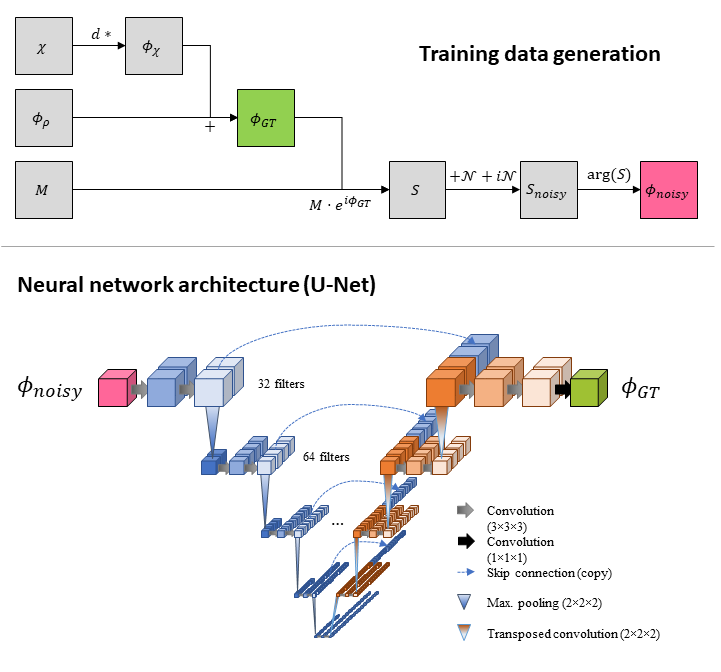
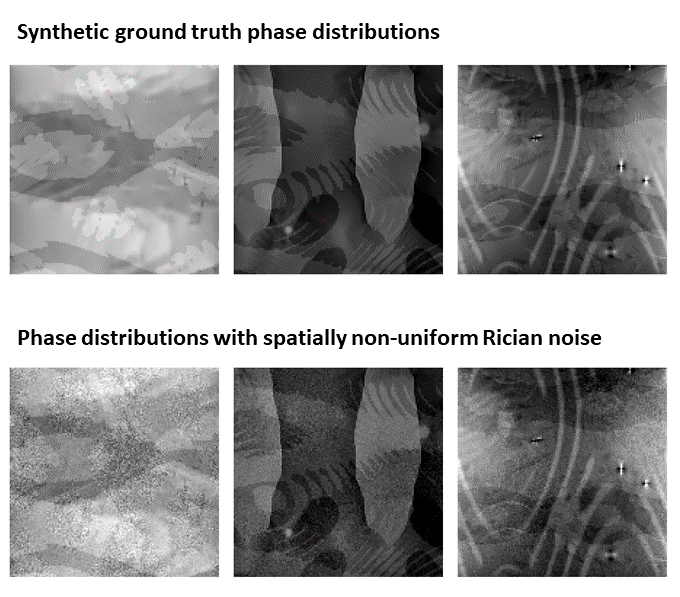
Neural network architecture: We built a deep convolutional neural network (U-Net [1]) with same-sized, volumetric, scalar in- and outputs (Tensorflow 2.0) to predict denoised phase images $$$\phi$$$ from noisy phase images $$$\phi_\mathrm{noisy}$$$ (see Figure 1-bottom).Physics-informed network training: We generated random synthetic training samples of $$$\phi$$$ (Fig. 2) from each two source patterns: $$$\chi$$$ for isotropic magnetic susceptibility and $$$f_{\rho}$$$ representing all non-susceptibility phase-contrast contributions:
$$\phi = d * \chi + \phi_{\rho},$$
where $$$*$$$ denotes the 3D convolution and $$$d$$$ is the unit dipole with Lorentzian sphere correction. A third type of random pattern was generated to represent magnitudes $$$M$$$. Rician phase noise was simulated by adding Gaussian noise to the complex signal
$$S = M * e^{i\phi}$$
(see Figure 1). We trained the network with samples from a pool of 1200 phase and magnitude images, which were randomly augmented on-the-fly (see Figure 2 for examples of the training data). The training with ADAM optimization2 on six GPUs (NVIDIA GeForce RTX 2080 Ti) converged after about 50,000 steps. To evaluate how denoising affected QSM, we employed a DeepQSM-style U-Net.4
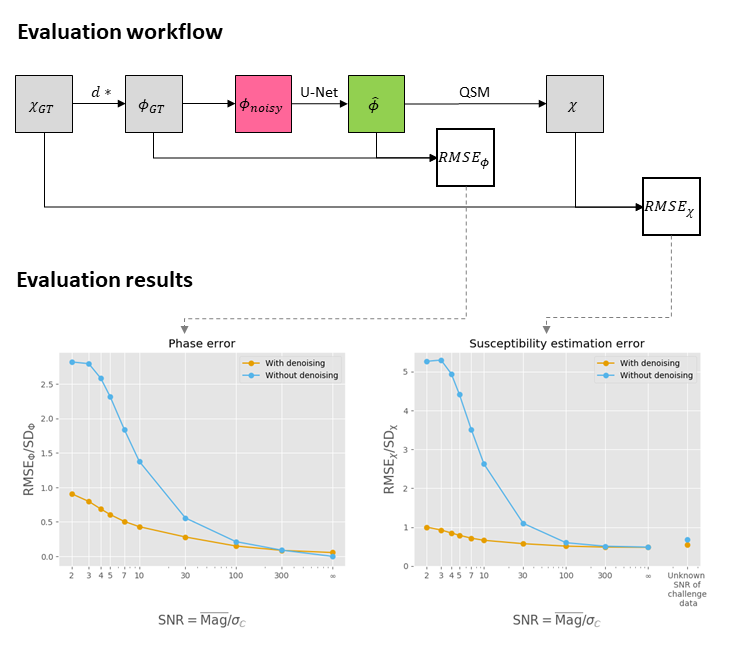
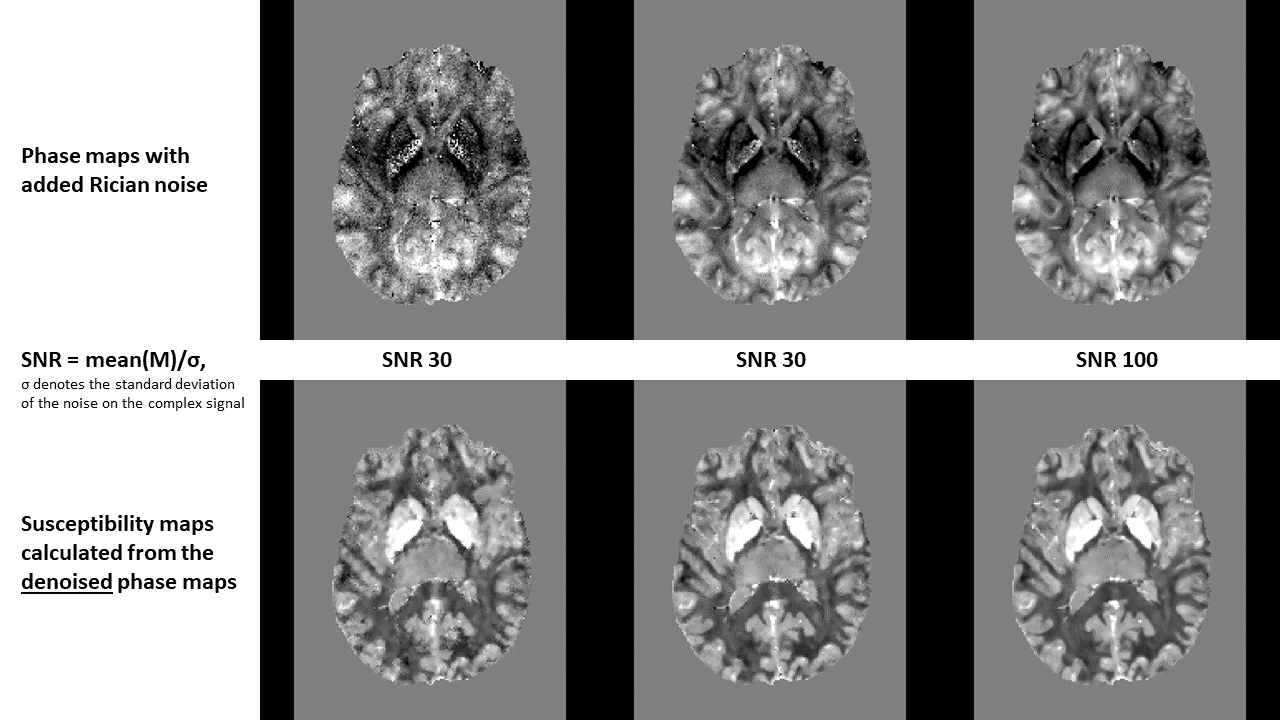
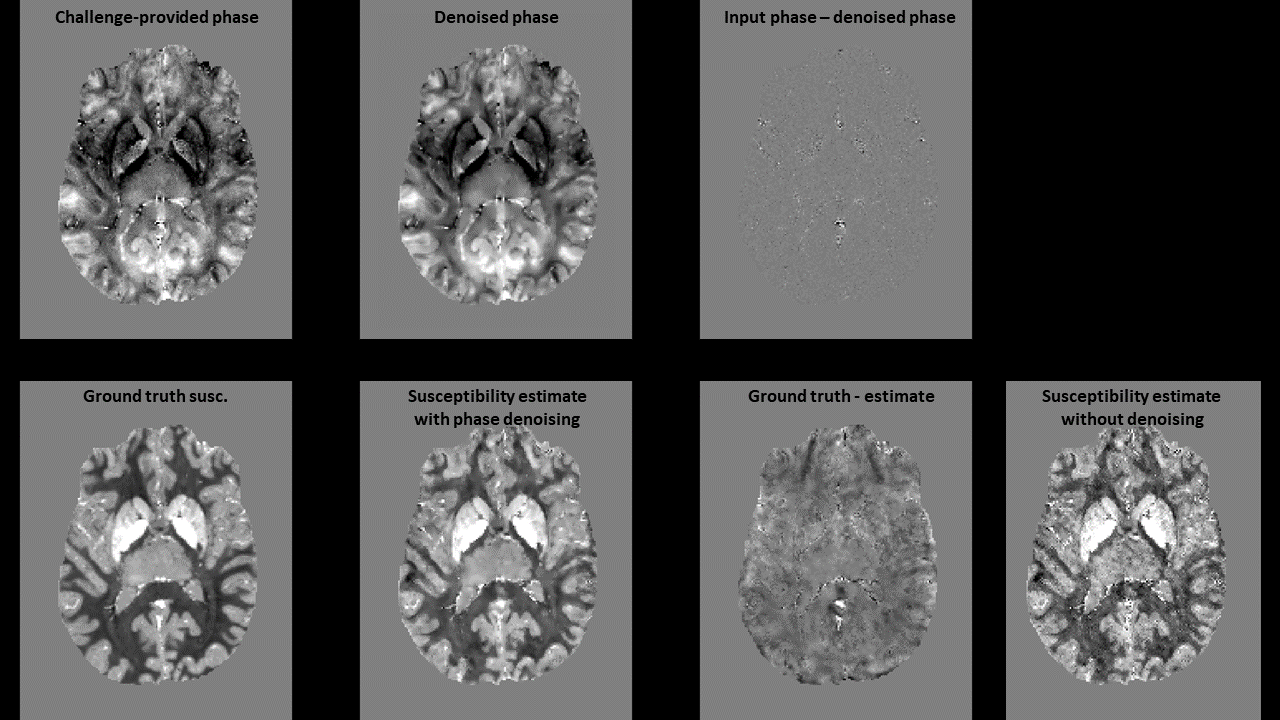
Evaluation: We evaluated the denoising performance using the realistic brain model of the 2019 QSM reconstruction challenge (Stage 2, Sim2Snr1). We simulated phase images with different levels of Rician noise and calculated the RMS error between the ground truth phase and the denoised estimate (Figure 3). Subsequently, we applied DeepQSM to the denoised phase images and calculated the RMS error with respect to the ground truth susceptibility map. Secondly, we evaluated the improvements to susceptibility mapping from denoising the challenge-provided frequency map (scaled to a phase map). In addition to the RMSE, we assessed the results visually.
Results
SOJU-Net successfully reduced noise in phase images and artifacts in susceptibility maps at low SNR values and preserved image features at high SNR values (Figure 3-bottom). Figure 5 presents the application to the 2019 QSM challenge dataset. After denoising the phase images, noise amplification artifacts in the susceptibility were substantially mitigated. Application of SOJU-Net took less than 30 seconds on a desktop CPU.Discussion
Our results illustrate the ability of deep neural networks to learn the generic patterns of Rician noise and effectively eliminate them while preserving boundary contrast. SOJU-Net works for all SNR levels without adjustment of the noise level in the training data. Further improvement of denoising performance may be achieved by incorporating the magnitude into the network architecture. A systematic comparison against existing MR denoising methods is ongoing.Conclusion and Outlook
Physics-informed deep learning allows incorporating domain knowledge such as the Rician noise distribution and--once trained--can provide a fast, powerful and parameter-free solution to denoising MR phase images.Acknowledgements
As an homage to the country of this year’s QSM Workshop in Seoul, we named our method to annihilate Rice distributed noise after a Korean method to annihilate rice--the liquor Soju.
Research reported in this publication was funded by the National Center for Advancing Translational Sciences of the National Institutes of Health under Award Number UL1TR001412. The content is solely the responsibility of the authors and does not necessarily represent the official views of the NIH.
References
[1] O. Ronneberger, P. Fischer, and T. Brox, “U-Net: Convolutional Networks for Biomedical Image Segmentation,” ArXiv150504597 Cs, May 2015.
[2] D. P. Kingma and J. Ba, “Adam: A Method for Stochastic Optimization,” Dec. 2014.
[3] F. Schweser, K. Sommer, A. Deistung, and J. R. Reichenbach, “Quantitative susceptibility mapping for investigating subtle susceptibility variations in the human brain,” NeuroImage, vol. 62, no. 3, pp. 2083–2100, Sep. 2012.
[4] S. Bollmann et al., “DeepQSM - using deep learning to solve the dipole inversion for quantitative susceptibility mapping,” NeuroImage, vol. 195, pp. 373–383, Jul. 2019.
Figures