3194
Feasibility of magnetic resonance based electrical properties tomography with deep learned reconstruction based denoising1Department of Radiology, Haeundae Paik Hospital, Busan, Republic of Korea, 2MR Collaboration and Development, GE Healthcare, Calagary, AB, Canada, 3Department of Electrical and Electronic Engineering, Yonsei University, Seoul, Republic of Korea, 4MR Collaboration and Development, GE Healthcare, Seoul, Republic of Korea
Synopsis
With advances in deep learning, feasibility has been investigated for MREPT reconstruction showing interesting results. However whether images denoised with deep learned reconstruction will improve EPT map quality has not been investigated. After denoising of complex data acquired with a DL algorithm, EPT maps were generated with phase based 2D-weighted polynomial fitting. Use of DL, shows better results as compared to conventionally generated maps (i.e. decreased NRMSE, increased PSNR and SSIM, with increasing denoising levels), and results in sharper appearing maps. Spreading of boundary artifacts are not observed with increasing denoising factors.
Introduction
Magnetic resonance-based electrical properties tomography (MREPT), is a rapidly evolving field, with clinical translation mostly applied in the oncologic field, such as breast cancer1,2, brain tumor3, to name a few.With advances in deep learning, feasibility has been investigated for MREPT reconstruction showing interesting results4,5, however, whether images denoised with deep learned reconstruction will improve image quality has not been investigated. Since signal to noise ratio (SNR) of the radiofrequency transmit field (B1+) is the most dominant factor for MREPT reconstruction, sufficient SNR needs to be reached at the time of acquisition6. Therefore, we hypothesized that deep learned reconstruction based denoising (DL) for MREPT may improve the quality of conductivity maps.
Methods
[Data Acquisition]Images were acquired on a healthy volunteer, with a 3T MRI scanner (Signa Architect, GE Healthcare, Waukesha, WI, USA), with a quadrature birdcage transmit-receive coil.
The required phase for conductivity reconstruction was calculated with complex data from multi-slice T2‐weighted fast spin echo (FSE) images that were acquired with the following parameters: number of slices = 3 (4 mm thickness, 0.4 mm interslice gap); matrix size = 192 × 192 or 256 x 256; field of view = 256 × 256 mm; repetition time = 4500 ms; effective TE = 102 ms; Echo Train Length = 20; and total scan time = 0:50 or 1:08 min, respectively per number of excitation (NEX). 1, and 4 NEX images were acquired for each matrix size.
[Image Reconstruction]
DLRecon is a new deep learning-based MR reconstruction, which comprises a deep convolutional residual encoder network trained using a database of over 10,000 images to achieve images with high SNR and high spatial resolution. The acquired data were retrospectively reconstructed with and without DLRecon at denoising levels of 50% (DL50), 70% (DL70), 90% (DL90), and 100% (DL100) respectively for each matrix size and number of excitations.
[EPT reconstruction]
Among phase-based EPT algorithm7, a 2D-weighted polynomial fitting was performed to reconstruct conductivity8 (maximum kernel size = 2.1 x 2.1 cm2). For the magnitude weighting factor, the magnitude intensity of the image was used.
[Quantitative analysis]
For the quantitative evaluation of DL performance, normalized root mean squared error (NRMSE), peak signal-to-noise ratio (PSNR), and structural similarity index (SSIM) were estimated based on the DL 100 magnitude image.
Results
Use of DL, shows better results as compared to conventionally generated maps (i.e. decreased NRMSE, increased PSNR and SSIM, with increasing denoising levels).Although using DL shows better results in terms of conductivity reconstruction than not, differences according to denoising levels are not apparent. One reason is that the effect on DL denoising is weakened because spatial filtering is already used in the conductivity recon process (Figure 2., Figure 3.).
Increasing the conventional filtering size results in the spreading of boundary artifacts, which is fatal for estimating the conductivity of the tissue. However, this does not happen even if the denoising factor was increased when using DL. Also, The brain structures appear sharper, probably owing to the capability of DL to achieve high spatial resolution (Figure 2.).
The effect of signal averaging or matrix size is less than the effect of application of DL, however the benefit of increased SNR with signal averaging can be observed on 4 NEX acquisition with conventional reconstruction (Figure 2., Figure 3.).
Discussion and Conclusion
The preliminary results presented in this work based on images acquired on a quadrature coil, and reconstruction based on a prototype software, shows the potential of DL for improving MREPT results. Since the innate difference in electrical property in the normal brain structures is smaller than that observed between normal tissue and tumorous conditions, application to tumor imaging may further demonstrate the benefit of the current approach. Application to multi-channel-coil based methods8 is also warranted.Acknowledgements
We thank Jin Young Park, and Ki Bok Choi for their assistance in image acquisition.References
- Kim, S. Y. et al. Correlation between conductivity and prognostic factors in invasive breast cancer using magnetic resonance electric properties tomography (MREPT). Eur. Radiol. 26, 2317–2326 (2016).
- Kim, S. Y. et al. Correlation between electrical conductivity and apparent diffusion coefficient in breast cancer: effect of necrosis on magnetic resonance imaging. Eur. Radiol. 28, 3204–3214 (2018).
- Murakami, R. et al. Impact of FDG-PET/CT imaging on nodal staging for head-and-neck squamous cell carcinoma. Int. J. Radiat. Oncol. Biol. Phys. 68, 377–382 (2007).
- Hampe, N., Katscher, U., Berg, C. A. T. van den, Tha, K. K. & Mandija, S. Deep learning brain conductivity mapping using a patch-based 3D U-net. (2019).
- Mandija, S., Meliadò, E. F., Huttinga, N. R. F., Luijten, P. R. & van den Berg, C. A. T. Opening a new window on MR-based Electrical Properties Tomography with deep learning. Sci. Rep. 9, (2019).
- Shin, J., Lee, J., Kim, M. O., Choi, N., Seo, J. K., & Kim, D. H. Quantitative conductivity estimation error due to statistical noise in complex B1+ map. JKSMRM, 18(4), 303-313 (2014).
- Voigt, T., Katscher, U. & Doessel, O. Quantitative conductivity and permittivity imaging of the human brain using electric properties tomography. Magn. Reson. Med. 66, 456–466 (2011).
- Lee, J., Shin, J. & Kim, D.-H. MR-based conductivity imaging using multiple receiver coils. Magn. Reson. Med. 76, 530–539 (2016)
Figures
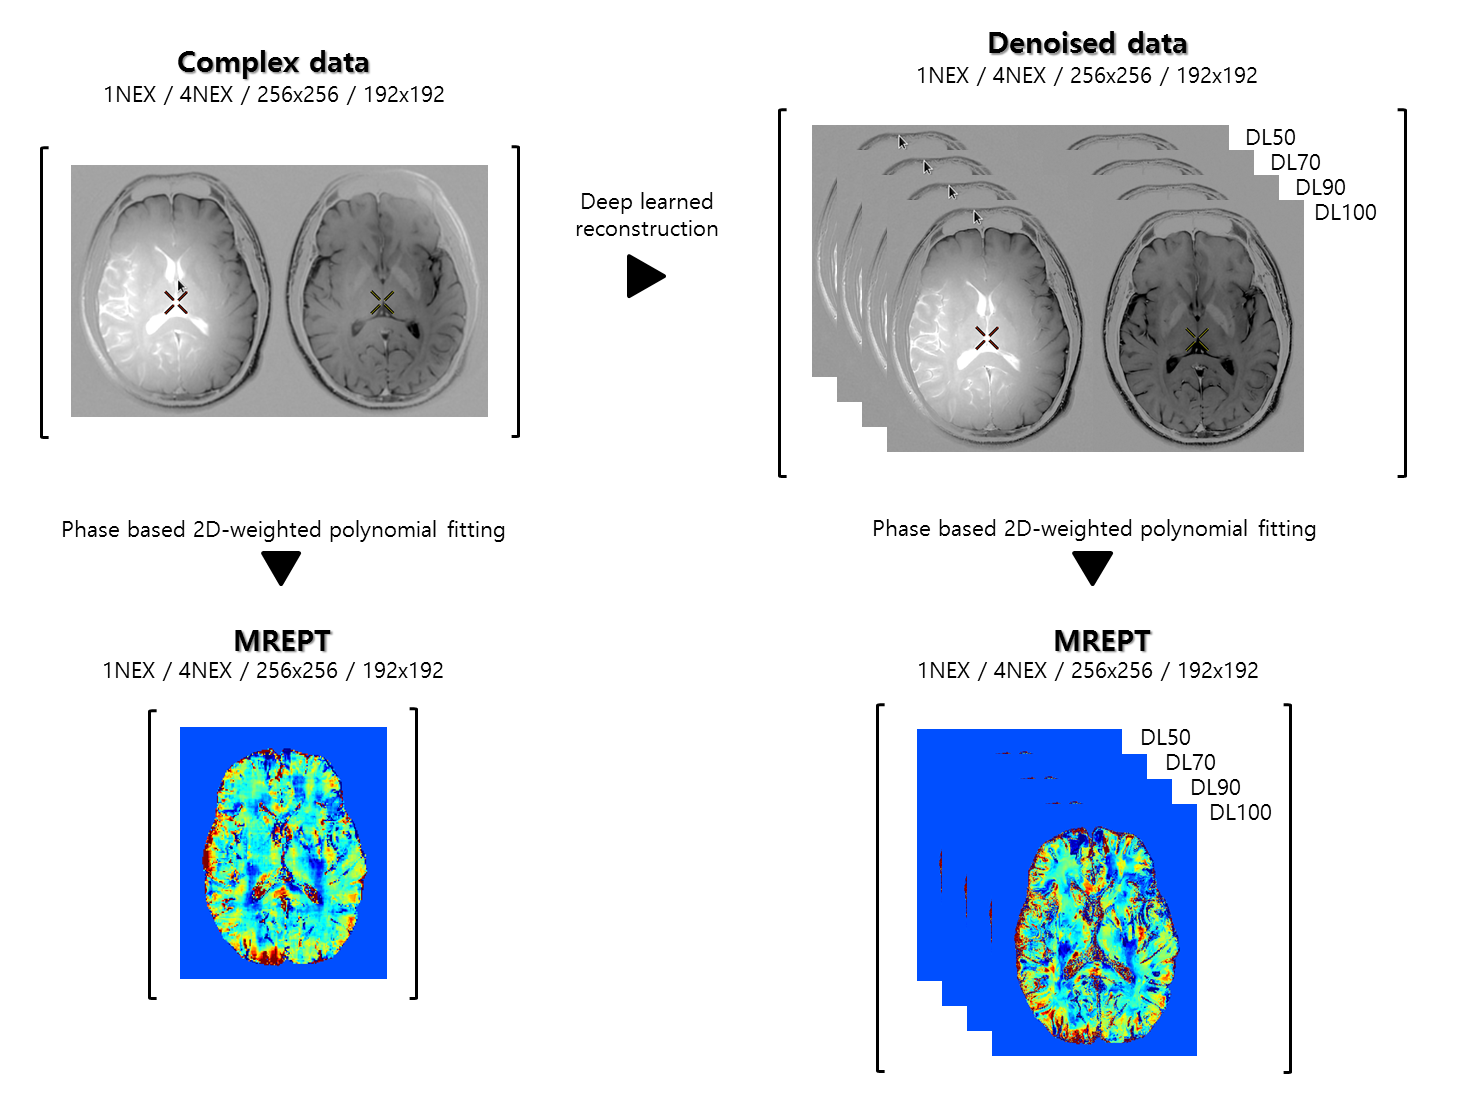
Figure 1. Summary of the MREPT mapping with and without deep learned reconstruction.
Complex data were acquired with a FSE experiment with varying matrix sizes and number of averages. Each data were retrospectively reconstructed with deep learned reconstruction with noise levels of 50, 70, 90, and 100% respectively. MREPT mapping was performed using each data, with phase-based 2D-weighted polynomial fitting.
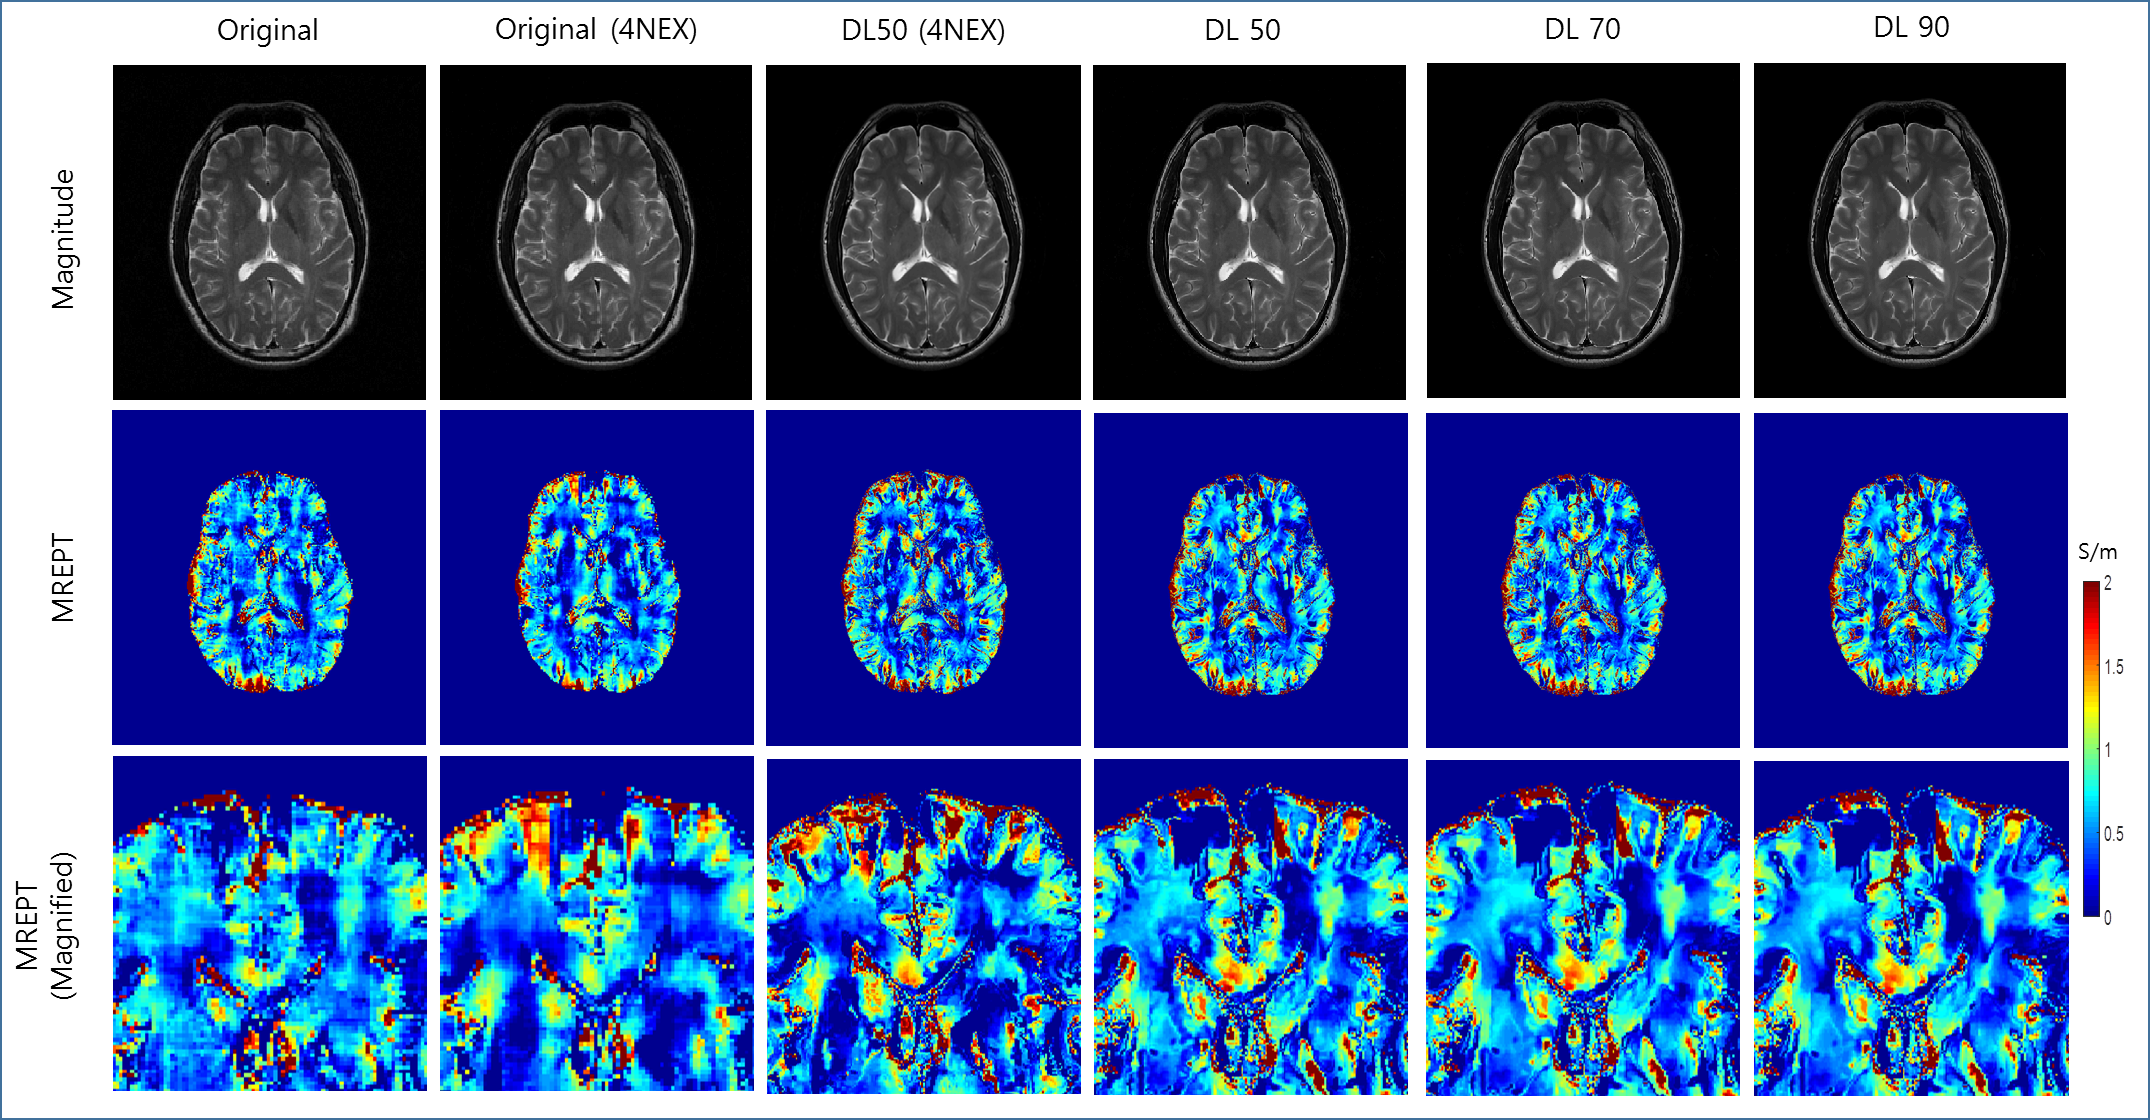
Figure 2. Comparison of EPT generated using original reconstruction and DL with different denoising levels.
(a) Magnitude images (b) EPT (c) Magnified EPT after application of original, original with 4NEX, DL50 with 4NEX, DL50, DL70 and DL90, respectively.
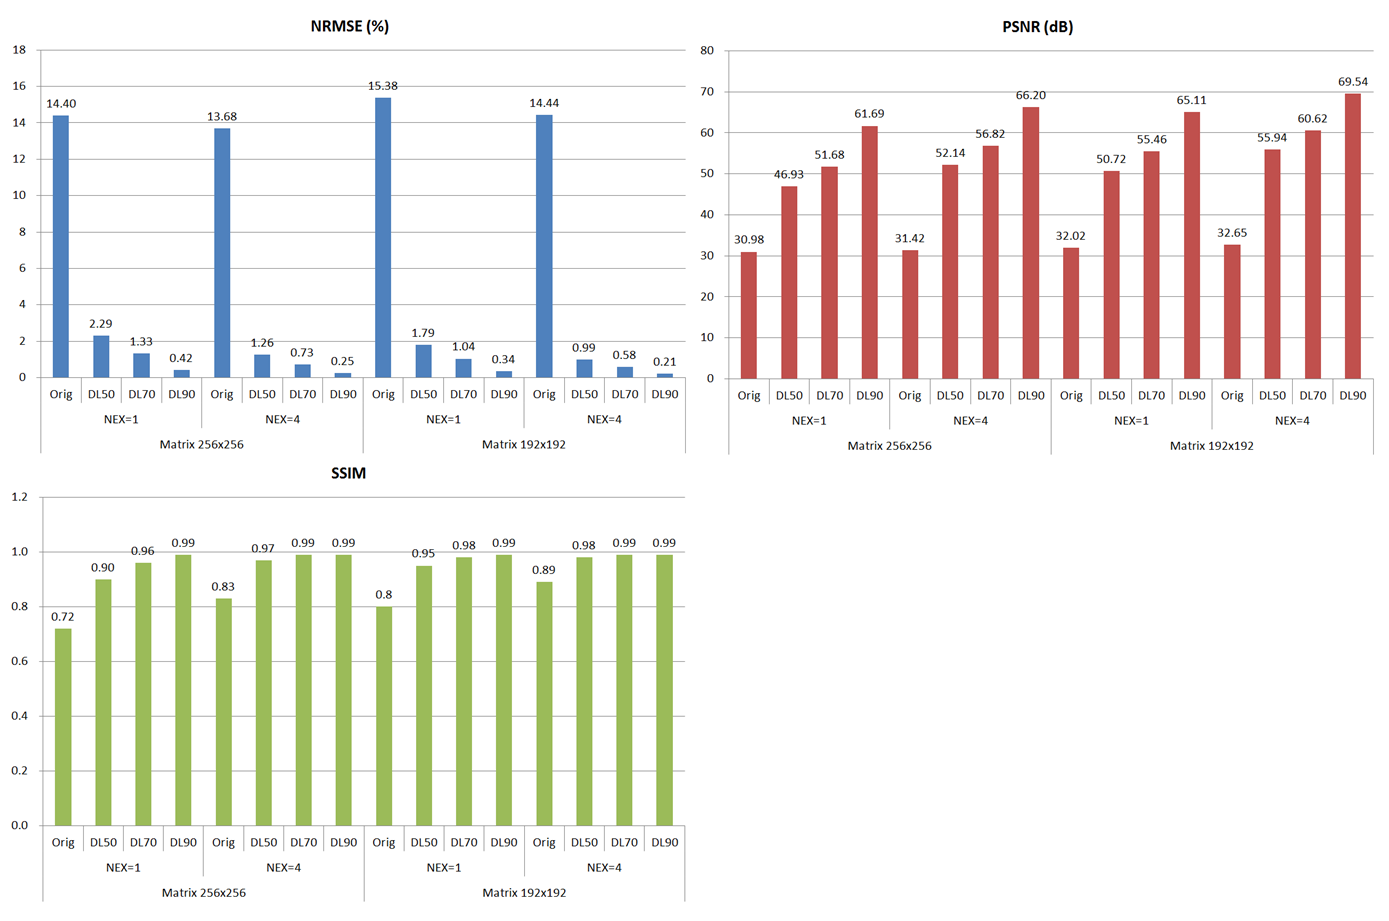
Figure 3. Quantitative analysis of DL performance for EPT.
NRMSE, PSNR, and SSIM, suggest that DL shows better performance over the original method.