3183
In Vivo Conductivity Tensor Imaging of Human Brain
Nitish Katoch1, Bup Kyung Choi1, In Ok Ko2, Ji Ae Park2, Yong Soo Cho3, Jin Woong Kim3, Hyung Joong Kim1, and Eung Je Woo1
1Kyung Hee University, Seoul, Korea, Republic of, 2Korea Institute of Radiological and Medical Sciences, Seoul, Korea, Republic of, 3Chosun University Hospital and Chosun University College of Medicine, Gwangju, Korea, Republic of
1Kyung Hee University, Seoul, Korea, Republic of, 2Korea Institute of Radiological and Medical Sciences, Seoul, Korea, Republic of, 3Chosun University Hospital and Chosun University College of Medicine, Gwangju, Korea, Republic of
Synopsis
Human brain mapping of the electrical conductivity can facilitate the understanding of brain function. The low-frequency conductivity distribution of biological tissue exhibit the anisotropic tissue property and can be expressed as tensor. Considering the most physiological events occurs in frequency below 1 kHz, we developed a new conductivity tensor imaging method which can be implemented in conventional clinical MRI scanner without using any current injections for anisotropic conductivity measurement.
Purpose
This study reports the results of human brain imaging experiments using conductivity tensor imaging (CTI) method. In vivo CTI of five human brains were performed using a 3T MR scanner with 1.87 mm spatial resolution.Methods
Five healthy volunteers without a documented history of any disease were recruited (KHSIRB-16-033). The volunteers were 25.4 ± 4.5 years old (3 male and 2 female). All participants were examined before and after each imaging experiment using a 3T clinical MRI scanner (Magnetom Trio A Tim, Siemens Medical Solution, Germany). The image of the conductivity tensor was reconstructed using the CTI formula [1]: C = [χσH / χdew +(1-χ)diwβ] Dew = η Dew (1), where σH is the high-frequency conductivity at the Larmor frequency, χ is the extracellular volume fraction, β is the ion concentration ratio of intracellular and extracellular spaces, dew and diw are the extracellular and intracellular water diffusion coefficients, η is position dependent scale factor and Dew is the extracellular water diffusion tensor. The multi-echo spin-echo pulse sequence with multiple refocusing pulses was adopted to obtain the high-frequency conductivity (σH). The imaging parameters were as follows: TR/TE = 1500/15 ms, number of echoes = 6, NEX = 5, slice thickness = 4 mm, number of slices = 5, matrix size = 128 × 128, and FOV = 240 × 240 mm2. Multi-b diffusion weighted imaging data sets were obtained using the single-shot spin-echo echo-planar-imaging pulse sequence to calculate χ, dew, diw and Dew . The number of directions of the diffusion-weighting gradients was 15 with b values of 50, 150, 300, 500, 700, 1000, 1400, 1800, 2200, 2600, 3000, 3600, 4000, 4500 and 5000 s/mm2. TR/TE = 2000/70 ms, slice thickness = 4 mm, flip angle = 90°, number of excitations = 2, number of slices = 5 and acquisition matrix = 64 × 64. The matrix size of 64 × 64 was extended to 128 × 128 for subsequent data processing steps. An additional conventional T2 weighted scan of 2 minutes was also acquired for anatomical reference. The parameter β is set to the value of 0.41 as suggested in [1].Results and Discussion
Figure 1(a-d) illustrates the reconstructed CTI images of the brain from one subject using eq. (1). The recovered conductivity values of three different brain tissues including the white matter (WM), gray matter (GM) and cerebrospinal fluid (CSF) are shown in Fig. 2 for five subjects. For qualitative analysis (Fig. 2), each T2 images was segmented into WM, GM, and CSF regions. The entire white matter was further segmented into WM1, WM2 and WM3 regions where their longitudinal directions were aligned to x, y and z directions, respectively. The values of Cxx, Cyy, and Czz were largest among the six elements of the conductivity tensors in WM1, WM2 and WM3, respectively. The values varied from 0.08 to 0.27 S/m. The WM anisotropic ratio (AR) varied from 1.96 to 3.25. For the GM regions, the conductivity values of Cxx, Cyy, and Czz were in the range of 0.20 to 0.30 S/m. The ARs of the GM regions were between 1.12 and 1.19. In all WM and GM regions, σH was always larger than the recovered low-frequency conductivity values. The values of σH in the WM regions were between 0.33 to 0.48 S/m. In the GM regions, the values were between 0.60 to 0.72 S/m. The low-frequency conductivity of the isotropic CSF regions ranged from 1.55 to 1.82 S/m whereas its high-frequency conductivity values were in the range of 1.65 to 1.90 S/m. The scale factor η was largest in the CSF regions and smallest in the WM regions. The gray matter conductivity values of the human subjects were 0.20 to 0.30 S/m, which are close to the values of 0.24 to 0.29 S/m measured from in vivo DT-MREIT experiments of human subjects by using injection currents [2]. The ARs of the WM regions had much larger values of 1.96 to 3.25 compared with those of the gray matter regions. The WM regions also exhibited considerably more position and frequency dependency. These indicate that there were different amounts of myelinated fiber bundles with different directions in the voxels belonging to the WM regions depending on their positions. The low-frequency conductivity values of the GM and WM regions shown in Fig. 2 exhibited much stronger frequency dependencies compared to the CSF regions.Conclusion
Unlike other low-frequency conductivity imaging methods of MREIT and DT-MREIT [2,3], CTI does not require injecting currents into the imaging subject. This allows CTI to be readily applicable to in vivo human imaging studies without causing any adverse effects of electrical stimulations of nerves and muscles. Without adding any special hardware, CTI can be implemented in a clinical MRI scanner for disease diagnosis and volume conduction modeling.Acknowledgements
This work was supported by the National Research Foundation of Korea (NRF), the Ministry of Health and Welfare of Korea, and Korea Institute of Radiological and Medical Sciences (KIRAMS) grants funded by the Korea Government (2018R1D1A1B07046619, 2019R1A2C2088573, HI18C2435, and 50461-2019).References
- S. Sajib et al. Electrodeless conductivity tensor imaging (CTI) using MRI: basic theory and animal experiments. Biomed. Emg. Lett. 2018;8:273-282.
- M. Chauhan M et al. Low-Frequency Conductivity Tensor Imaging of the Human Head In Vivo Using DT-MREIT: First Study. IEEE Trans. Med. Imaging. 2018;37:966-976.
- J. K. Seo and E. J. Woo. Electrical tissue property imaging at low frequency using MREIT. IEEE Trans. Biomed. Eng. 2014;61:1390-1399.
Figures
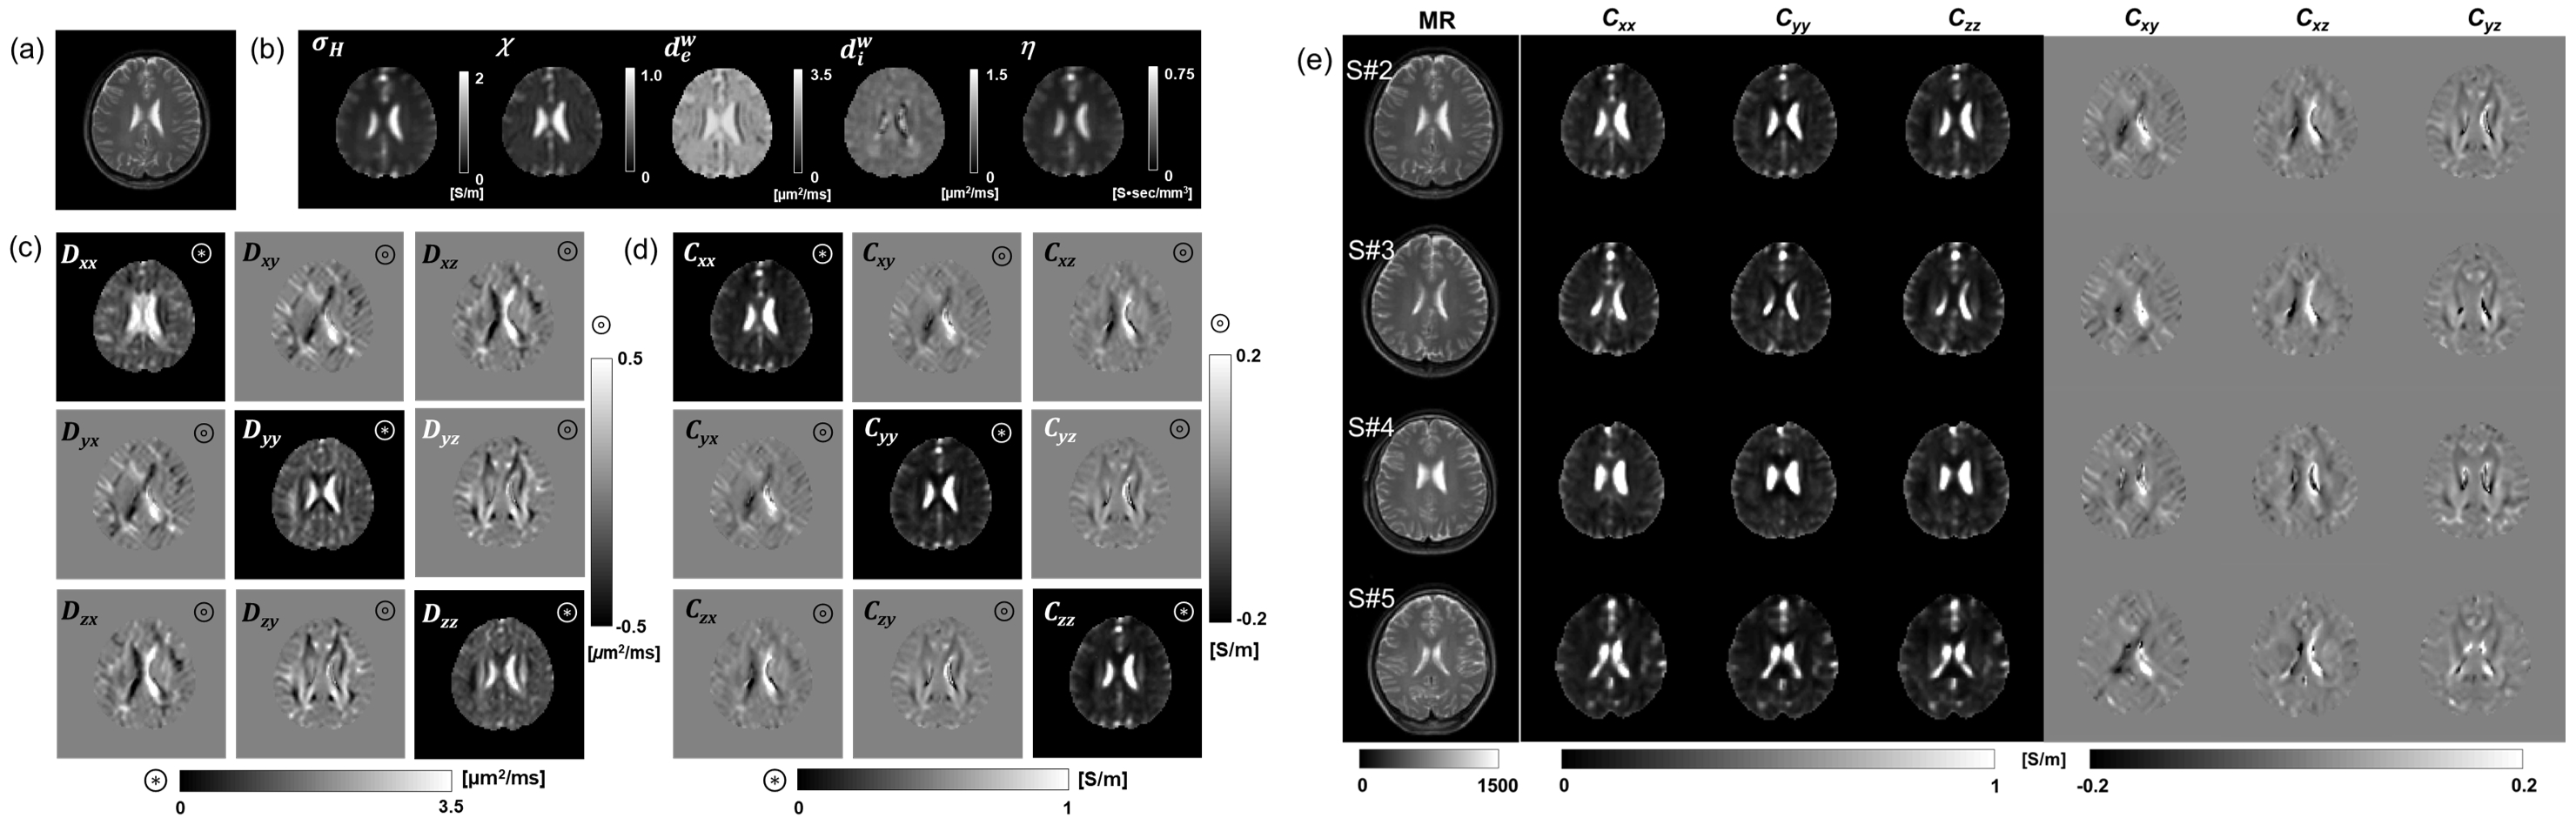
Fig. 1. In
vivo CTI images of human brain subjects. Images of the (a) T2-weighted, (b)
high-frequency conductivity σH,
extracellular volume fraction χ,
extracellular water diffusion coefficient dew
, intracellular water diffusion coefficient diw and scale
factor η. (c) Conductivity
tensor and (d) water diffusion tensor images obtained from one subject. (e) CTI
images of the remaining four subjects focused on the diagonal and off-diagonal
components of conductivity tensor.
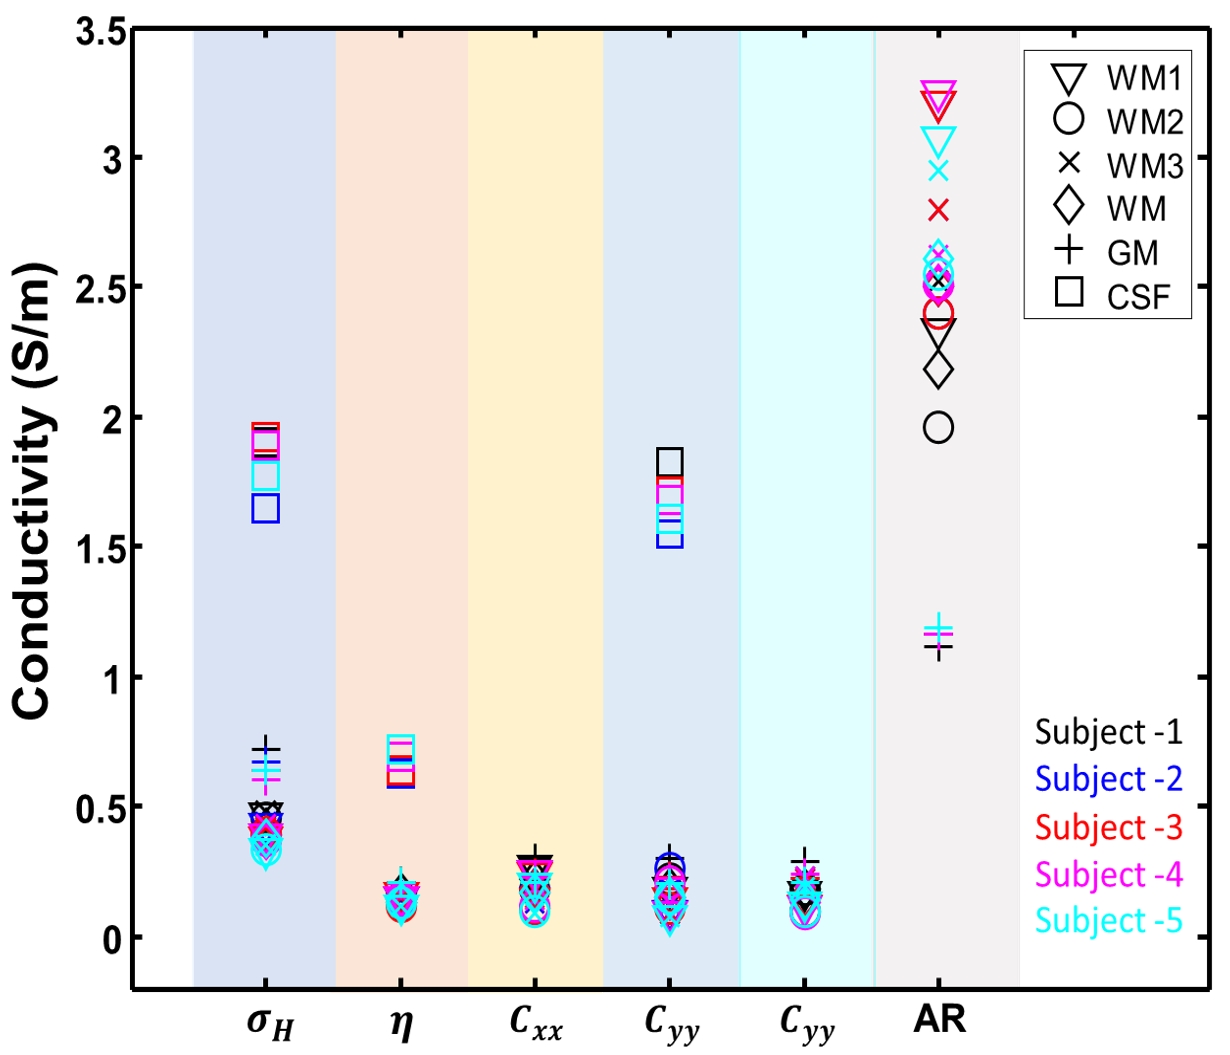
Fig. 2. Quantitative
analysis of measured conductivity values from all five subjects including their
anisotropic ratio (ARs).