3182
Assessment of the sensitivity of Phase-Only Helmholtz-EPT to spatially-dependent conductivity changes using a glioma-brain-phantom
Lucia Bossoni1, Andrew Webb1, Loes Huijnen2, Remco Overdevest2, and Wyger Brink1
1Leiden University Medical Center, Leiden, Netherlands, 2Leiden University, Leiden, Netherlands
1Leiden University Medical Center, Leiden, Netherlands, 2Leiden University, Leiden, Netherlands
Synopsis
Phase-only Helmholtz-Electrical Property Tomography (PO-HEPT) has recently shown promise for the detection and grading of diffuse glioma. However, a brain glioma is usually located away from the centre of the brain where the transceive phase and phase-only approximations used in reconstruction may not be valid. Here we assessed the sensitivity of PO-HEPT in an anatomically realistic brain phantom where an off-centre glioma-compartment was incorporated, and using a clinically applicable MR sequence. Our results show that while the accuracy of the PO-HEPT deteriorates, its sensitivity is mostly unaffected, thus allowing correlative studies of tumour grading.
Introduction
Gliomas are known to show higher electrical conductivity values than the normal brain parenchyma1. Recently, phase-only Helmholtz-Electrical Property Tomography (PO-HEPT) was employed to distinguish high grade from lower-grade gliomas with high efficiency2. However, the validity of the assumptions of PO-HEPT has only been tested on highly symmetrical and homogeneous phantoms. This study aimed to assess whether the PO-HEPT reconstruction had enough sensitivity to accurately report conductivity values in a brain phantom designed to mimic the human brain anatomy, within an off-centre ROI where the transceive phase approximation (TPA) is less accurate, and using a clinically relevant sequence taking less than 3 mins of scan time.Methods
A brain phantom was designed by segmenting the MRI image of a patient with a glioma. The tissue boundaries were 3D printed with polypropylene, and the CSF, white matter (WM) and grey matter (GM) compartments were filled with a mixture of 2% agarose, demi-water and NaCl to reach the conductivity of the specific tissue type at 128 MHz: 2.1 S/m (CSF), 0.34 S/m (WM) and 0.6 S/m (GM)3. The conductivity of the glioma-compartment was varied from 0.6 S/m to 2 S/m, in steps of 0.2 S/m and consisted of a water-NaCl solution to allow in-situ replacement in the glioma-compartment.MRI data were acquired on a 3T clinical scanner (Ingenia, Philips, Best, The Netherlands) with a 3D-bSSFP sequence. The scan parameters were: FOV (mm)=240x240x37.5; acquired voxel size (mm)=2x2x1.5; reconstructed voxel size (mm)=1.25x1.25x1.5; flip angle 10 degrees; 16 signal averages; TR/TE=3/1.5 ms; Dummy pulses were included before each acquisition to minimize transient magnetization effects4; total scan duration was 2:23 mins. The signal was received with a 32-channel array head coil, while a body coil was used for transmission and phase referencing. The phantom was placed at the centre of the array. The electrical conductivity maps were reconstructed from the phase data and from the homogeneous Helmholtz equation5:
$$\sigma = -\frac{1}{\mu_0 \omega} \left(\frac{\nabla^2e^{i\phi+}}{e^{i\phi+}}\right) $$
where ω is the Larmor frequency, μ0 the magnetic vacuum permeability and φ+ the transmit phase, which was assumed to be φ+= φ±/2 (TPA), where φ± is the transceive phase. The Laplacian was implemented by convolving the phase-data with a 7x3x3 kernel, for in-plane derivatives, and a 5x3x3 kernel for out-of-plane derivatives6. Conductivity maps were subsequently convolved with a 2D median filter to mitigate noise-related reconstruction artefacts, and subsequently three ROIs were drawn in the glioma compartment. Finally an additional ROI was placed in the ventricles, and this was used as a control. An ANOVA test with Bonferroni post-hoc correction for multiple comparisons was performed on the eight different glioma-conductivity values, for each different post-processing choice. The same statistical test was used to judge the stability of the method across different acquisitions in the ventricles' ROI.
Results
A picture of the phantom and the acquired magnitude and phase data are shown in Fig.1. Raw and filtered conductivity maps are shown in Fig.2. The accuracy and sensitivity of the method were tested against different choices of ROI and with different median filter sizes. As a “control” to validate the stability of the algorithms for a constant conductivity, the reconstructed conductivity values in the ventricles' ROI was quantified and it showed no significant changes in mean conductivity across different acquisitions, for all sample pairs except for one (Fig. 3). The best results in terms of sensitivity were obtained with ROI1 and a median filter of 4x4 pixels and show that, despite the rather large standard deviation (∼0.2 S/m), the differences in glioma-conductivities were statistically significant also between the two samples which differed only by ∼ 0.1 S/m. The best results in terms of accuracy were obtained with ROI2. However, these results are much less precise (larger standard deviation), due to the leakage of the boundary effects in the ROI. Finally, ROI3, although being far from the boundaries by several pixels (i.e. >> kernel size), was statistically the same as the other two ROI choices.Discussion
In all ROI analyses, the conductivity was consistently underestimated and the error increased with the nominal conductivity (Fig.4), which is in line with literature6. One explanation could be that the TPA deteriorates at the periphery of the FOV, as previously reported7,8. In one study7, when using PO-HEPT, σ underestimated independent conductivity-measurements by approximately 40% in peripheral regions, in agreement with our findings. Additionally, 3D-printed boundaries may have a detrimental effect on the spatial homogeneity of B0 and B1, therefore introducing further phase errors. Regardless of the above limitations, PO-HEPT was able to detect statistically significant changes in conductivity across different glioma-samples, thus showing promise of the approach of using3D bSSFP and PO- HEPT for clinical glioma applications1. We anticipate that the accuracy of the method will improve in an in-vivo experiment, where hard boundaries with abrupt permittivity and magnetic susceptibility changes are absent8.Conclusions
In this study we assessed the sensitivity of phase-only EPT in a realistic brain phantom with a glioma compartment. Despite the rather large σ errors, which we speculated to originate from the partial violation of the TPA phase and phase-only approximations, the method was able to measure significant differences across samples, therefore validating its potential use in the clinic.Acknowledgements
This work was supported by the Netherlands Organization for Scientific Research (NWO) through a VENI fellowship to L. B (016.Veni.188.040) and to W. B (016.Veni.188.040 and TTW.16820). H. van de Stadt and J. Verhart are acknowledged for assistance in the phantom preparation. J. Bresser provided help in the design of the brain phantom. R. Leijsen is thanked for useful discussions. E. Ercan, T. Ruytenberg and J. Vonk-van Oosten helped with the data acquisition.References
- T. Voigt, Imaging Conductivity using Electric Properties Tomography – Initial Clinical Results in Glioma Patients, 2011 XXXth URSI General Assembly and Scientific Symposium, 2011
- K.K Tha et al, Noninvasive electrical conductivity measurement by MRI: a test of its validity and the electrical conductivity characteristics of glioma, Eur Radiol (2018) 28:348–355
- S Gabriel et al., The dielectric properties of biological tissues: III. Parametric models for the dielectric spectrum of tissues,1996 Phys. Med. Biol. 41 2271
- S. Gavazzi et. al. Transceive phase mapping using the PLANET method and its application for conductivity mapping in the brain, Magn Reson Med. 2019;00:1–18.
- E M Haacke, Extraction of conductivity and permittivity using magnetic resonance imaging, 1991 Phys. Med. Biol. 36 723
- A.L.H. M. W. van Lier et al.,B1+ Phase Mapping at 7T and its Application for In Vivo Electrical Conductivity Mapping, Magn Reson Med. 67:552–561 (2012)
- E. Balidemaj et al, Feasibility of Electric Property Tomography of Pelvic Tumors at 3T, Magnetic Resonance in Medicine 73:1505–1513, 2015 (2014)
- A.L.H. M. W. van Lier et al., Electrical Properties Tomography in the Human Brain at 1.5, 3, and 7T: A Comparison Study, Magnetic Resonance in Medicine 71:354–363 (2014)
Figures
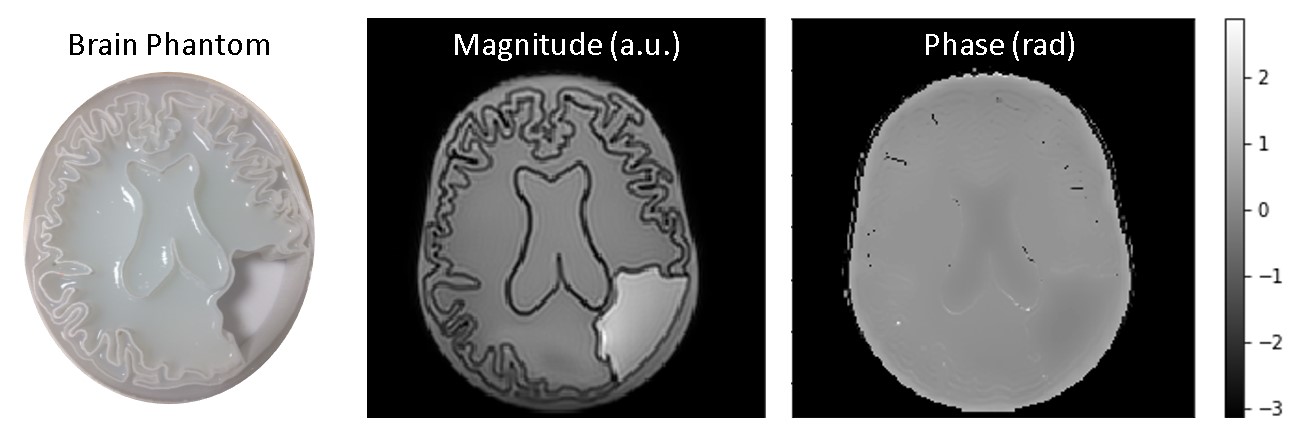
Left panel shows the phantom filled with
agarose gel and the empty glioma compartment. The central panel shows a magnitude
image, and the right panel shows the corresponding phase image, where contrast
due to the higher conductivity in the ventricle and glioma compartments is
visible.
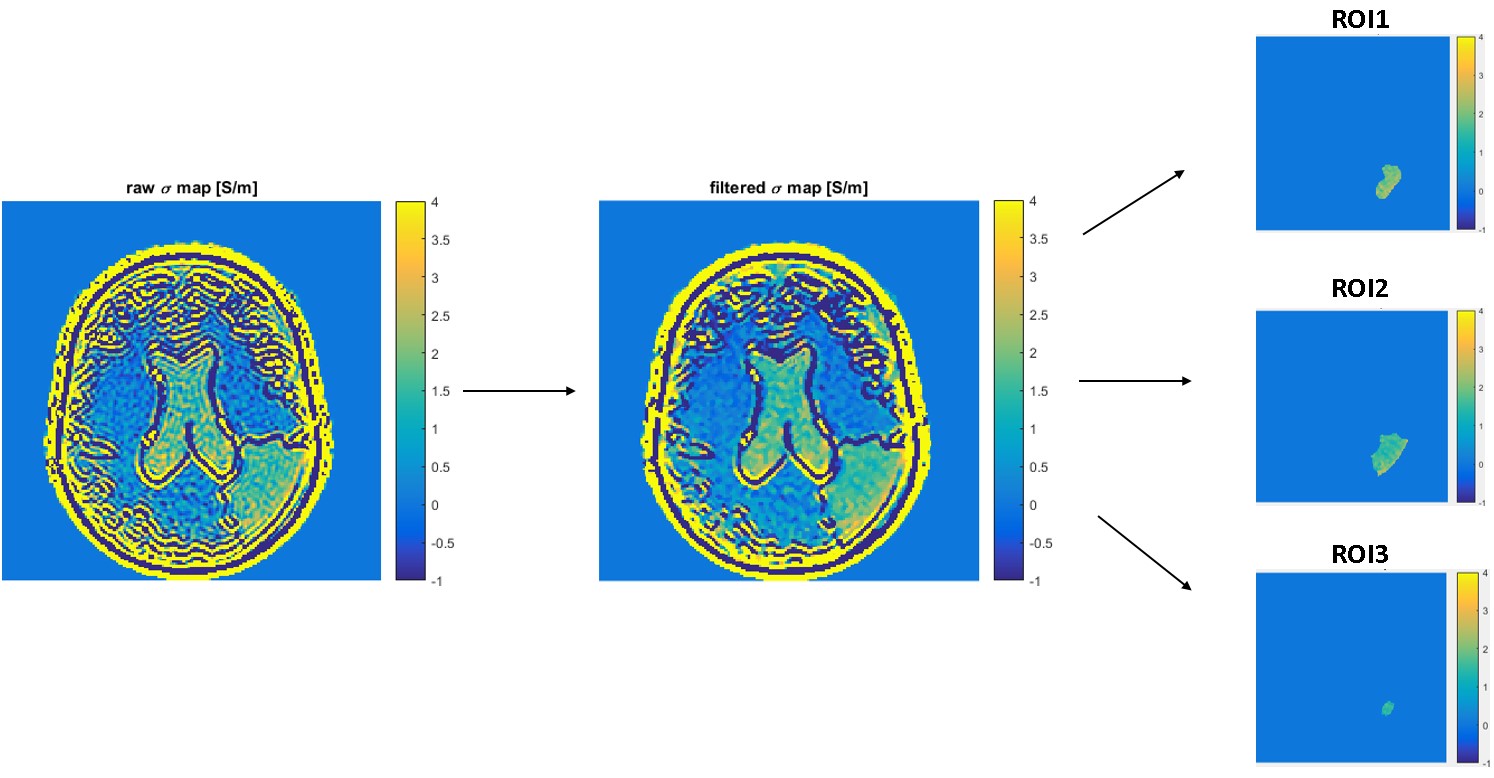
Diagram showing the post-processing steps:
after the conductivity map reconstruction, a median filter was applied (here 3x3),
which partially mitigates the Gibbs ringing artefact. Finally, three different
ROIs were drawn in the glioma compartment at different distance with respect to
the borders.
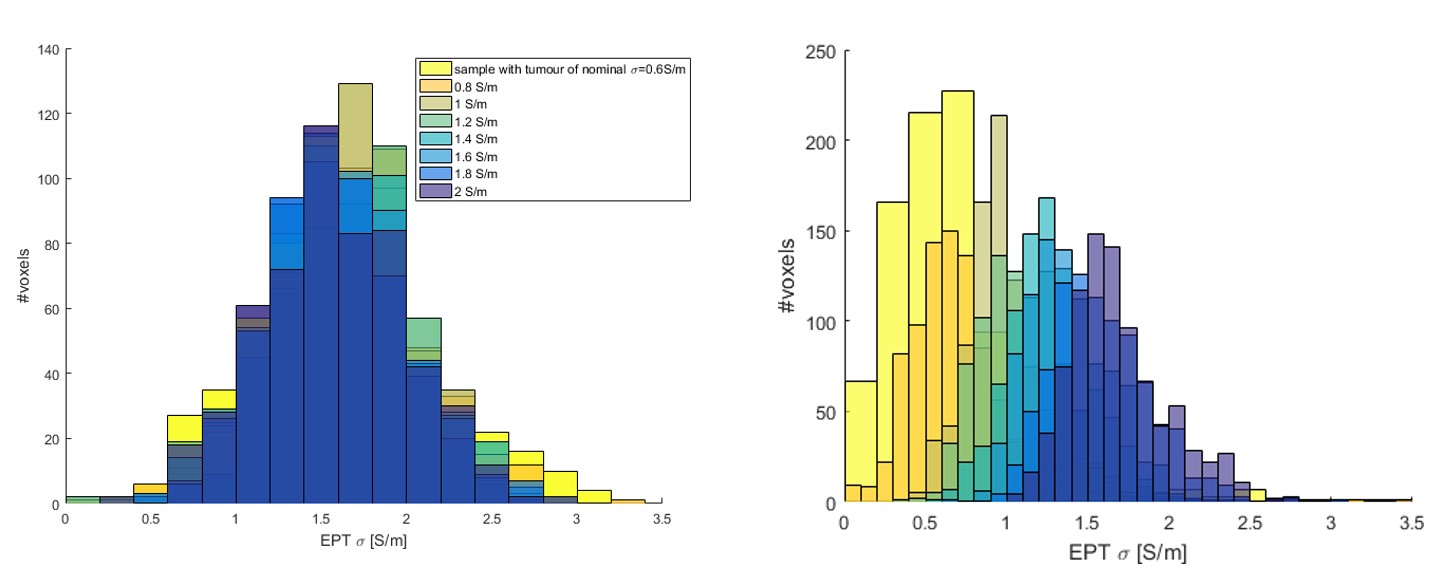
Left: histograms for ventricles’
ROI. Acquisitions were repeated on the phantom with different glioma-conductivities.
All pair-wise comparisons were not significantly different except from acquisition
on sample with tumour-σ=0.8 S/m which was significantly different from
samples with tumour-σ =2 (p=0.0066), 1.6 (p=0.0092) and 0.6(p=0.0264). The error in mean σ
was attributed to Gibbs ringing artefacts in the ROI. Right: histograms for ROI2. All pair-wise comparisons for mean σ are significantly
different, except from pair σ =0.6-0.8 (p=0.094).
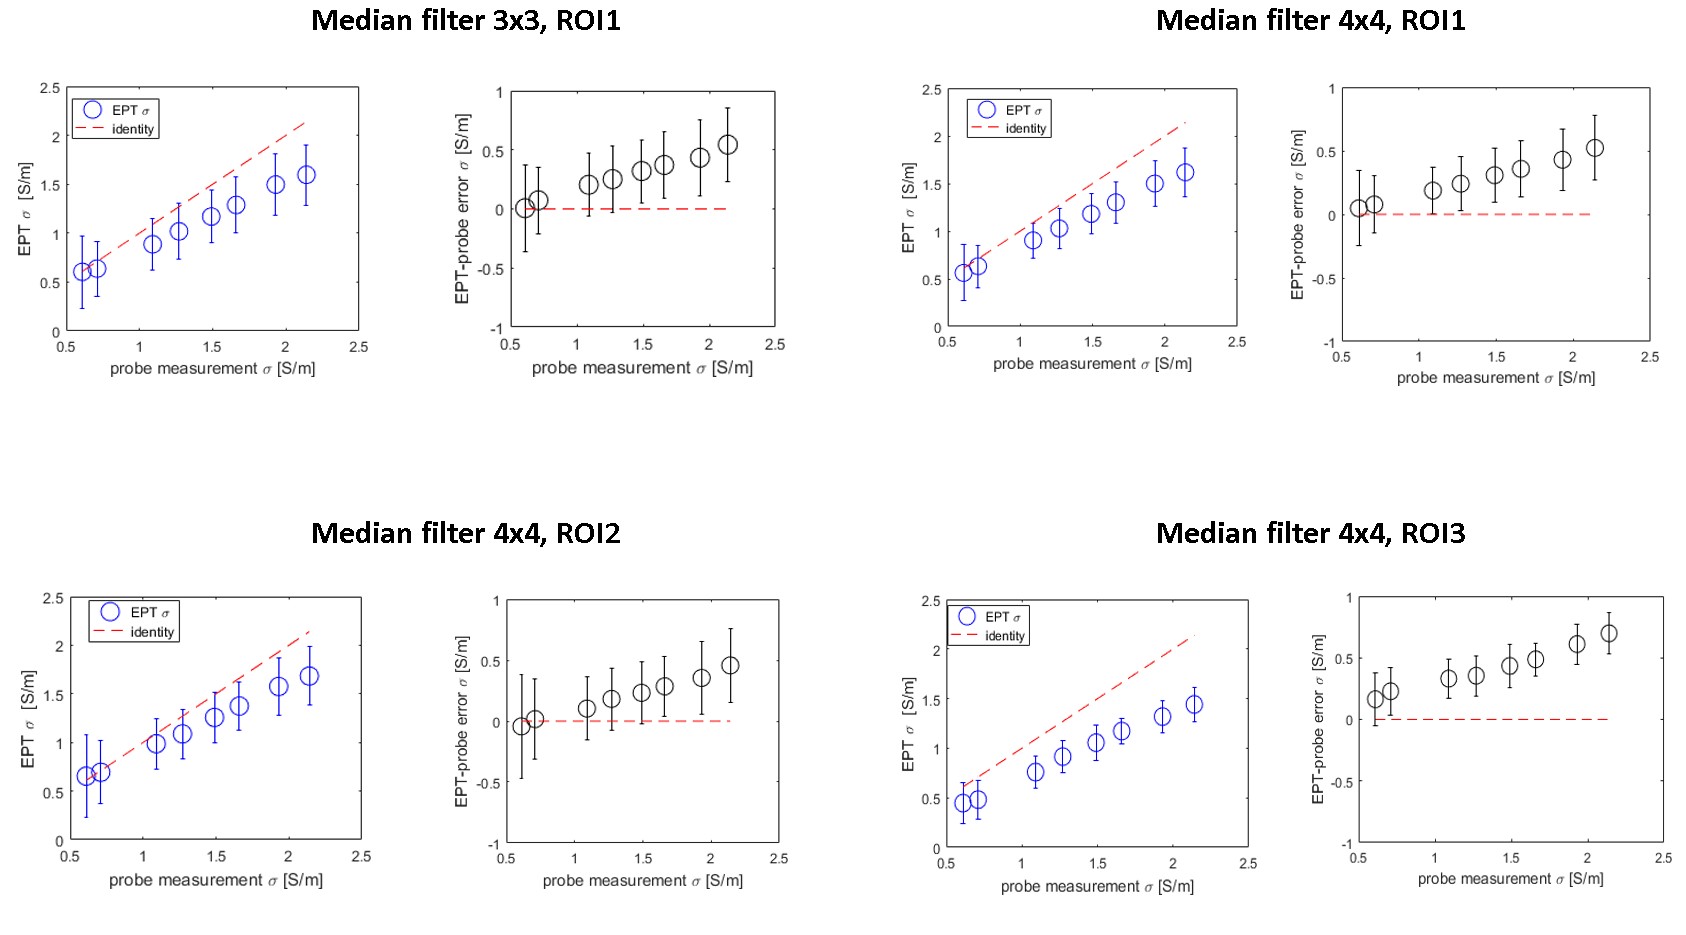
EPT- σ vs probe- σ, for different post-processing choices (blue). σ-error plot (black). Standard deviations are
reported as error bars. For the top-left
case, all pair-wise σ comparisons were significantly different except for pair σ =0.6-0.8 (p=0.09);
for the top-right case, all pair-wise comparisons where statistically different
(p<0.05); for the bottom-left case,
all pair-wise comparisons were significantly different except for pair σ =0.6-0.8 (p=0.094);
for the bottom-right case all
pair-wise comparisons were significantly different except for σ =0.6-0.8 (p=0.071).