3180
Imaging of Current Density Distribution in Deep Brain Stimulation (DBS)1School of Biological and Health System Engineering, Arizona State University, Tempe, AZ, United States, 2Department of Surgery, University of Arizona, Tucson, AZ, United States
Synopsis
Computational methods have been widely used to estimate field distributions produced by conventional or recently introduced directional DBS electrodes. To date there have been no experimental measurements of fields produced by DBS. We implanted either conventional or directional DBS leads into a head-shaped homogeneous phantom filled with agar gel and compared the current densities produced by each DBS electrode type using magnetic resonance current density imaging (MRCDI). This first experimental demonstration demonstrates the expected reduced spread for directional electrodes. This approach will be used in future studies to produce detailed images of DBS fields relative to target structures.
INTRODUCTION
Deep brain stimulation (DBS) is a neuromodulation technique indicated most commonly to treat movement disorders such as Parkinson’s disease (PD)1. Conventional DBS leads such as the Medtronic 3387 (Medtronic, Minneapolis, MN) comprise four concentric cylindrical electrodes. Current distributions delivered by these leads are symmetric and may therefore limit charge delivered to target structures and, possibly produce side effects. In directional DBS leads such as the Abbott Infinity 6172 (Abbott, Abbott Park, IL) concentric electrodes are segmented so that contacts on certain regions of the cylinder may be selectively energized2. Estimations of fields produced by either conventional or directional electrodes have most often been performed using computational models, and have not been directly measured in human subjects. Magnetic resonance current density imaging (MR-CDI)3 aims to produce the current density distribution inside biological tissue by measuring one component of the magnetic flux density (Bz) produced by external currents. This technique has previously been demonstrated to determine DBS current flow in canine brains4 using conventional 3387 electrodes. In this study, we compare the current density distribution within a head-shaped homogeneous phantom caused by either conventional (Medtronic-3387) or directional (Abbott Infinity 6172) DBS leads using the MR-CDI technique. Results confirm the reduced current spread of directional DBS electrodes.METHODS
Experiment: In this study we used two head-shaped uniform phantoms filled with agar gel. The gel conductivity was approximately 1 S/m. In each phantom, we attached a 5x5 cm2 carbon ground electrode at an occipital (Oz) location (Fig. 1b). For either the ‘conventional’ phantom, containing the Medtronic-3387 DBS lead (Fig. 1a top) or the ‘directional’ phantom (Abbott Infinity 6172, Fig. 1a bottom) the lead was placed approximately at the phantom center. The 2C electrode of the directional electrode was oriented to face the ground electrode.All data were measured using a 32-channel RF head coil in a 3.0T Phillips scanner (Phillips, Ingenia, Netherlands) located at the Barrow Neurological Institute (Phoenix, Arizona, USA). An MR-safe transcranial electrical stimulator (DC-STIMULATOR MR, neuroConn, Ilmenau, Germany) was used to deliver 1.5 mA currents using a DBS-Oz electrode montage. A total of 24 axial slices of magnetic flux data were measured using a multiband-accelerated mFFE MREIT5 pulse sequence, with an image matrix size of 100x100. Other imaging parameters were TR/TE= 50/7 ms, echoes= 10, echo spacing= 3 ms, MB-factor=8, SENSE-factor=1 and total scan time= 6 min. Echo data were combined using a weighted averaging technique proposed by Kim et al6 to produce an optimal representation of the field $$$B_{z}^{opt}$$$. A PDE-based denoising technique7 was also applied to reduce the noise-level of optimized data as $$$B_{z}^{den}$$$ . Figure 1 (d) and (f) shows the center slice of MR magnitude images. The left (and right) panel of Fig. 1(e) and (g) display the echo combined $$$B_{z}^{opt}$$$ (and $$$B_{z}^{den}$$$) images for conventional and directional DBS electrodes respectively. A set of high-resolution T1-weighted images also collected to confirm the locations of each DBS lead (Fig 1c).
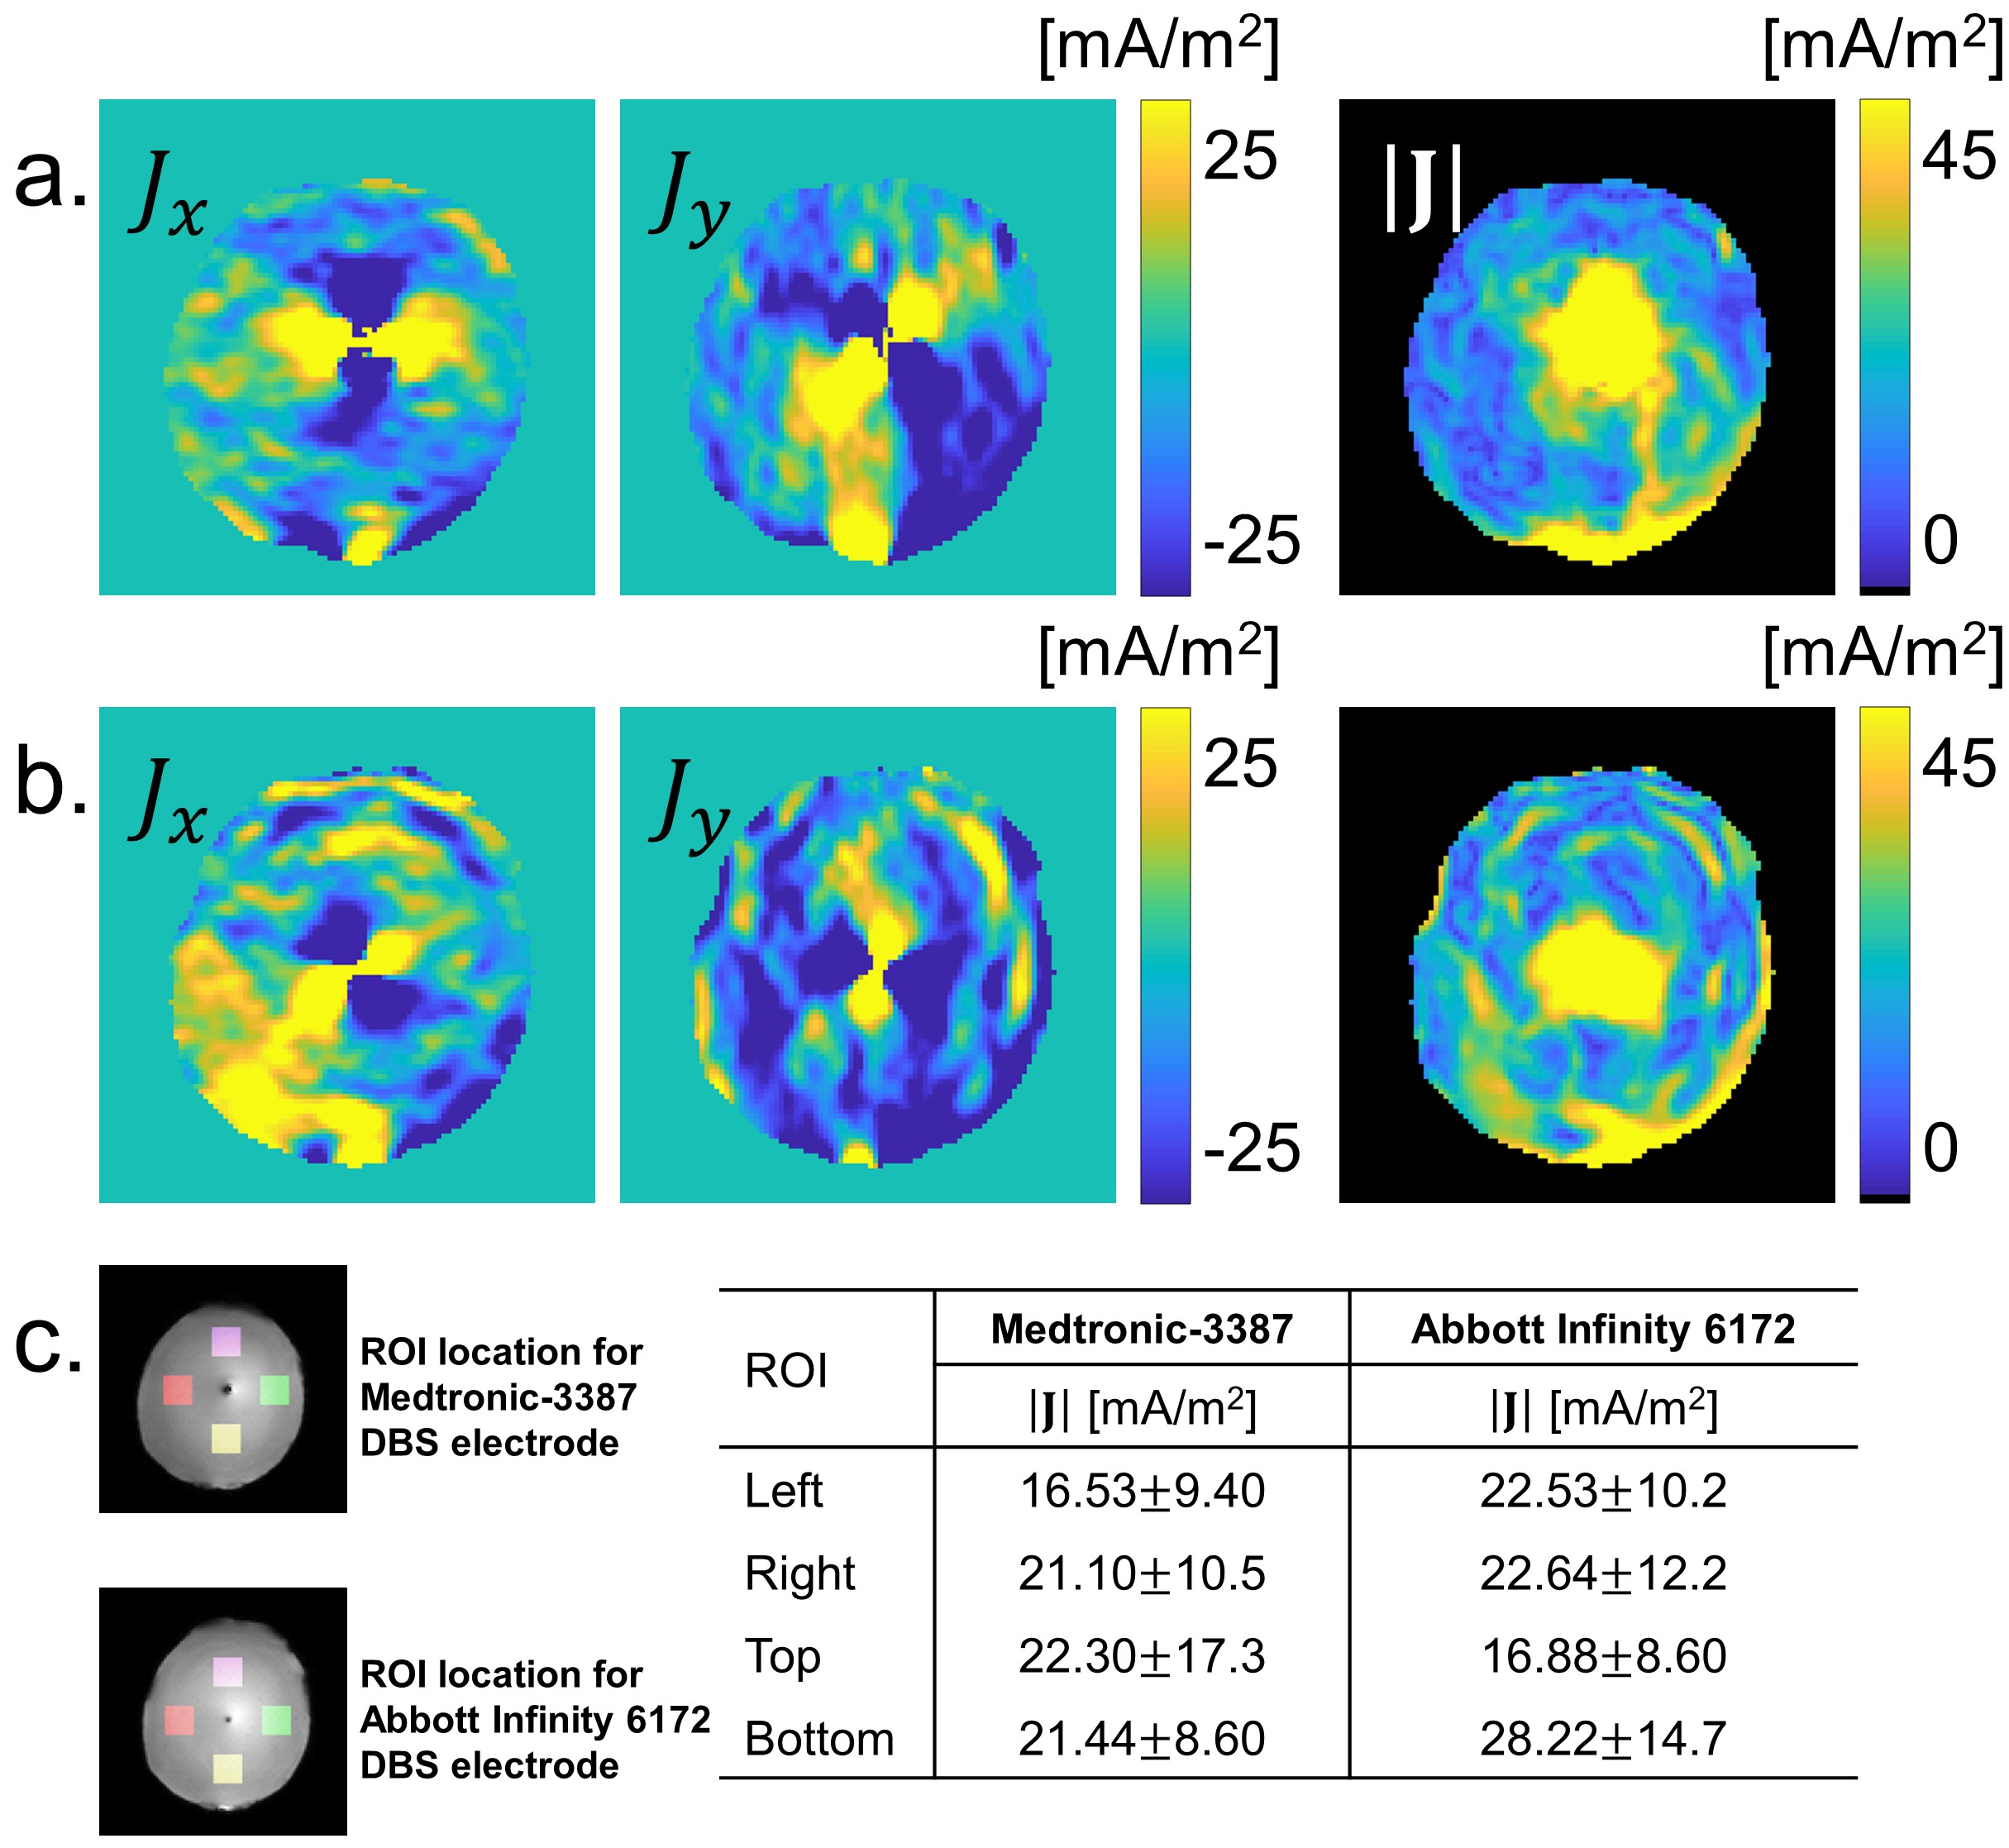
Current density image reconstruction: We located the approximate position of the active DBS electrode in an MRCDI-slice by comparing the electrode dimension with the T1-weighted images. Because the electrode was almost exactly oriented in the z-direction at this slice location we assumed that current flow was almost all represented in Bz data, and that the other two components of magnetic flux density (Bx, By) could be neglected. Current density was then reconstructed at this slice position from denoised $$$B_{z}^{den}$$$ data as8
$$\mathbf{J}=\frac{1}{\mu_{0}}(\frac{\partial B_z^{den}}{\partial y},-\frac{\partial B_z^{den}}{\partial x},0) \ \ \ \ \ \ \ (1)$$
RESULTS
The left and middle columns of Fig. 2(a) and (b) show the x, and y-components of the estimated current density induced by the conventional and directional DBS electrodes. The corresponding current density magnitudes are displayed in the right column of Fig. 2(a) and (b) respectively. The measured current density values in ROIs arranged about each electrode location are also shown in Fig. 2c. As expected, current from the conventional electrode spread more uniformly than that from directional electrodes (right column of Fig 2(a) and (b)). Current densities in the lower (yellow) ROIs were larger for directional leads than for conventional leads.DISCUSSION
We have demonstrated that it is possible to reconstruct the current density images from both conventional and directional DBS leads. For electric field estimation8, it is essential to improve the SNR of the data. In future studies, we plan to measure current density distributions for directional leads in brain tissue phantoms and in animal models.CONCLUSIONS
Current density distributions in gel phantoms containing either conventional or directional DBS leads were reconstructed. It was found that current densities between a single energized directional electrode and a ground electrode on the phantom surface were larger than those found for a conventional DBS lead. With improved SNR, this approach can potentially be used to investigate details of electromagnetic fields around DBS leads to confirm simulation results and study DBS mechanisms.Acknowledgements
This work was supported by award RF1MH114290 to RJS.References
1. Groiss SJ, Wojtecki L, and Südmeyer M, et al. Deep brain stimulation in Parkinson's disease. Ther. Adv. Neurol. Disord. 2009; 2(6):20–28.
2. Nordin T, Zsigmond P, and Pujol S et al. White matter tracing combined with electric field simulation – a patient-specific approach for deep brain stimulation. NeuroImage: Clinical. 2019; in press.
3. Joy M L G, Scott G C, and Henkelman M In vivo detection of applied electric currents by magnetic resonance imaging. Magn. Reson. Imaging. 1989; 7(1), 89-94.
4. Sajib S Z K, Oh T I, and Kim H J et al. In vivo mapping of current density distribution in brain tissues during deep brain stimulation (DBS) AIP Adv. 2017; 7(1): 015004.
5. Chauhan M, Schär M, and Sahu S, et al. Fast MREIT acquisition using Multi-Band and SENSE Techniques Proc. Intl. Soc. Mag. Reson. Med. 27 (2019) 5046.
6. Kim M N, Ha T Y, Woo E J et al. Improved conductivity reconstruction from multi-echo MREIT utilizing weighted voxel-specific signal-to-noise ratios. Phys. Med. Biol. 2012; 57 (11):3643-59.
7. Lee B I, Lee S H, and Kim T S et al. Harmonic decomposition in PDE-based denoising technique for magnetic resonance electrical impedance tomography IEEE Trans. Biomed. Eng. 2005; 52(11):1912-1920
8. Kranjc M, Bajd F, and Serša I et al. Magnetic resonance electrical impedance tomography for monitoring electric field distribution during tissue electroporation. IEEE Trans. Med. Imaging. 2011; 30(10): 17771-8.
Figures