3177
MR signal modelling comparison and its influence on tissue parameters using gradient-echo MRI at 7 Telsa1Menzies Health Institute Queensland, Griffith University, Gold coast, Australia, 2Centre for Advanced Imaging, The University of Queensland, Brisbane, Australia, 3School of Information Technology and Electrical Engineering, The University of Queensland, Brisbane, Australia
Synopsis
Quantitative assessment of model parameters (water fraction and frequency shift) estimated using a multi-compartment model can be useful to study tissue properties in white matter. In this work, we compared common existing complex signal models for multi-echo gradient echo data acquired at 3T and 7T. We investigate the variation of model parameters that could potentially affect different models (number of compartments and parameters) on the estimation of tissue parameters. We show that the tissue parameters vary across the sub-regions of the corpus callosum and are influenced by different modelling choices.
INTRODUCTION
Myelin is one of the main components of white matter tissue in the brain that acts as an axonal insulator to help conduct neuronal signals. Demyelination has been associated with different white matter diseases like multiple sclerosis, schizophrenia, brain stroke and even with Alzheimer’s disease. 1–5 A number of signal compartment models for GRE-MRI data have been proposed for the mapping of various tissue parameters.6–8 The models assume myelin, axonal and extracellular signal compartments, and with water fraction, $$$T_2^*$$$ value, and frequency shift as parameters for each compartment.Existing studies have used different number of compartments and model parameters and observed differences in the estimated myelin water fraction and frequency shift in genu and splenium of the corpus callosum (CC). This could be due to model settings (number of compartments, model complexity), or use of different methods of optimisation. Here we investigate: i) how are tissue parameter estimates influenced by model choice, ii) how many compartments and parameters are necessary to obtain a robust measure of myelin water fraction and g-ratio.
METHODS
The study was approved by the university human ethics committee and written informed consent was obtained from ten healthy participants (aged 30-41). Data were acquired using a 3D GRE-MRI sequence on a 7T whole-body MRI research scanner (Siemens Healthcare, Erlangen, Germany) with a 32 channel head coil (Nova Medical, Wilmington, USA) using the following parameters: TE1=2.04ms with echo spacing of 1.53ms and 30 echoes, TR=51ms, flip-angle=20o, voxel-size=1mm$$$\times$$$1mm$$$\times$$$1mm and matrix size=210$$$\times$$$168$$$\times$$$144. Individual channel data were processed before images were combined.9 A brain mask for each participant was created using FSL BET.10 iHARPERELLA (http://people.duke.edu/~cl160, STI Suite11) was used to compute tissue phase for each echo. The CC was segmented manually into seven sub-regions, using a standardised template12 (Fig.1) to estimate water fractions and gratio. The g-ratio was estimated converting myelin and axonal water fraction into volume fraction. 13,14 We also performed a voxel based analysis across the CC. Signal fitting was performed using NAM, 6, SATI,7, THAPALIYA,8 methods and additionally we used a three compartment (3COMP, 7 parameter) and two compartment (2COMP,5 parameter) models:$$$S\left(t\right)=\left[A_{1}e^{-\left(\frac{1}{T_{2,1}^*}+i2\pi\triangle f_{1}\right)t}+A_{2} e^{-\left(\frac{1}{T_{2,2}^*}+i2\pi\triangle f_{2}\right)t}+A_{3}e^{-\left(\frac{1}{T_{2,2}^*}+i2\pi\triangle f_{3}\right)t}\right] $$$ (1)
$$$S\left(t\right)=\left[A_{1}e^{-\left(\frac{1}{T_{2,1}^*}+i2\pi\triangle f_{1}\right)t}+A_{2+3} e^{-\left(\frac{1}{T_{2,2}^*}+i2\pi\triangle f_{2}\right)t}\right] $$$ (2)
where A1, A2 and A3 are water fractions for the myelin, axonal, and extracellular compartments, or combined axonal and extracellular compartments (A2+3), respectively, and corresponding relaxation times ($$$T_{2,i}^*$$$) and frequency shifts ($$$\Delta f_{i}$$$). In Eqs. 1 and 2, the relaxation time of the myelin compartment was 7 ms15, and the relaxation time of the axonal and extracellular compartments were set to be the same.16 Parameter fitting was performed in MATLAB (MathWorks, Natick, MA) using nonlinear curve fitting (lsqnonlin). The model selection was performed using the corrected version of the Akaike Information criterion (AICc)17 and performance was assessed by computing the standard error rate.
RESULTS
Figure. 2 provides region-based model analysis of MWF calculated using the various GRE-MRI signal compartment models and the fitting error associated with each of the models. The 2COMP model produced the largest variation in the mean MWF value across the corpus callosum ROIs, and it also has the largest inter-participant variation. The 3COMP, SATI, NAM, and THAPALIYA methods led to fairly consistent MWF values with similar fitting errors.Figure. 3 shows the g-ratio calculated using myelin and axonal water fraction. The g-ratio estimated from SATI, NAM and THAPALIYA showed similar values across the sub-regions of the corpus callosum but 3COMP yielded higher values posterior mid-body, isthmus, and splenium1 of the corpus callosum in comparison to other models.
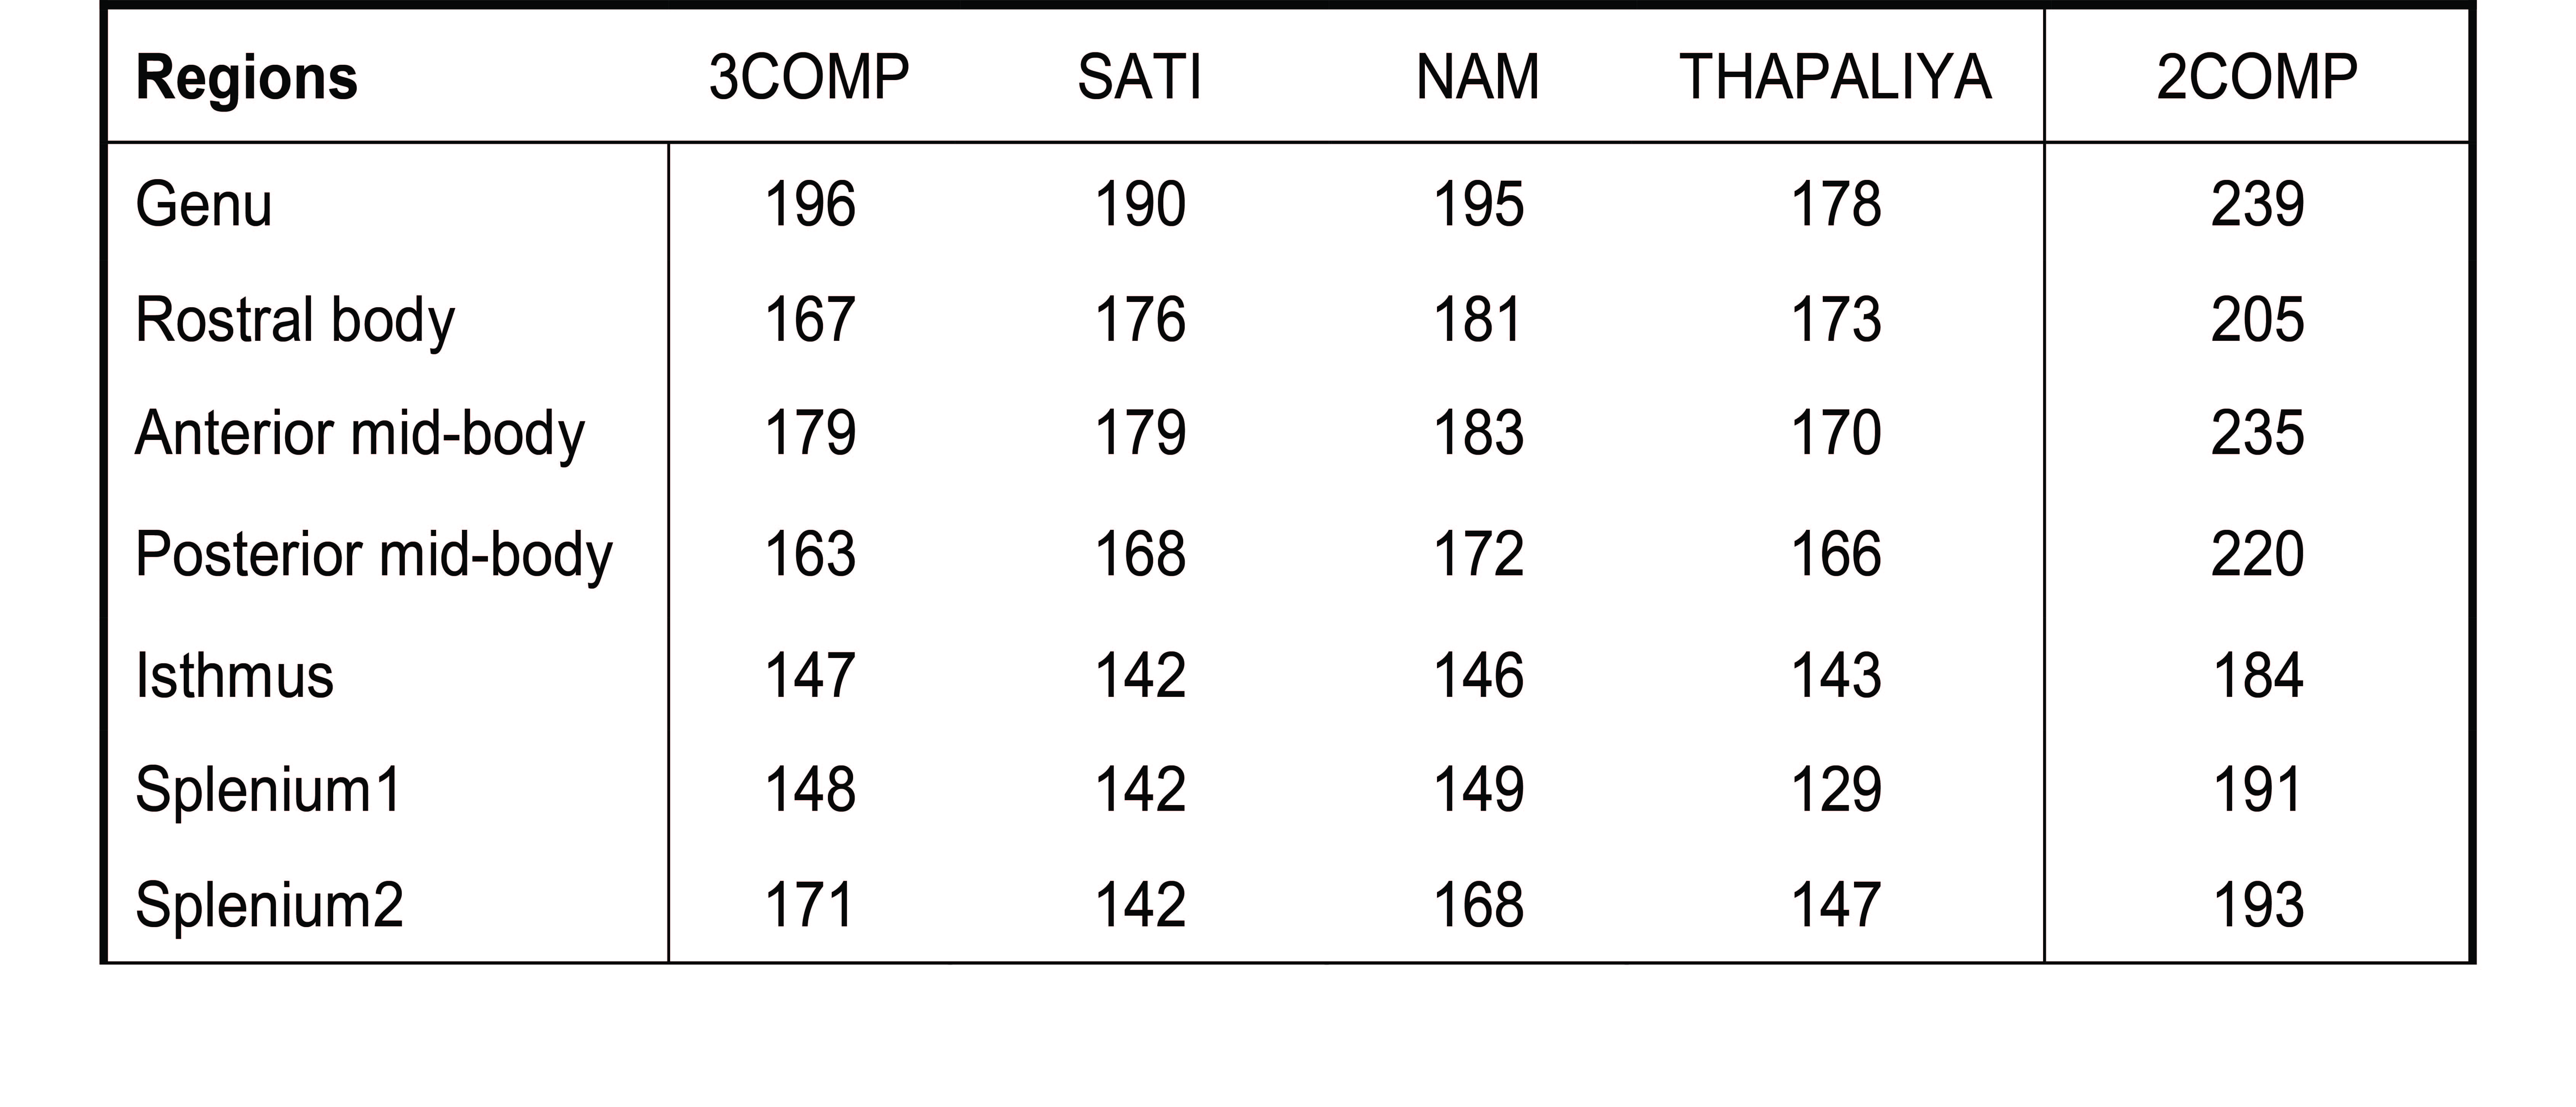
Figure. 4 shows the voxel-by-voxel fit results for MWF and model fitting errors in ten participants for all models. MWF results from 3COMP, SATI, NAM and THAPALIYA are consistent whereas 2COMP showed higher variation in comparision to other methods. We also observed the model fitting error to be larger for two signal compartments (2COMP) versus three signal compartments (3COMP, SATI, NAM and THAPALIYA). Model selection was performed using AICc as shown in Table 1. Three compartment models (3COMP, SATI, NAM and THAPAILYA) have low AICc in-comparison to two-compartment model (2COMP) for all seven smaller regions irrespective of the number of free model parameters. The three compartment models performed similarly.
DISCUSSION
We used multi-echo GRE-MRI data to generate signal compartment model parameters based on five different models. Myelin water fractions consistent with our findings (see Figure. 2) have been reported for the genu, splenium, and across primary corpus callosum regions. 8,18–20 The myelin water fraction and g-ratio results showed some inter-subject variability consistent with values reported previously.8 This could be due to low signal-to-noise ratios present in comparison with region-based analysis.6CONCLUSION
We investigated the utility of existing GRE-MRI signal compartment models for the characterisation of tissue microstructure in the corpus callosum. We found the reduced two signal compartment five free parameter model to be less appropriate. Three signal compartment models showed comparable myelin water fraction and g-ratio maps across model types and subjects. Based on our findings, it also appears that at least a three-signal compartment with seven free parameter GRE-MRI signal compartment model is required.Acknowledgements
KT acknowledges a University of Queensland international (UQI) PhD scholarship. MB acknowledges funding from the Australian Research Council Future Fellowship grant FT140100865. The authors acknowledge the facilities and scientific and technical assistance of the National Imaging Facility, a National Collaborative Research Infrastructure Strategy (NCRIS) capability, at the Centre for Advanced Imaging, The University of Queensland. VV acknowledges support from the Australian National Health and Medical Research Council (NHMRC APP1104933).References
1. Bejanin, A. et al. Distinct white matter injury associated with medial temporal lobe atrophy in Alzheimer’s versus semantic dementia. Hum. Brain Mapp. (2016) doi:10.1002/hbm.23482.
2. Laule, C. et al. Water content and myelin water fraction in multiple sclerosis. J. Neurol. 251, 284–293 (2004).
3. Lehto, L. J., Sierra, A. & Gröhn, O. Magnetization transfer SWIFT MRI consistently detects histologically verified myelin loss in the thalamocortical pathway after a traumatic brain injury in rat. NMR Biomed. (2016) doi:10.1002/nbm.3678.
4. MacKay, A. et al. Insights into brain microstructure from the T2 distribution. Magn. Reson. Imaging 24, 515–525 (2006).
5. Moore, G. R. et al. A pathology-MRI study of the short-T2 component in formalin-fixed multiple sclerosis brain. Neurology 55, 1506–1510 (2000).
6. Nam, Y., Lee, J., Hwang, D. & Kim, D.-H. Improved estimation of myelin water fraction using complex model fitting. NeuroImage 116, 214–221 (2015).
7. Sati, P. et al. Micro-compartment specific T2⁎ relaxation in the brain. NeuroImage 77, 268–278 (2013).
8. Thapaliya, K., Vegh, V., Bollmann, S. & Barth, M. Assessment of microstructural signal compartments across the corpus callosum using multi-echo gradient recalled echo at 7 T. NeuroImage 182, 407–416 (2018).
9. Bollmann, S., Zimmer, F., O’Brien, F., Vegh, V. & Barth, M. When to perform channel combination in 7 Tesla quantitative susceptibility mapping? in Organization of the Human Brain Mapping (2015).
10. Smith, S. M. et al. Advances in functional and structural MR image analysis and implementation as FSL. NeuroImage 23, S208–S219 (2004).
11. Li, W., Avram, A. V., Wu, B., Xiao, X. & Liu, C. Integrated Laplacian-based phase unwrapping and background phase removal for quantitative susceptibility mapping. NMR Biomed. 27, 219–227 (2014). 12. Witelson, S. F. Hand and Sex Differences in the Isthmus and Genu of the Human Corpus Callosum. Brain 112, 799–835 (1989).
13. Stikov, N. et al. In vivo histology of the myelin g-ratio with magnetic resonance imaging. NeuroImage 118, 397–405 (2015).
14. Jung, W., Nam, Y., Zhang, H. & Lee, J. Whole brain in-vivo g-ratio mapping using neurite orientation dispersion and density imaging (NODDI) and GRE myelin water imaging (GRE-MWI). in Proc. Intl. Soc. Mag. Reson. Med. 24 (2016).
15. Thapaliya, K., Bollmann, S., Vegh, V. & barth, M. Signal Compartments Modelled from 7T Multi-Echo GE Data Showed Variation Across the Corpus Callosum. in Proc. Intl. Soc. Mag. Reson. Med. 25 (2017).
16. Xu, T., Foxley, S., Kleinnijenhuis, M., Chen, W. C. & Miller, K. L. The effect of realistic geometries on the susceptibility-weighted MR signal in white matter. ArXiv170302817 Phys. (2017) doi:10.1002/mrm.26689.
17. Burnham, K. P. & Anderson, D. R. Multimodel Inference: Understanding AIC and BIC in Model Selection. Sociol. Methods Res. 33, 261–304 (2004).
18. Guo, J., Ji, Q. & Reddick, W. E. Multi-slice myelin water imaging for practical clinical applications at 3.0 T. Magn. Reson. Med. 70, 813–822 (2013).
19. Liu, F., Vidarsson, L., Winter, J. D., Tran, H. & Kassner, A. Sex differences in the human corpus callosum microstructure: A combined T2 myelin-water and diffusion tensor magnetic resonance imaging study. Brain Res. 1343, 37–45 (2010).
20. Whittall, K. P. et al. In vivo measurement of T2 distributions and water contents in normal human brain. Magn. Reson. Med. 37, 34–43 (1997).
Figures