3176
Signal Intensity in Dentate Nucleus Does Not Always Correlate with Accumulative Gadolinium doses after Whole-Brain Radiotherapy1Ruijin Hospital, Shanghai, China, 2Ruijin Hosptial, Shanghai, China, 3Philips Healthcare, Shanghai, China
Synopsis
Whole-brain radiotherapy (WBRT) is often performed asynchronously with head contrast-enhanced MRI examination (CEME) in patients with brain metastasis (BM). Data regarding T1 signal intensity (SI) changes in the dentate nucleus (DN) in BM patients after WBRT and repeated exposure to gadolinium (Gd)-based contrast agents (GBCAs) are lacking. In this study, we explored the correlation between T1 SI in the DN and cumulative doses of linear GBCAs in BM patients treated with WBRT.
Introduction Gadolinium (Gd)-based contrast agents (GBCAs) are commonly used in various clinical MRI examinations. Some previous studies have demonstrated increased signal intensity (SI) in the dentate nucleus (DN) and globus pallidus (GP) on unenhanced T1-weighted image (UT1WI) after repeated exposure to GBCAs (1-4). Histological examination has confirmed that the increased T1 SI in the deep brain nuclei was caused by Gd deposition (5-7). Since free Gd (Gd3+) is a heavy metal with toxicity, the Gd deposition in these neurological functional nuclei has raised concerns about potential neurological complications (6, 8-10). Whole-brain radiotherapy (WBRT) is a type of irradiation treatment delivered to the entire brain over multiple visits. Due to this wide range of irradiation, DNs are always included in the irradiation field of WBRT. Additionally, head contrast-enhanced MRI examinations (CEMEs) are usually performed to assess whether there is BM when a patient is diagnosed as cancer, especially lung cancer or mammary cancer. As a result, patients with BM often receive multiple doses of GBCAs. Irradiation can cause vascular damage to increase its permeability, which may cause an accelerated leakage of Gd (11-14). The accelerated leakage of Gd may further lead to an additional increase in T1 SI in the DN after repeated exposure to GBCAs. Up to now, the extent of this impact in patients with BM has not been investigated.
Methods
Patients: The electronic medical records (EMR), PACS, and radiology information systems (RIS) were searched from January 2010 to December 2018 to identify consecutive patients with BM who had undergone WBRT and head CEMEs. Imaging Protocol: All head CEMEs were performed with one of six MRI systems at our institution. All MR examinations included an axial unenhanced T1WI sequence, T2 FLAIR, and contrast-enhanced sequence (CES).
Data Analysis: The radiation doses (RDs) to the left and right DNs were calculated. The SIs were measured using the Uniweb Viewer software (EBM Technologies, China). All measurement screenshots were saved and were all reviewed. Oval regions of interest (ROIs) were drawn as large as possible within the DN, and the same size was used for CWM near the DN.
Statistical Analysis: All analyses were performed with software SPSS and GraphPad Prism. Analysis included the Shapiro-Wilk test, paired t test, Wilcoxon test, and Spearman correlation coefficient (r).
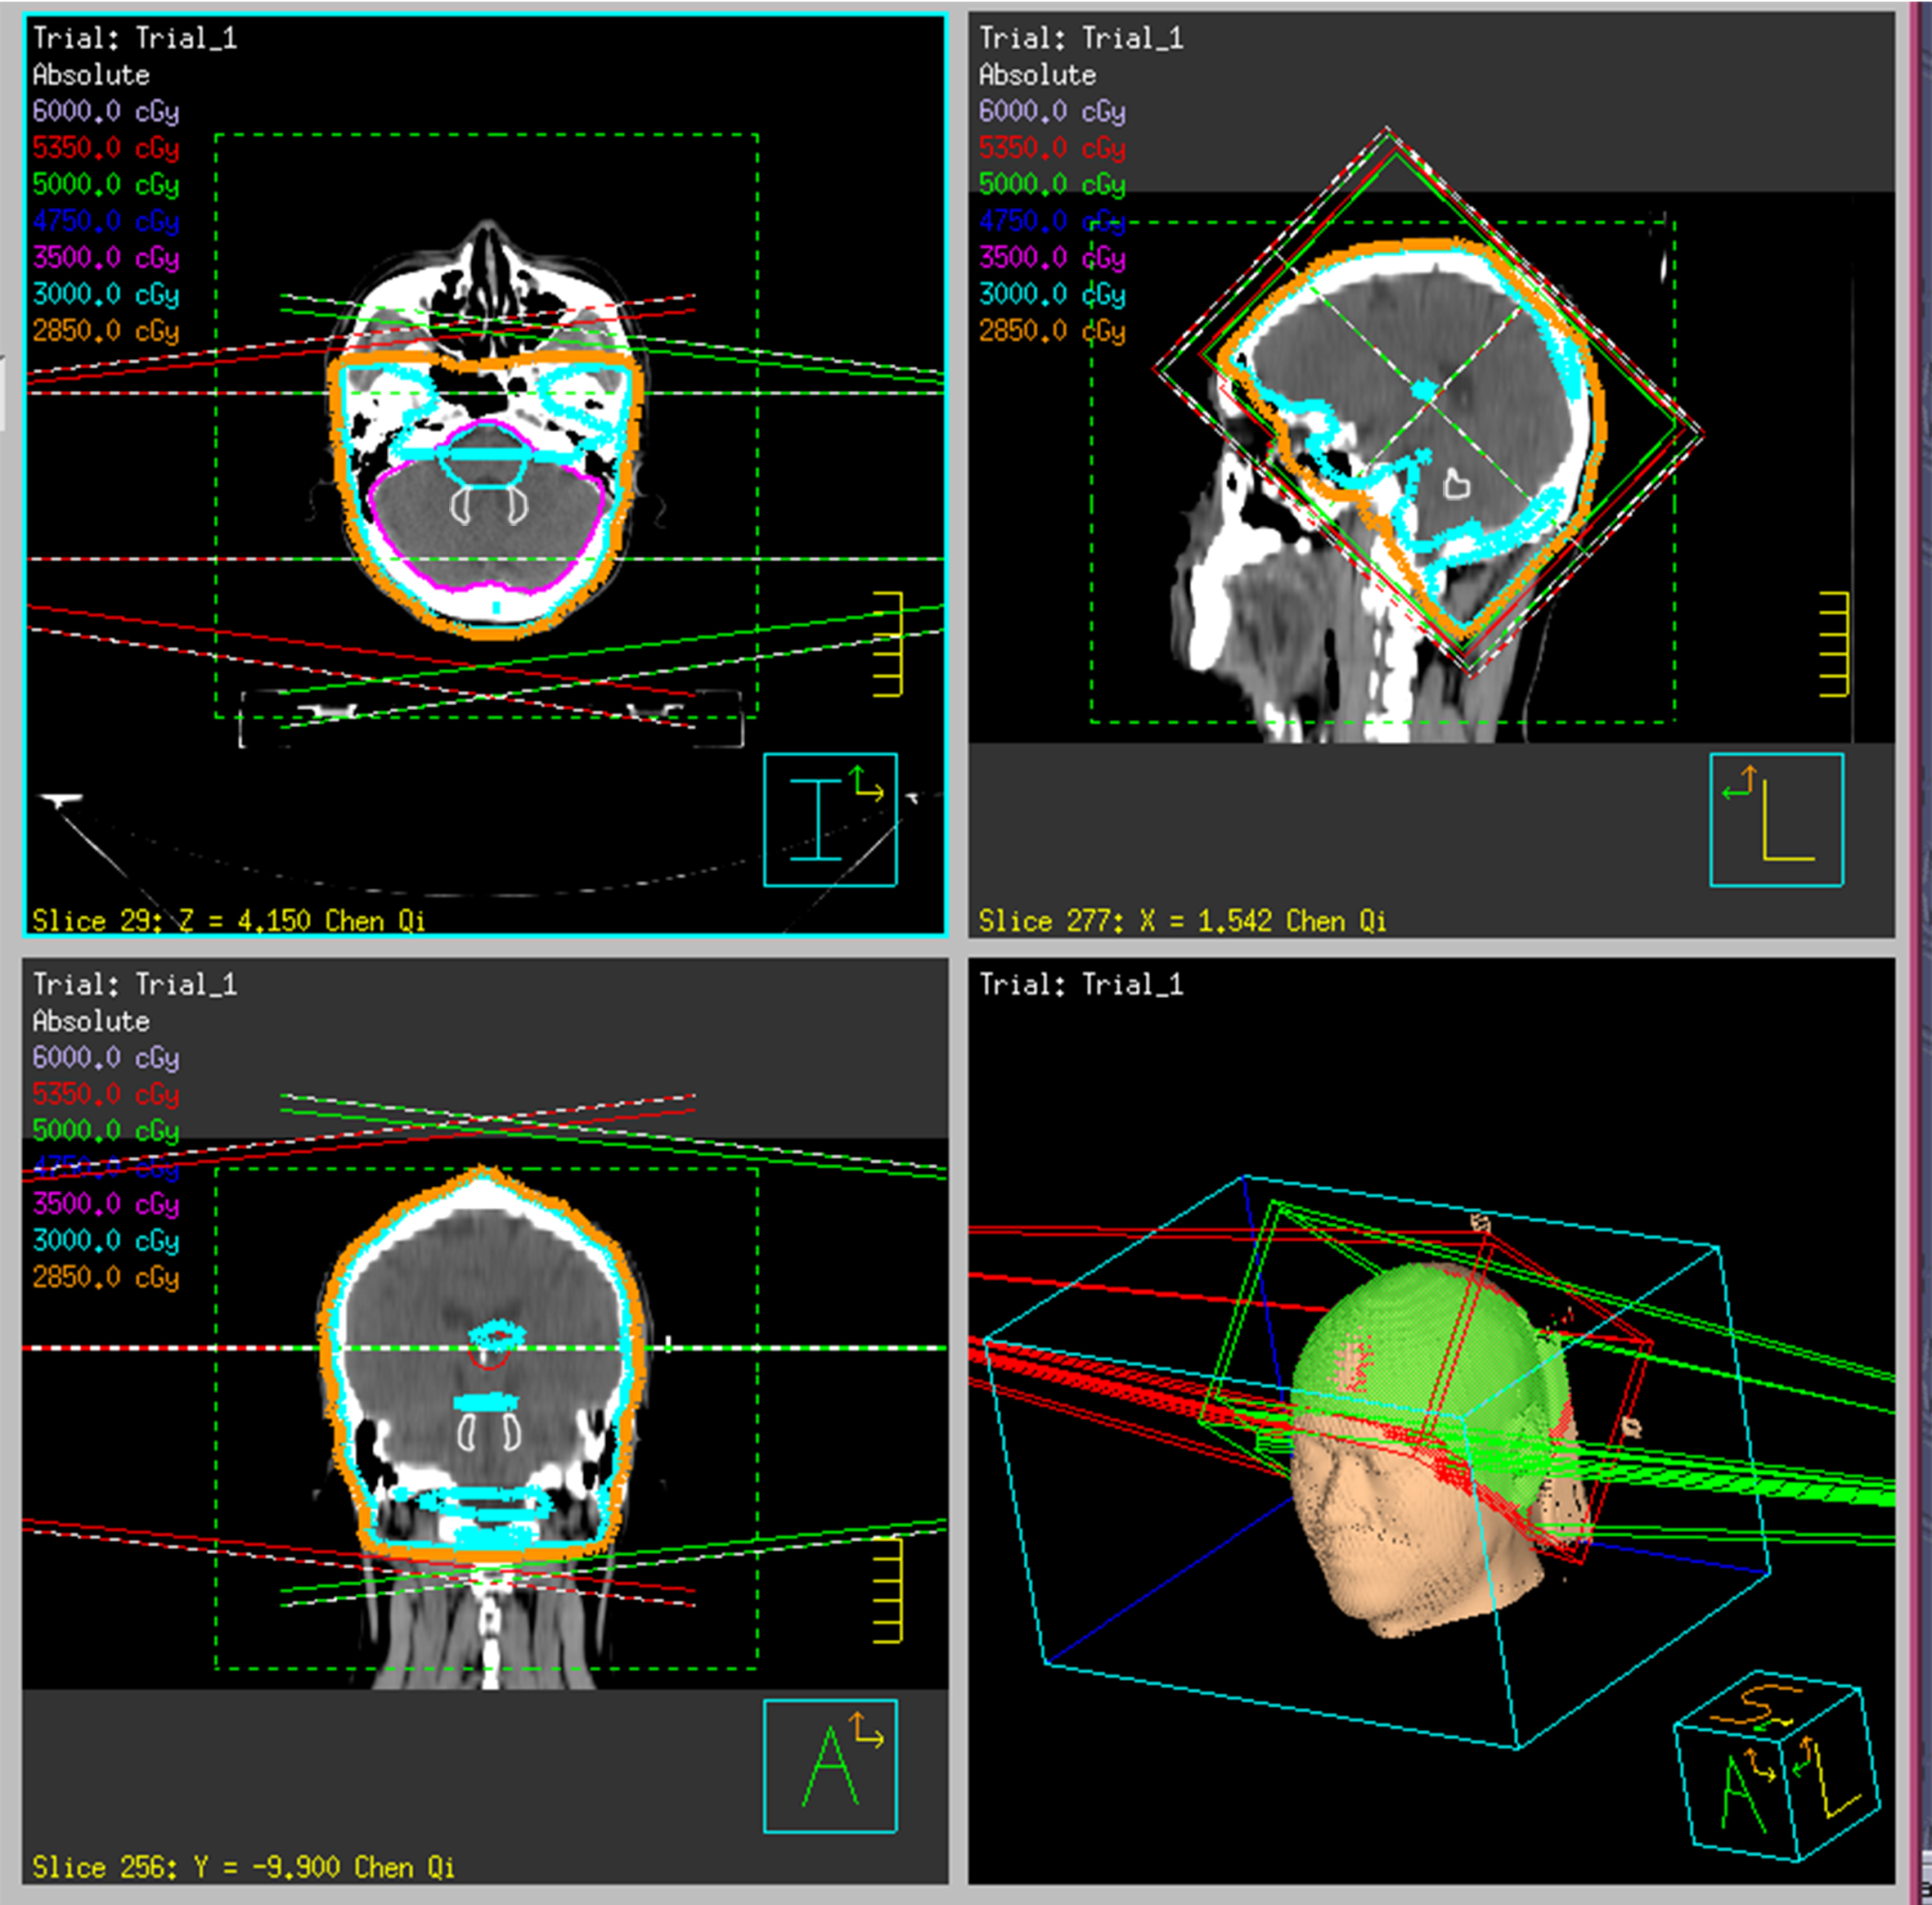
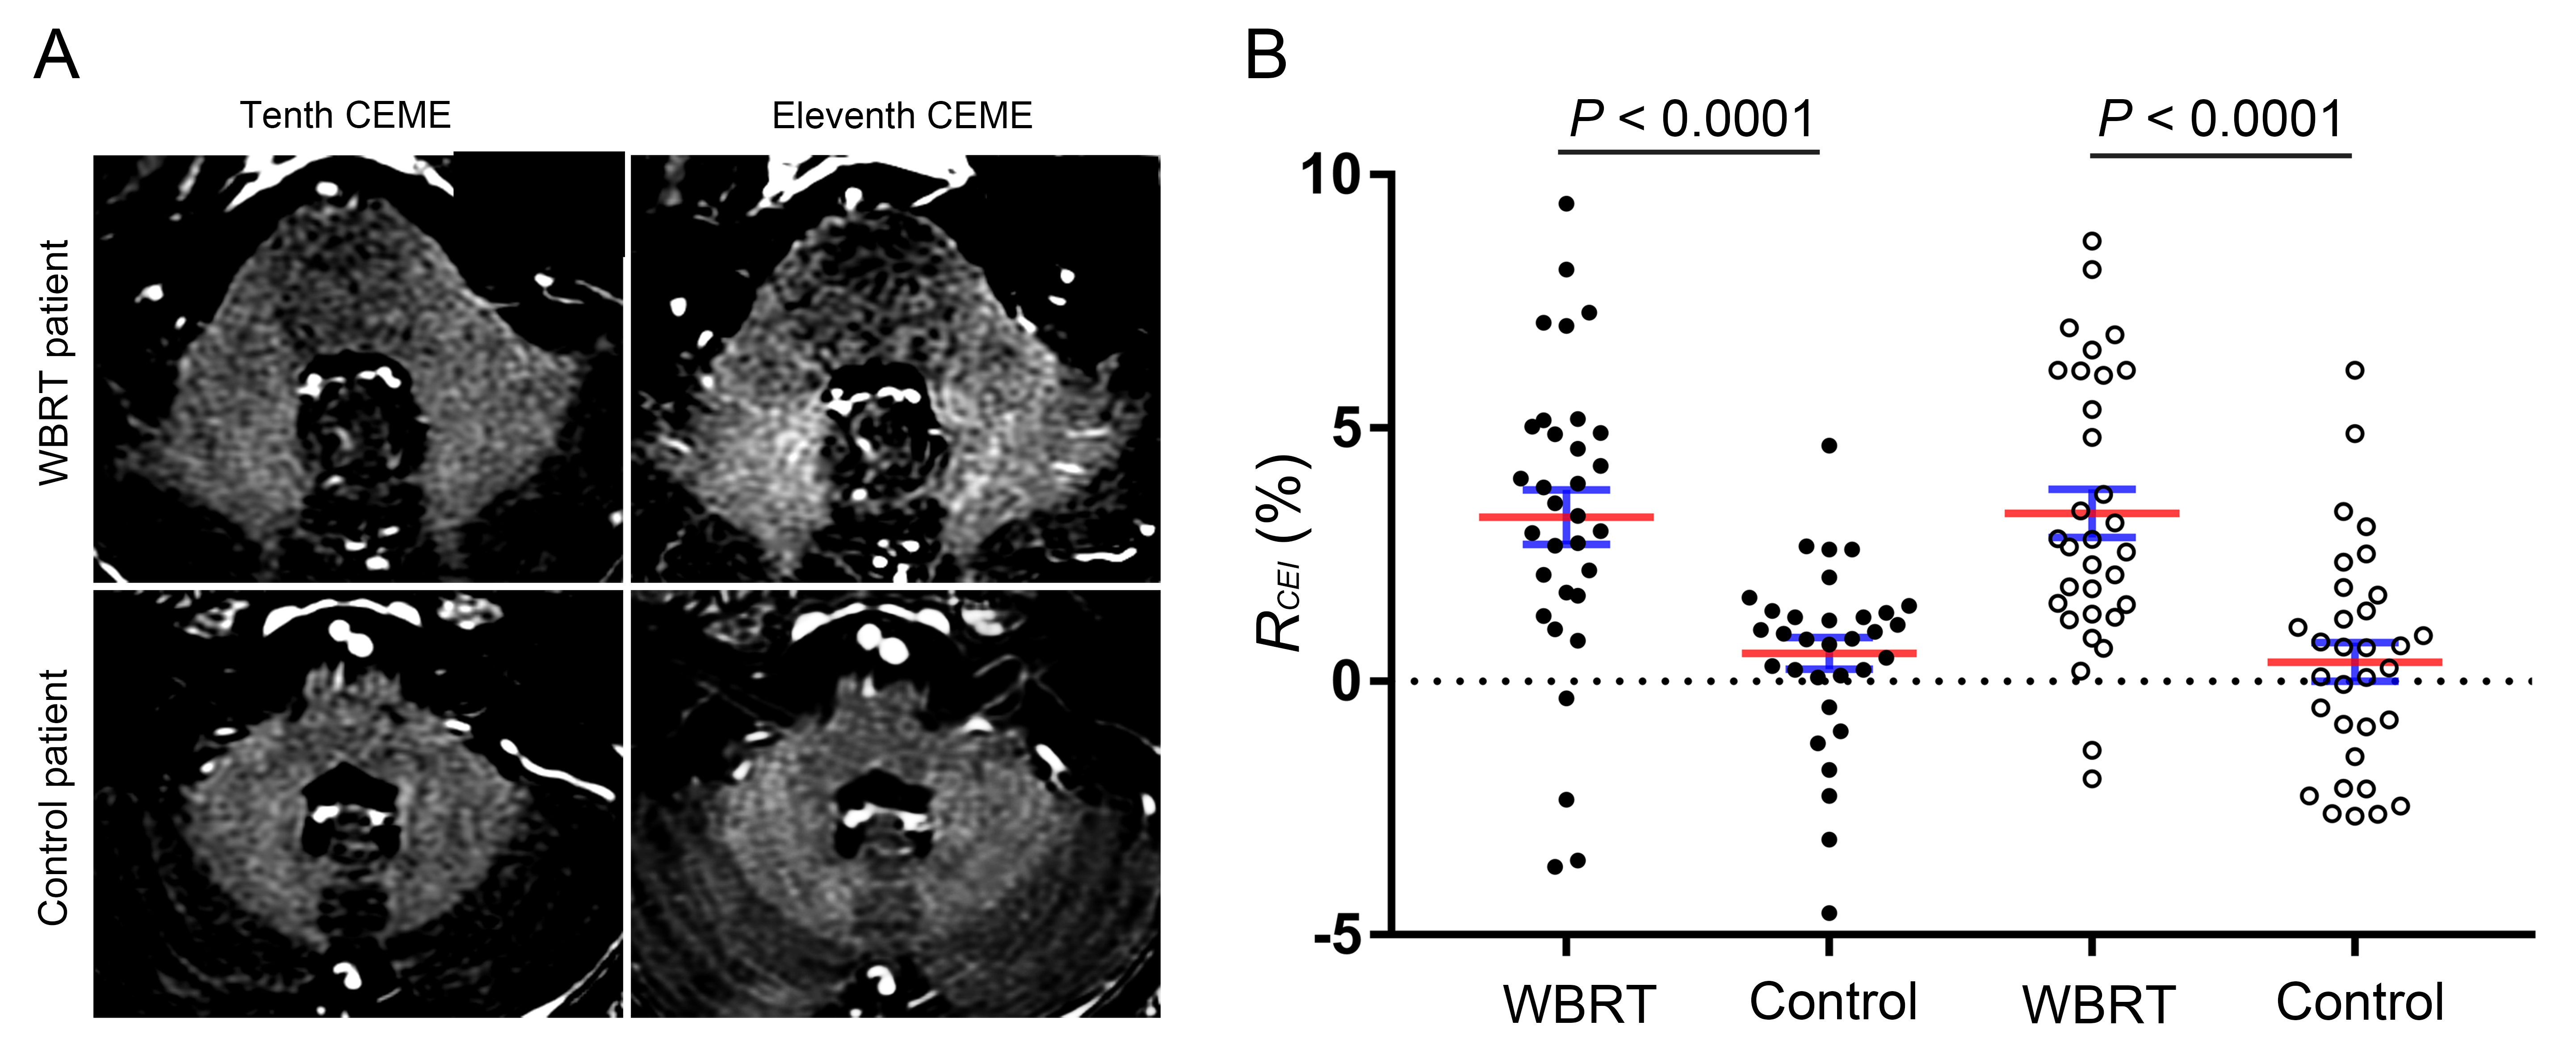
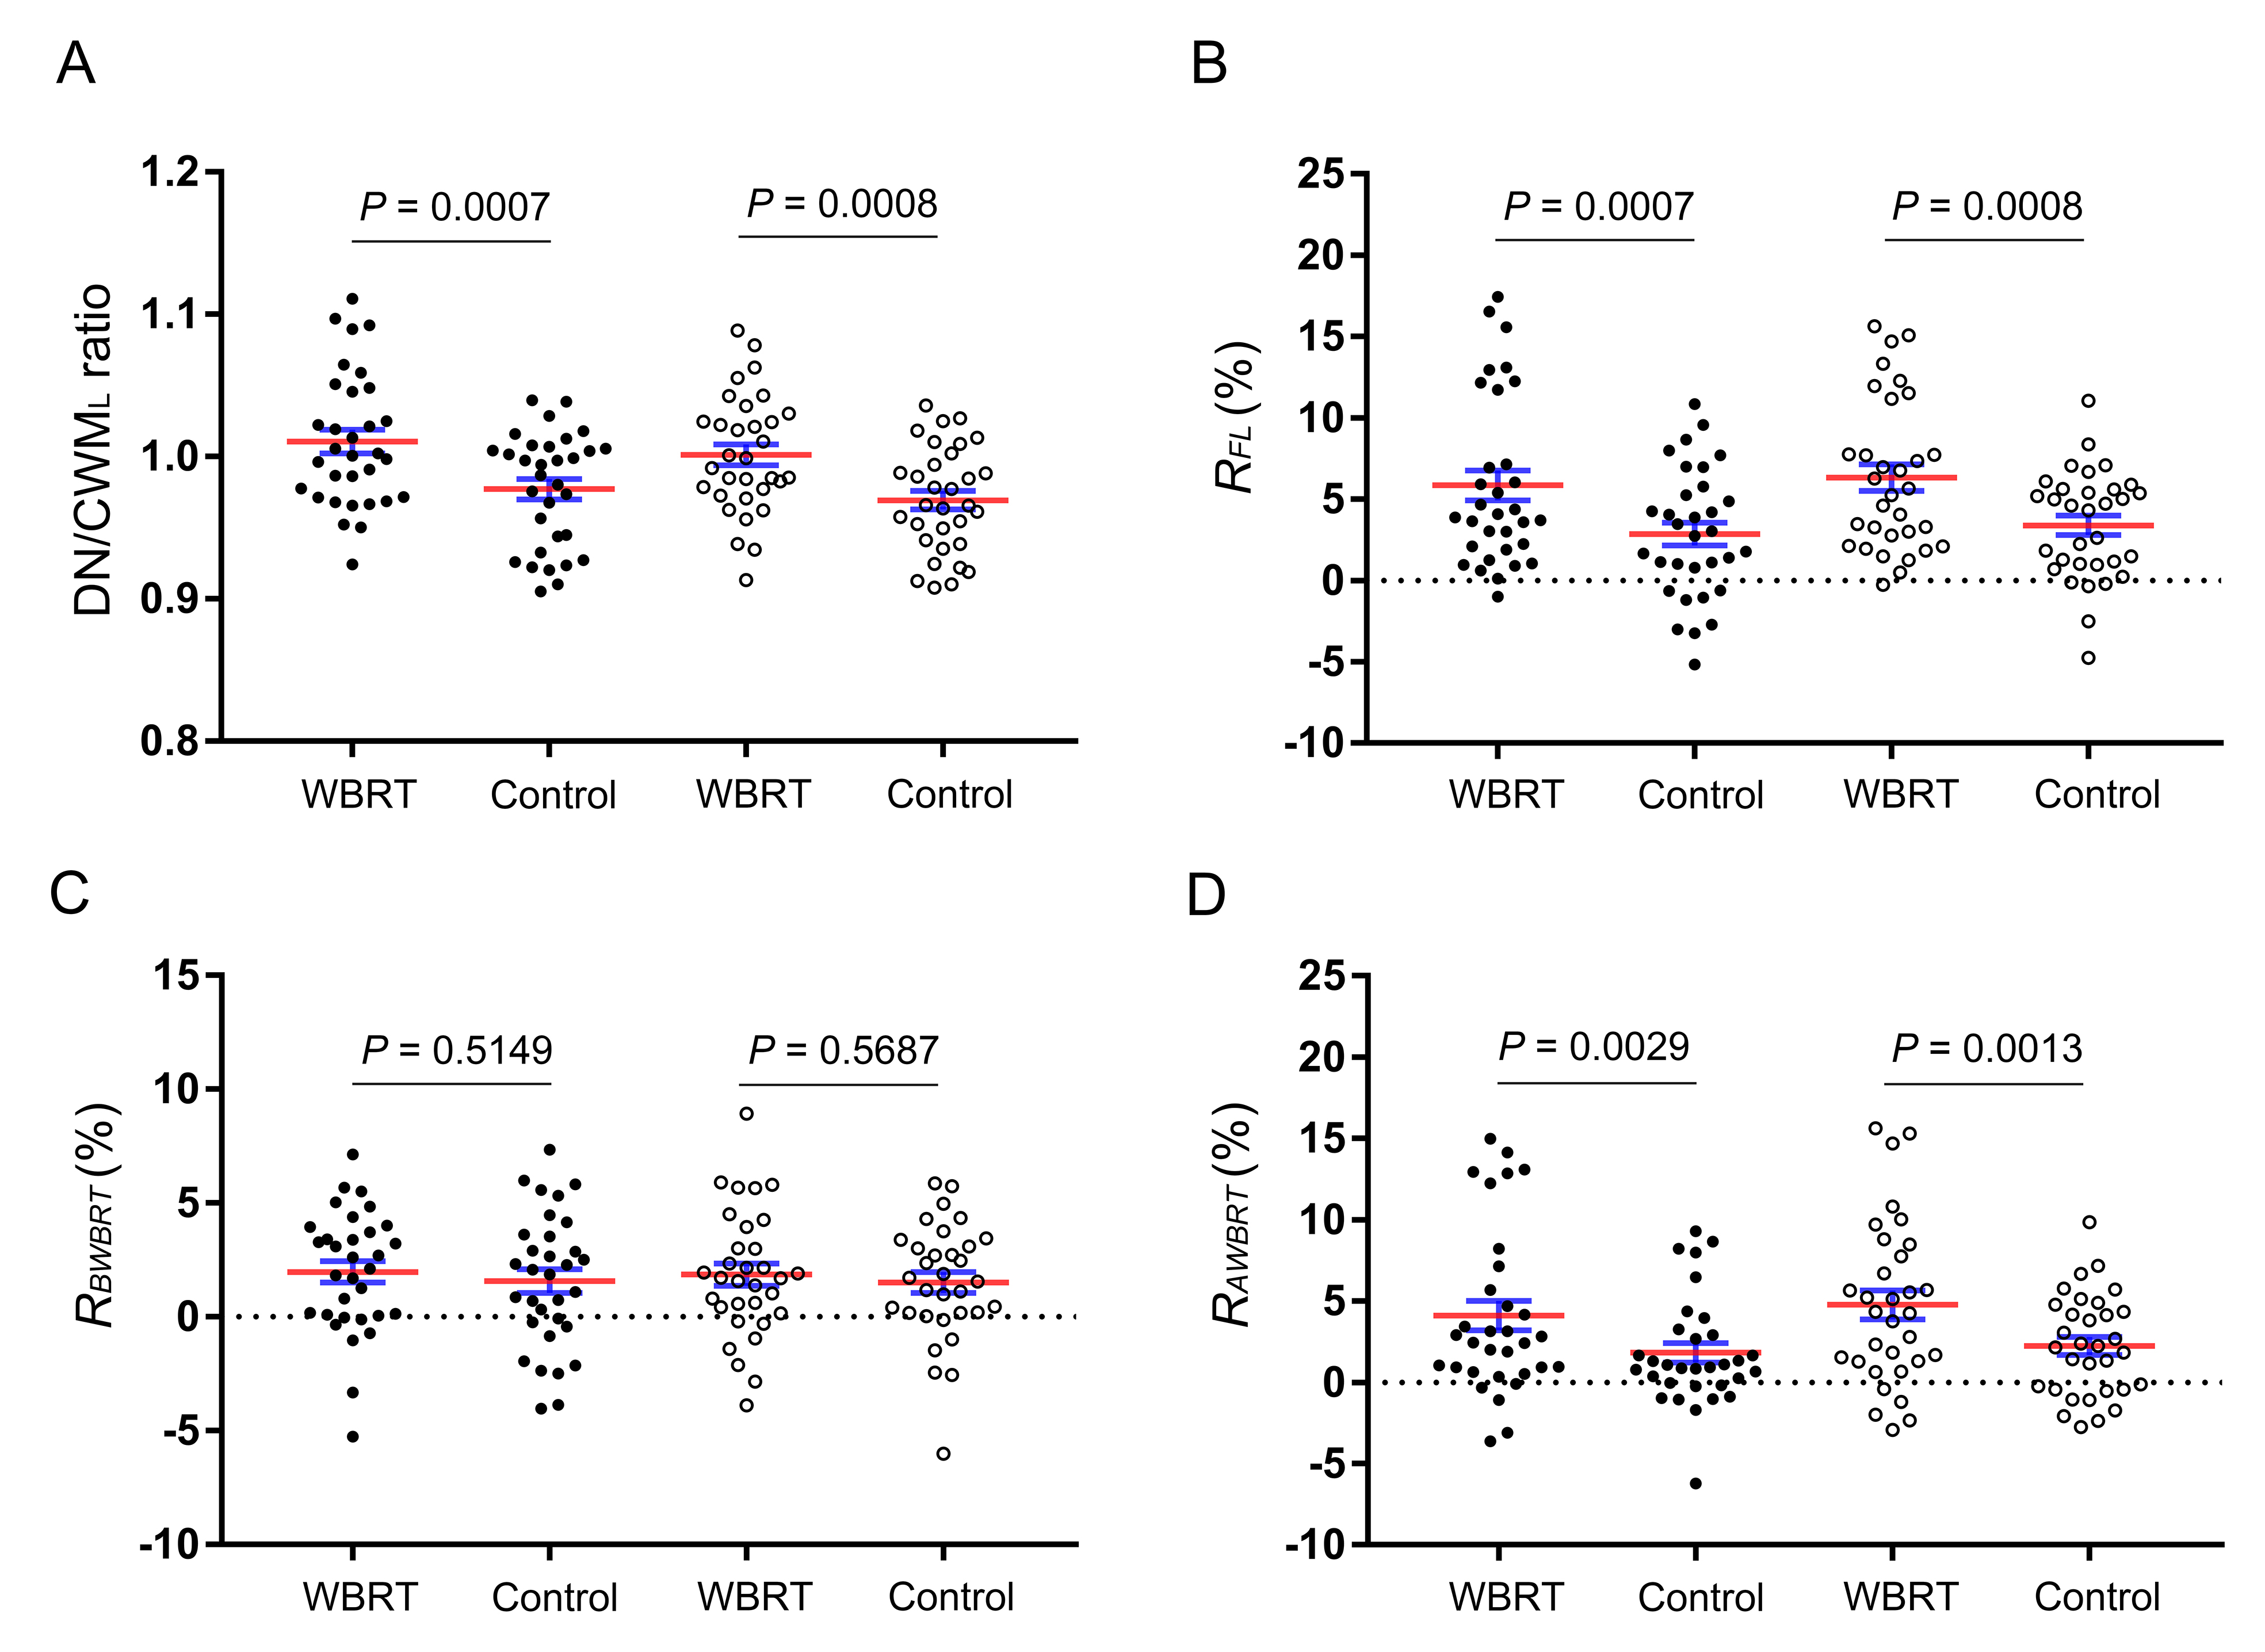
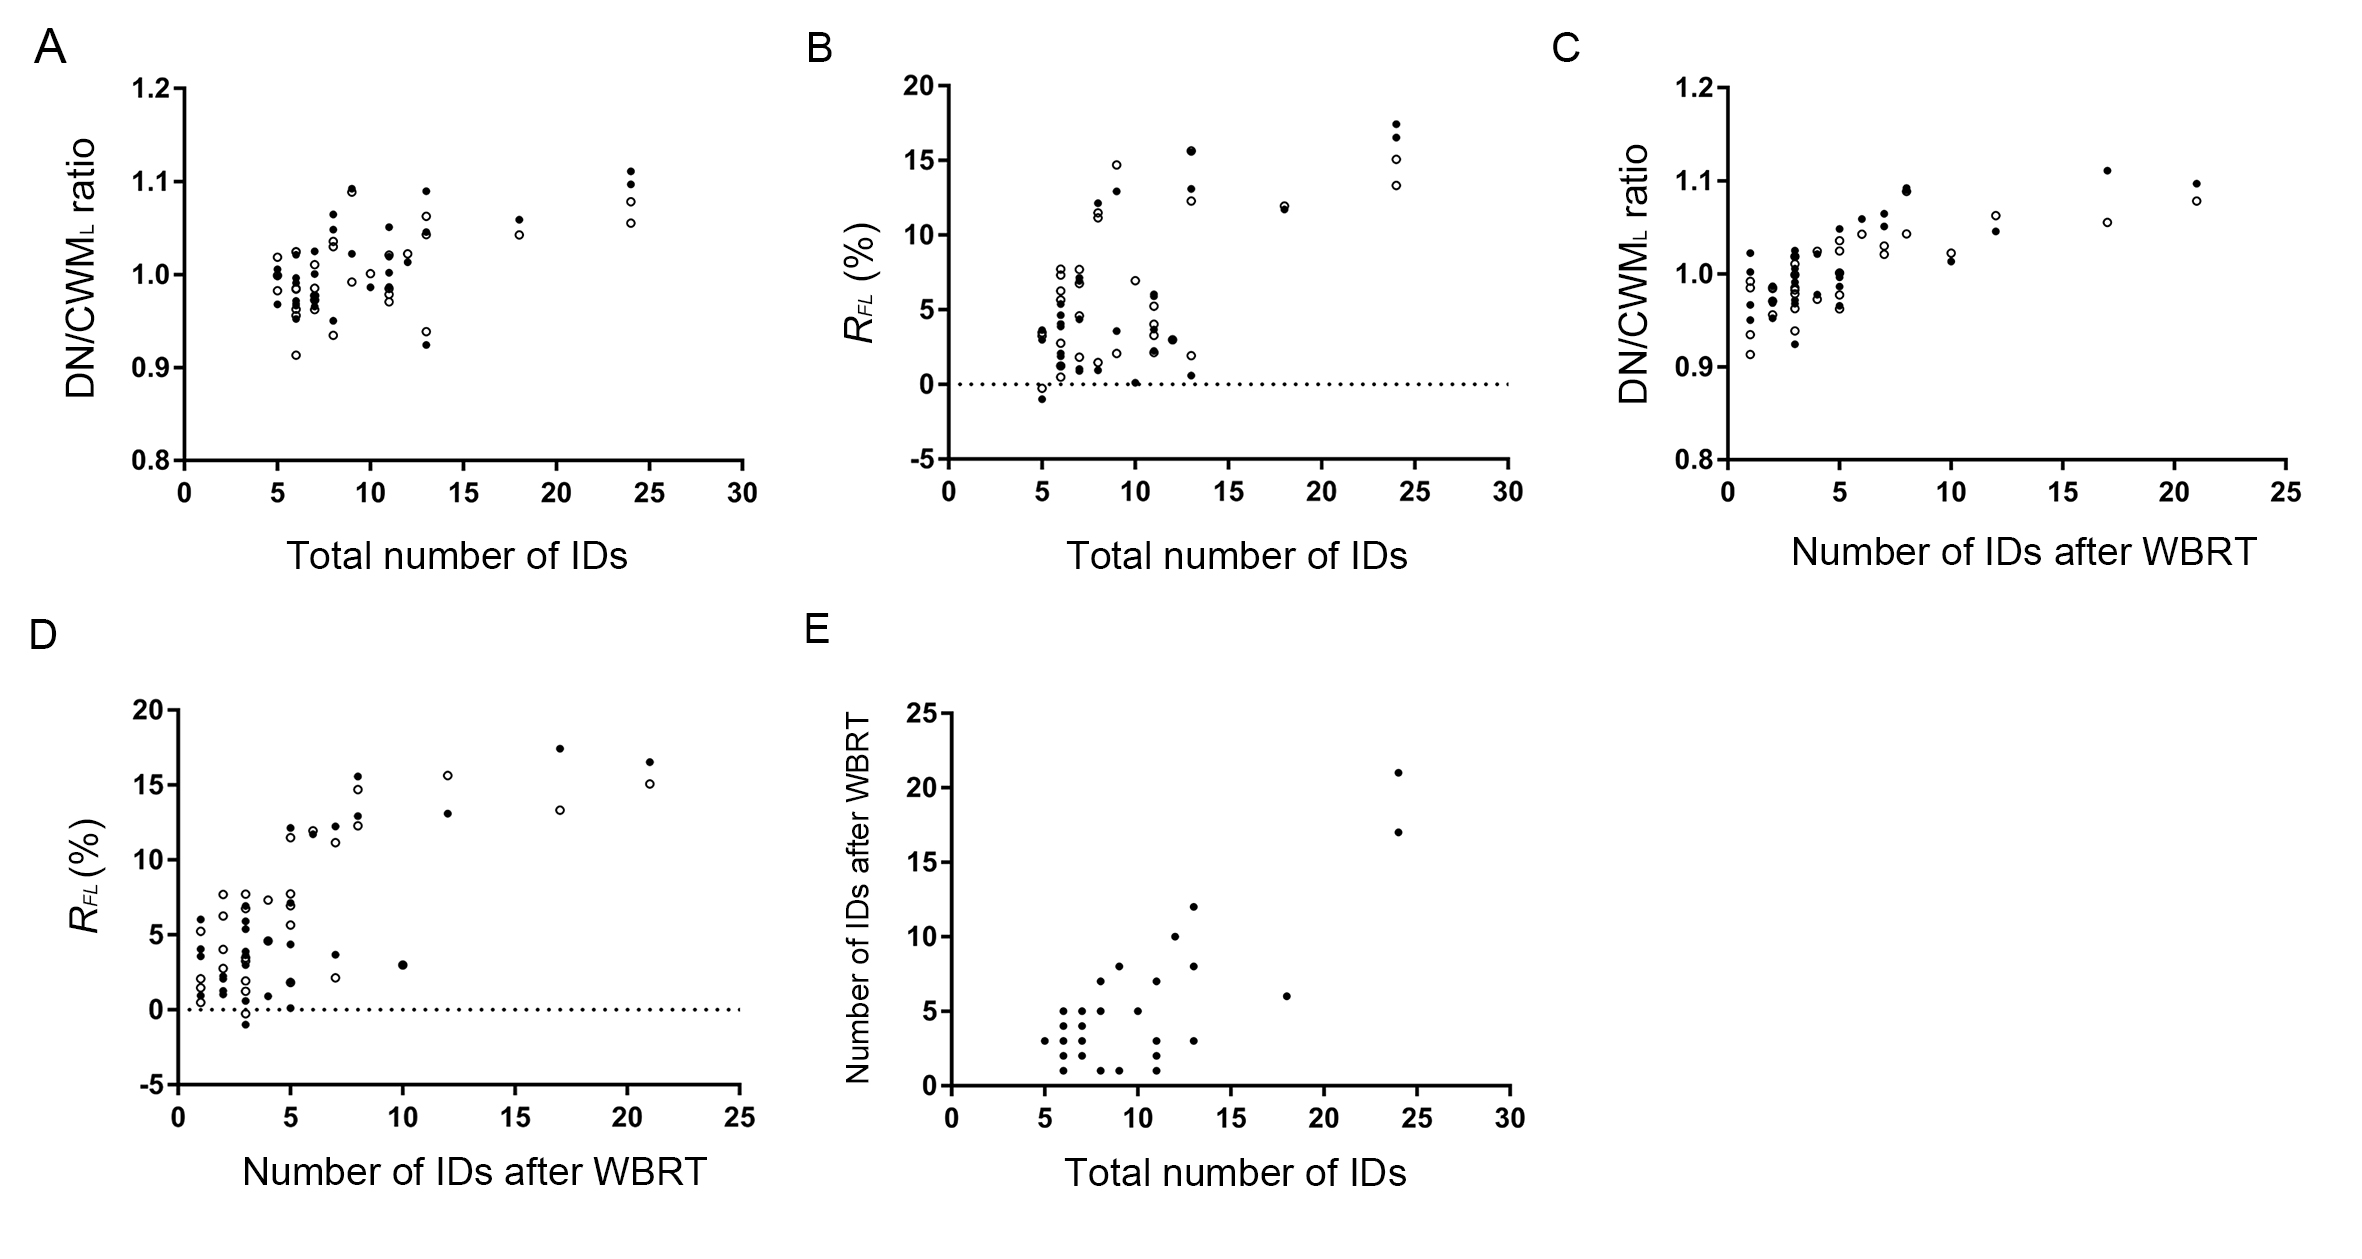
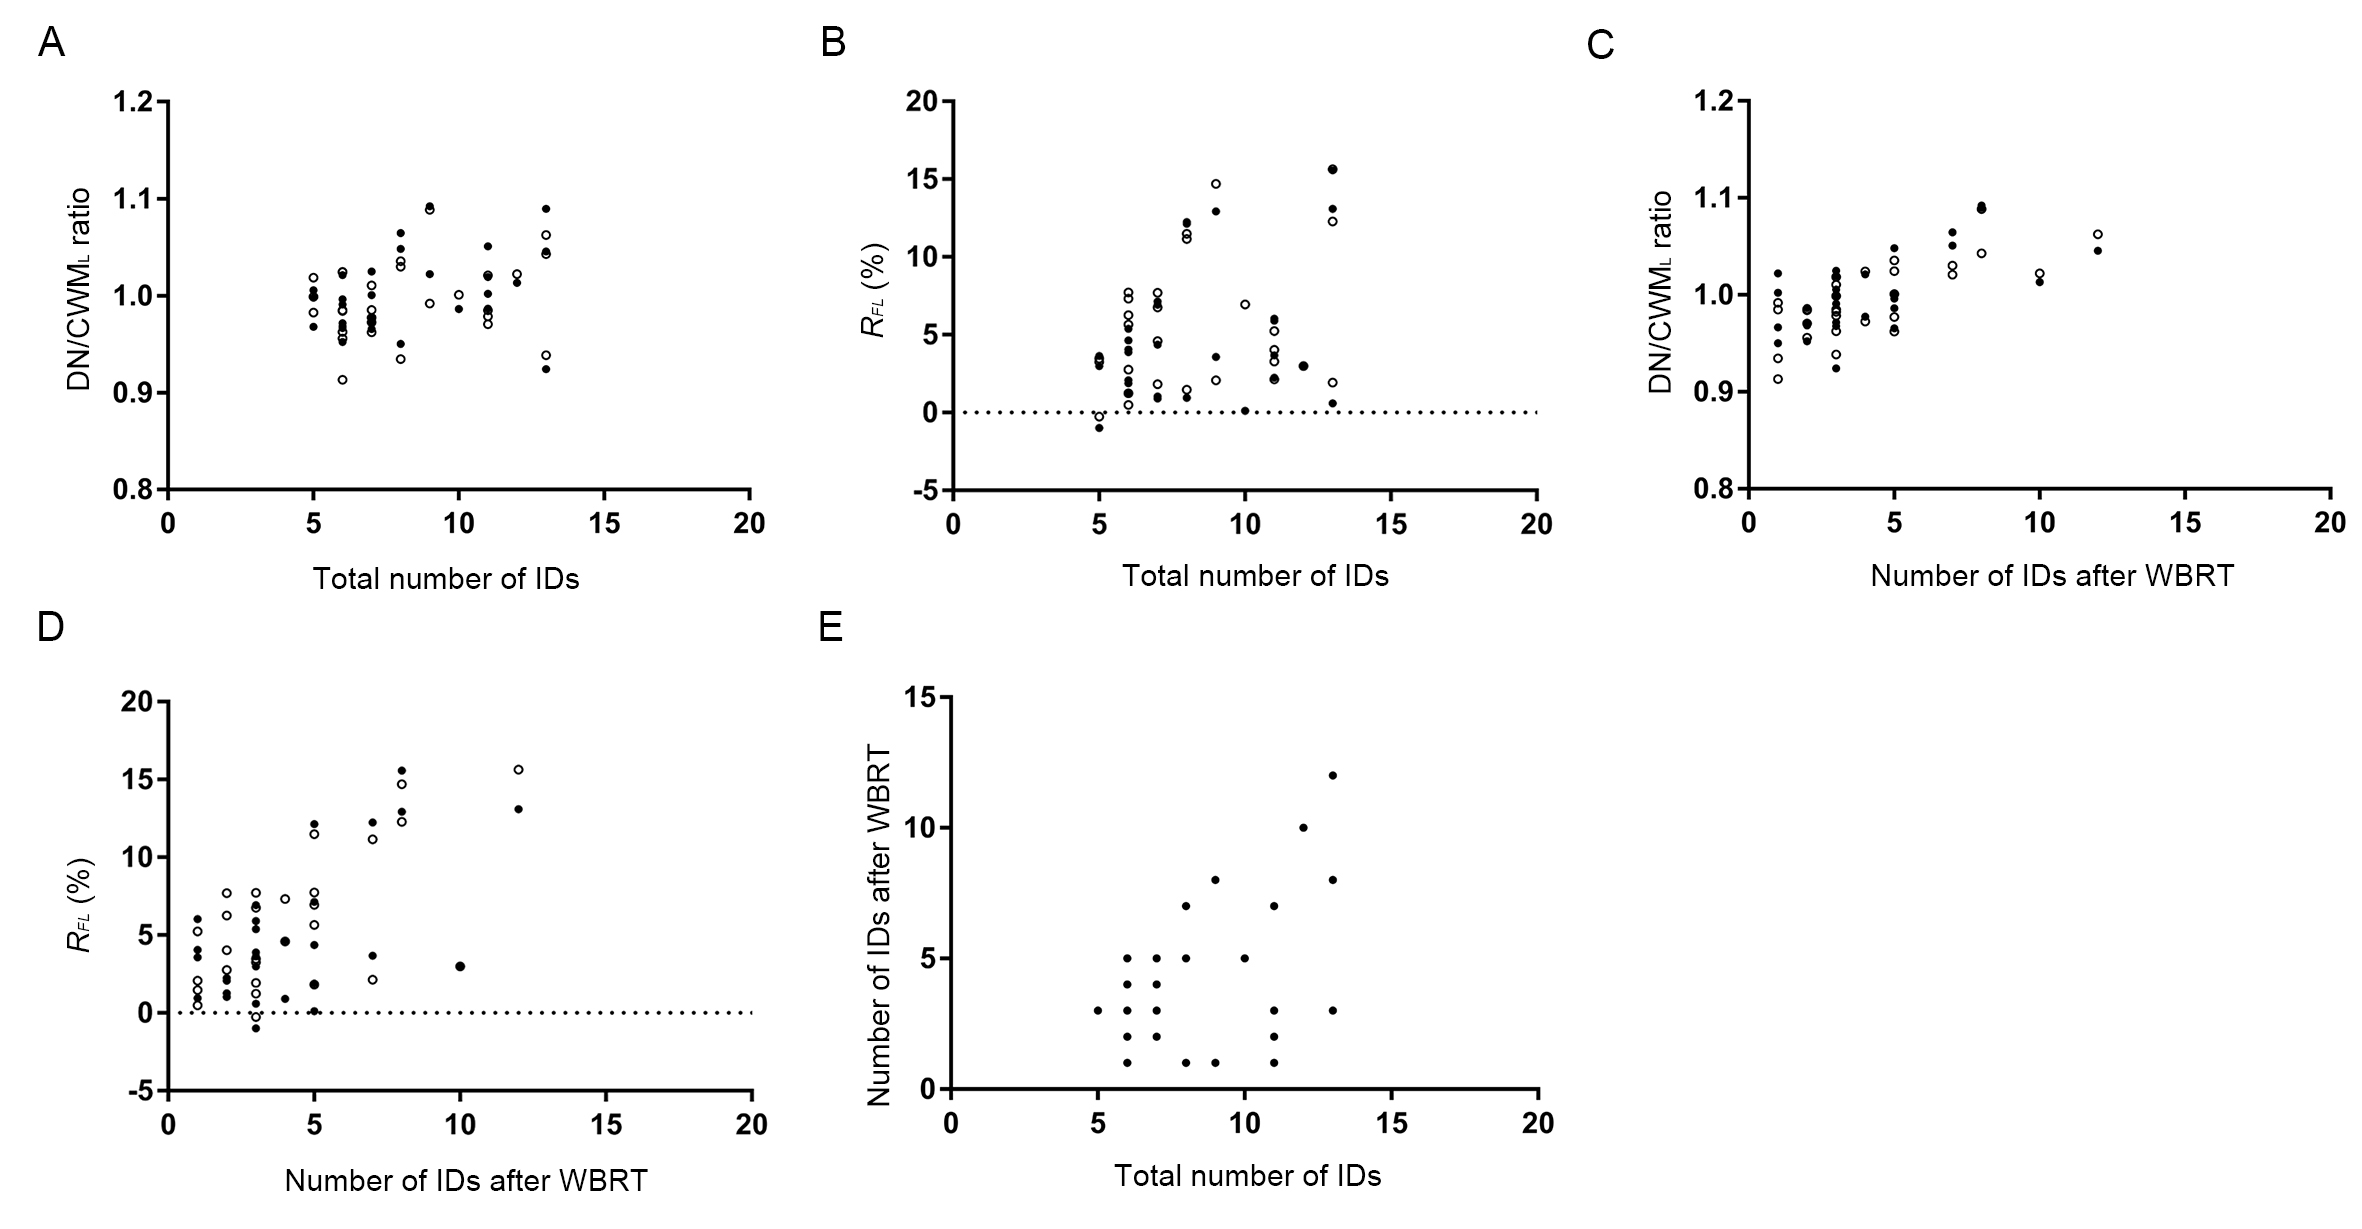
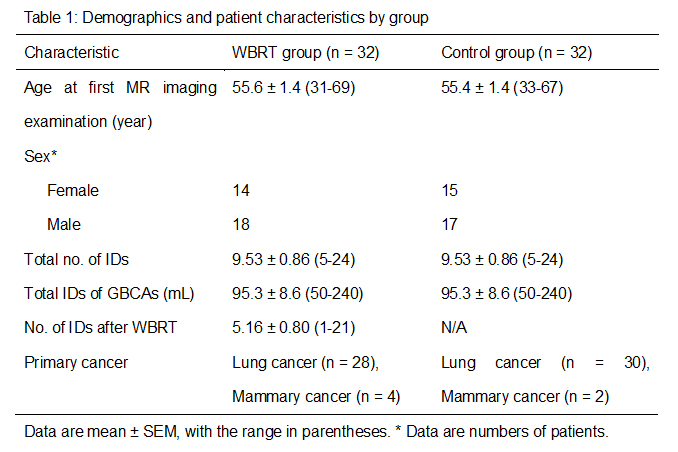
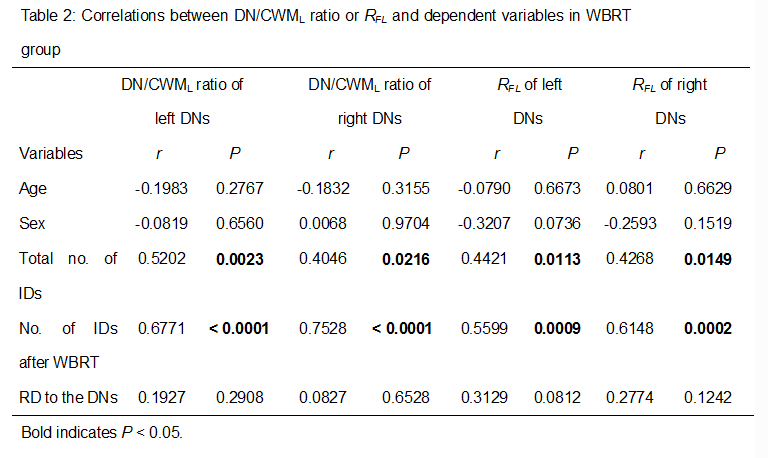
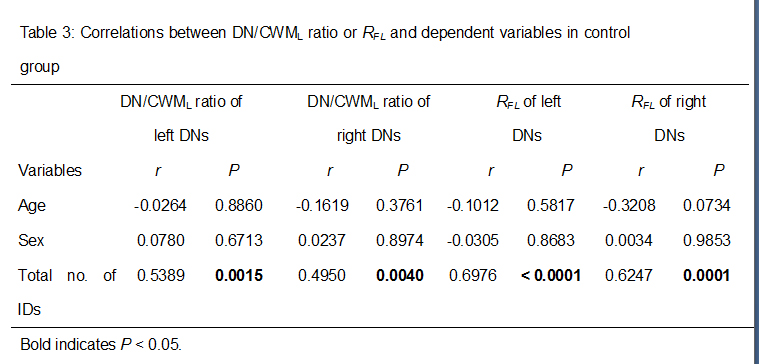
Results WBRT plan maps for patients with BM were shown in Figure 1. WBRT could cause Gd enhancement promotion within DNs as shown in Figure 2. Comparisons of DN/CWML ratio and R between WBRT patients and control patients were shown in Figure 3. Correlations of DN/CWML ratio or R with total number of IDs or number of IDs after WBRT in Group 1 and Group 2 were shown in Figure 4 and Figure 5, respectively. Demographics and patient characteristics by group were shown in Table 1. Correlations between DN/CWML ratio or RFL dependent variables in WBRT group and control group were shown in Table 2 and Table 3, respectively.
Discussion and Conclusion The progressive increase T1 SI in the DN was found to associate with the cumulative IDs of GBCAs by many groups (4, 9, 10, 15). Our results showed that T1 SI in the DN from control patients associated with the total number of IDs, consistent with findings in other studies (2, 4, 6, 10). However, T1 SI in the DN from irradiated patients did not always correlate with cumulative doses of GBCAs, as shown in the results from Group 2. In practical terms, when a patient is diagnosed as lung cancer or mammary cancer, head CEMEs are usually performed to observe whether there is BM. Meanwhile, WBRT will start for the patient when the BM is found. Therefore, this uncertainty of irradiation time indicates that more total number of IDs does not mean more number of IDs after WBRT. Because the increase rate of T1 SI improved markedly after irradiation, the T1 SI was more likely to be determined by the number of IDs after WBRT than the total number of IDs. This is different from previous studies that have showed a continued significant relationship between T1 SI in the DN and the total number of IDs in the irradiated patients with nasopharyngeal malignancy or primary brain tumors (14, 16, 17). In these patients, irradiation and head CEME are often started closely, and thus the number of IDs after irradiation nearly equals to the total number of IDs. In order to reduce the potential neurological complications, WBRT can be improved to confine the irradiation field to the cerebrum if the brain metastases occur only in the cerebrum. Besides, more precise radiotherapy method may be used to prevent the irradiation exposure to the DNs.
Acknowledgements
No acknowledgement found.References
1. Zhang Y, Cao Y, Shih GL, Hecht EM, Prince MR. Extent of Signal Hyperintensity on Unenhanced T1-weighted Brain MR Images after More than 35 Administrations of Linear Gadolinium-based Contrast Agents. Radiology. 2017;282(2):516-25.
2. Ramalho J, Castillo M, AlObaidy M, et al. High Signal Intensity in Globus Pallidus and Dentate Nucleus on Unenhanced T1-weighted MR Images: Evaluation of Two Linear Gadolinium-based Contrast Agents. Radiology. 2015;276(3):836-44.
3. Kanda T, Ishii K, Kawaguchi H, Kitajima K, Takenaka D. High signal intensity in the dentate nucleus and globus pallidus on unenhanced T1-weighted MR images: relationship with increasing cumulative dose of a gadolinium-based contrast material. Radiology. 2014;270(3):834-41.
4. Roberts DR, Holden KR. Progressive increase of T1 signal intensity in the dentate nucleus and globus pallidus on unenhanced T1-weighted MR images in the pediatric brain exposed to multiple doses of gadolinium contrast. Brain & development. 2016;38(3):331-6.
5. Kanda T, Fukusato T, Matsuda M, et al. Gadolinium-based Contrast Agent Accumulates in the Brain Even in Subjects without Severe Renal Dysfunction: Evaluation of Autopsy Brain Specimens with Inductively Coupled Plasma Mass Spectroscopy. Radiology. 2015;276(1):228-32.
6. McDonald RJ, McDonald JS, Kallmes DF, et al. Intracranial Gadolinium Deposition after Contrast-enhanced MR Imaging. Radiology. 2015;275(3):772-82.
7. McDonald RJ, McDonald JS, Kallmes DF, et al. Gadolinium Deposition in Human Brain Tissues after Contrast-enhanced MR Imaging in Adult Patients without Intracranial Abnormalities. Radiology. 2017;285(2):546-54.
8. Behzadi AH, Farooq Z, Zhao Y, Shih G, Prince MR. Dentate Nucleus Signal Intensity Decrease on T1-weighted MR Images after Switching from Gadopentetate Dimeglumine to Gadobutrol. Radiology. 2018;287(3):816-23.
9. Flood TF, Stence NV, Maloney J, Mirsky DM. Pediatric Brain: Repeated Exposure to Linear Gadolinium-based Contrast Material Is Associated with Increased Signal Intensity at Unenhanced T1-weighted MR Imaging. Radiology. 2017;282(1):222-8.
10. Kanda T, Osawa M, Oba H, et al. High Signal Intensity in Dentate Nucleus on Unenhanced T1-weighted MR Images: Association with Linear versus Macrocyclic Gadolinium Chelate Administration. Radiology. 2015;275(3):803-9.
11. Steen RG, Spence D, Wu S, Xiong X, Kun LE, Merchant TE. Effect of therapeutic ionizing radiation on the human brain. Annals of neurology. 2001;50(6):787-95.
12. Fauquette W, Amourette C, Dehouck MP, Diserbo M. Radiation-induced blood-brain barrier damages: an in vitro study. Brain research. 2012;1433:114-26.
13. Hyeon LW, Hong CS, Roh-Eul Y, et al. Does radiation therapy increase gadolinium accumulation in the brain?: Quantitative analysis of T1 shortening using R1 relaxometry in glioblastoma multiforme patients. Plos One. 2018;13(2):e0192838.
14. Tang R, Haacke EM, Zhang Y, et al. Impact of nasopharyngeal irradiation and gadolinium administration on changes in T1 signal intensity of the dentate nucleus in nasopharyngeal malignancy patients without intracranial abnormalities. Journal of magnetic resonance imaging : JMRI. 2019.
15. Errante Y, Cirimele V, Mallio CA, Di Lazzaro V, Zobel BB, Quattrocchi CC. Progressive increase of T1 signal intensity of the dentate nucleus on unenhanced magnetic resonance images is associated with cumulative doses of intravenously administered gadodiamide in patients with normal renal function, suggesting dechelation. Investigative radiology. 2014;49(10):685-90.
16. Tamrazi B, Liu CJ, Cen SY, Nelson MB, Dhall G, Nelson MD. Brain Irradiation and Gadobutrol Administration in Pediatric Patients with Brain Tumors: Effect on MRI Brain Signal Intensity. Radiology. 2018;289(1):188-94.
17. Tamrazi B, Nguyen B, Liu CJ, et al. Changes in Signal Intensity of the Dentate Nucleus and Globus Pallidus in Pediatric Patients: Impact of Brain Irradiation and Presence of Primary Brain Tumors Independent of Linear Gadolinium-based Contrast Agent Administration. Radiology. 2017:171850.
Figures