3175
Effect of RF Pulse Duration on Chemical Shift Encoded MRI1Radiology, University of Wisconsin - Madison, Madison, WI, United States, 2Electrical and Computer Engineering, University of Wisconsin - Madison, Madison, WI, United States, 3Medical Physics, University of Wisconsin - Madison, Madison, WI, United States, 4Biomedical Engineering, University of Wisconsin - Madison, Madison, WI, United States, 5Medicine, University of Wisconsin - Madison, Madison, WI, United States, 6Emergency Medicine, University of Wisconsin - Madison, Madison, WI, United States
Synopsis
The effects of RF pulse duration on chemical shift encoded MRI (CSE-MRI) methods is a previously unexplored potential confounder for accurate and precise estimation of proton density fat fraction (PDFF) and R2*. Most signal models of CSE-MRI model RF excitation as instantaneous rotation of bulk magnetization; however, instantaneous excitation is not physically realizable. In this work we use Bloch equation simulations to characterize the effect of pulse duration on PDFF and R2* bias. We found that R2* bias was more sensitive than PDFF bias to RF pulse duration and note that clinically meaningful bias can be observed.
Introduction
Chemical shift encoded MRI (CSE-MRI) methods are used routinely to quantify tissue proton density fat fraction (PDFF) and R2* in many organs, including the liver, pancreas, thymus, bone marrow, white and brown adipose tissue, skeletal muscle, and heart1. When relevant confounders, such as T1 bias, T2* decay, spectral complexity of fat, eddy currents, and noise bias, have been addressed, CSE-MRI methods have been well validated as accurate and quantitative biomarkers2–8.When deriving the spoiled gradient recalled echo (SGRE) signal model for CSE-MRI methods, RF excitation is generally modeled as instantaneous rotations of bulk magnetization. However, instantaneous RF excitation is not physically realizable and the effects of non-instantaneous RF excitation on the accuracy and precision of PDFF and R2* has not been explored. Therefore, the purpose of this work is to characterize the bias of proton density fat fraction (PDFF) and R2* estimated via CSE-MRI resulting from non-instantaneous RF excitation.
Methods
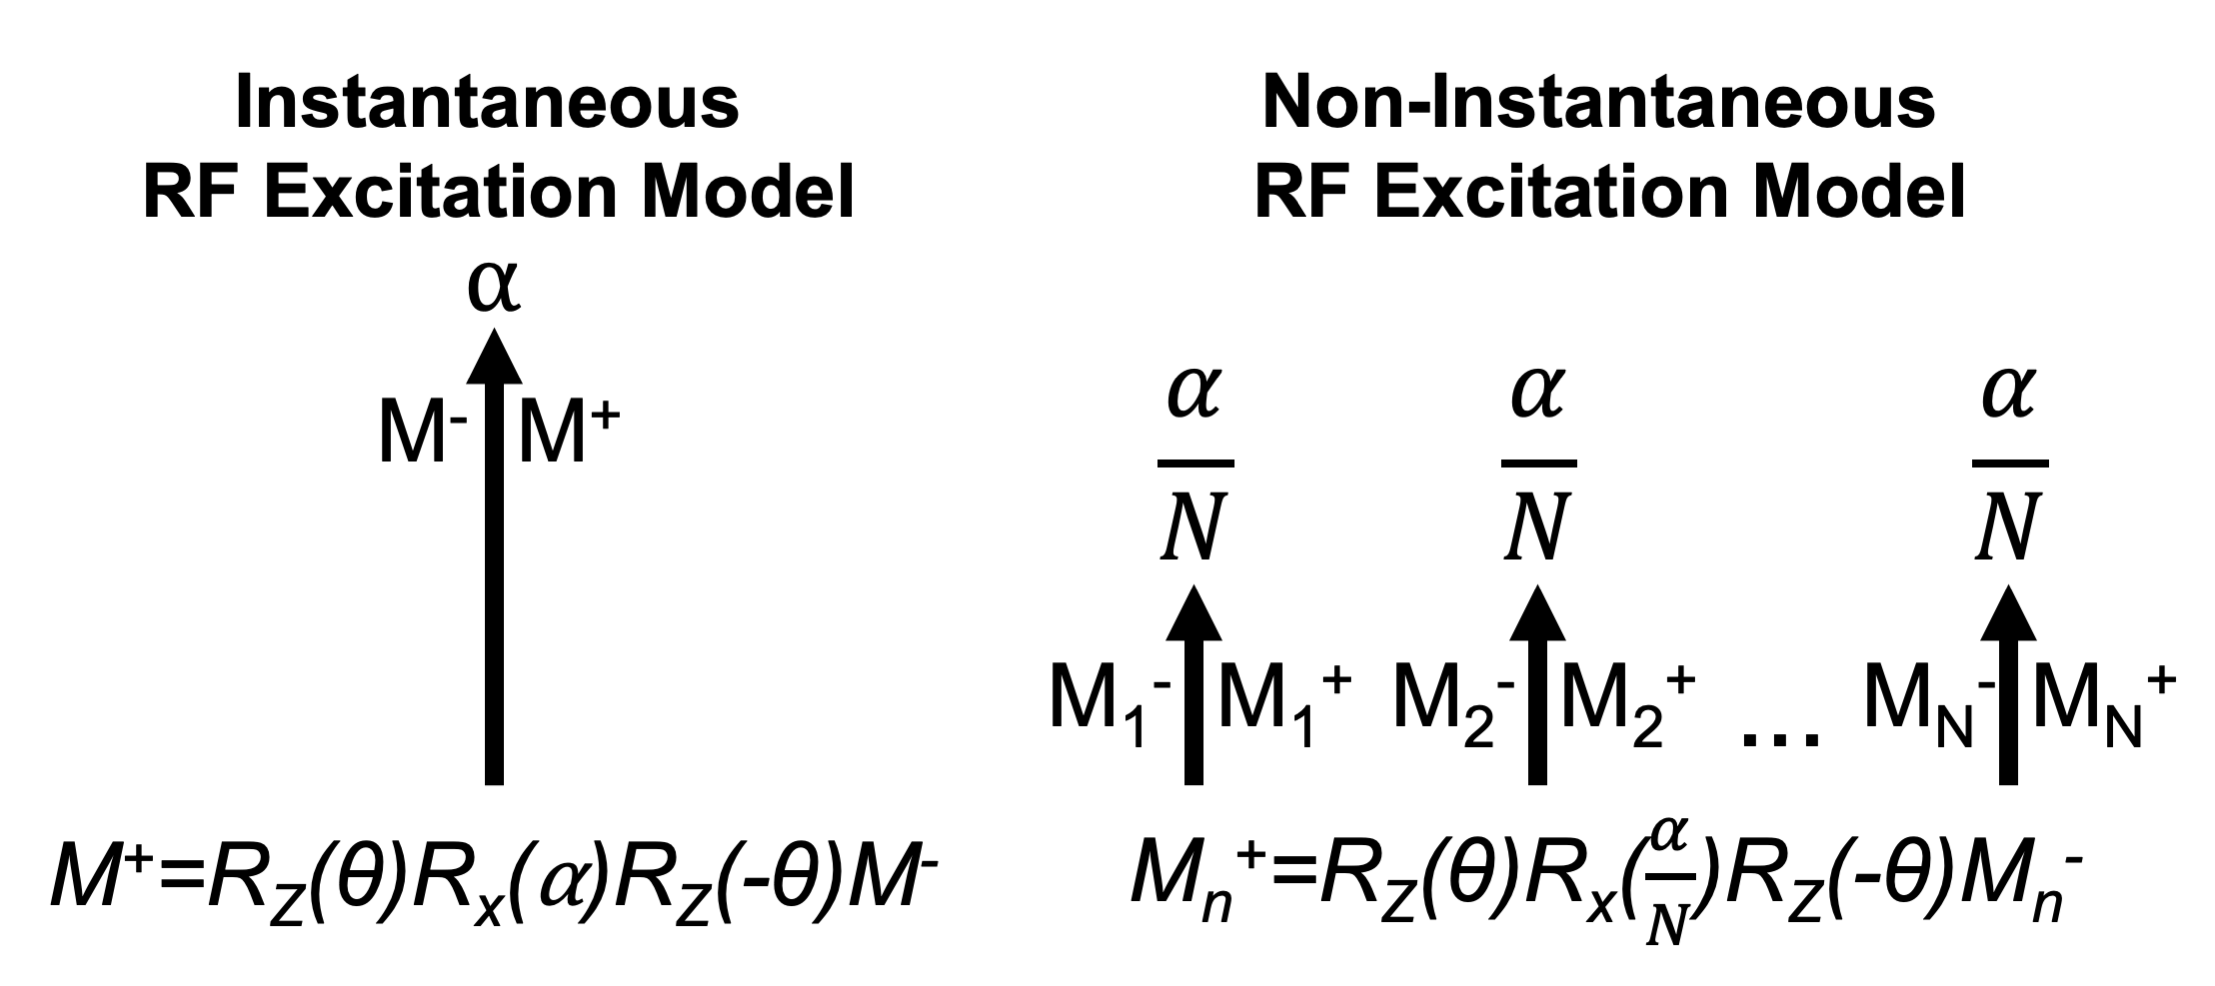
Multi-echo SGRE signals were simulated for 1.5T using the Bloch equations. In place of simulating instantaneous RF excitations of a particular flip angle (⍺=3o) and phase (θ) with a single rotation matrix, RF pulse durations were simulated by dividing the excitation into N instantaneous rotations of flip angle ⍺/N separated by 𝜏 (4μs). During each 𝜏, the magnetization experiences simulated T1 and T2 relaxation, along with precession from B0 fieldmap inhomogeneity and species dependent off-resonance (Figure 1). TRs (12ms) were repeated until steady state was achieved, after which the signals from 6 simulated echoes (TE1=1.2, ΔTE=2ms) were recorded and passed into a noiseless nonlinear least squares optimization with the following CSE-MRI signal model:$$S(TE)=(\rho_W+\rho_F\sum_{p=1}^{6}\alpha_pe^{i2\pi\,f_p\,TE} )\,e^{-R_2^*\,TE}\,e^{i\phi}\,e^{i2\pi\psi\,TE}$$
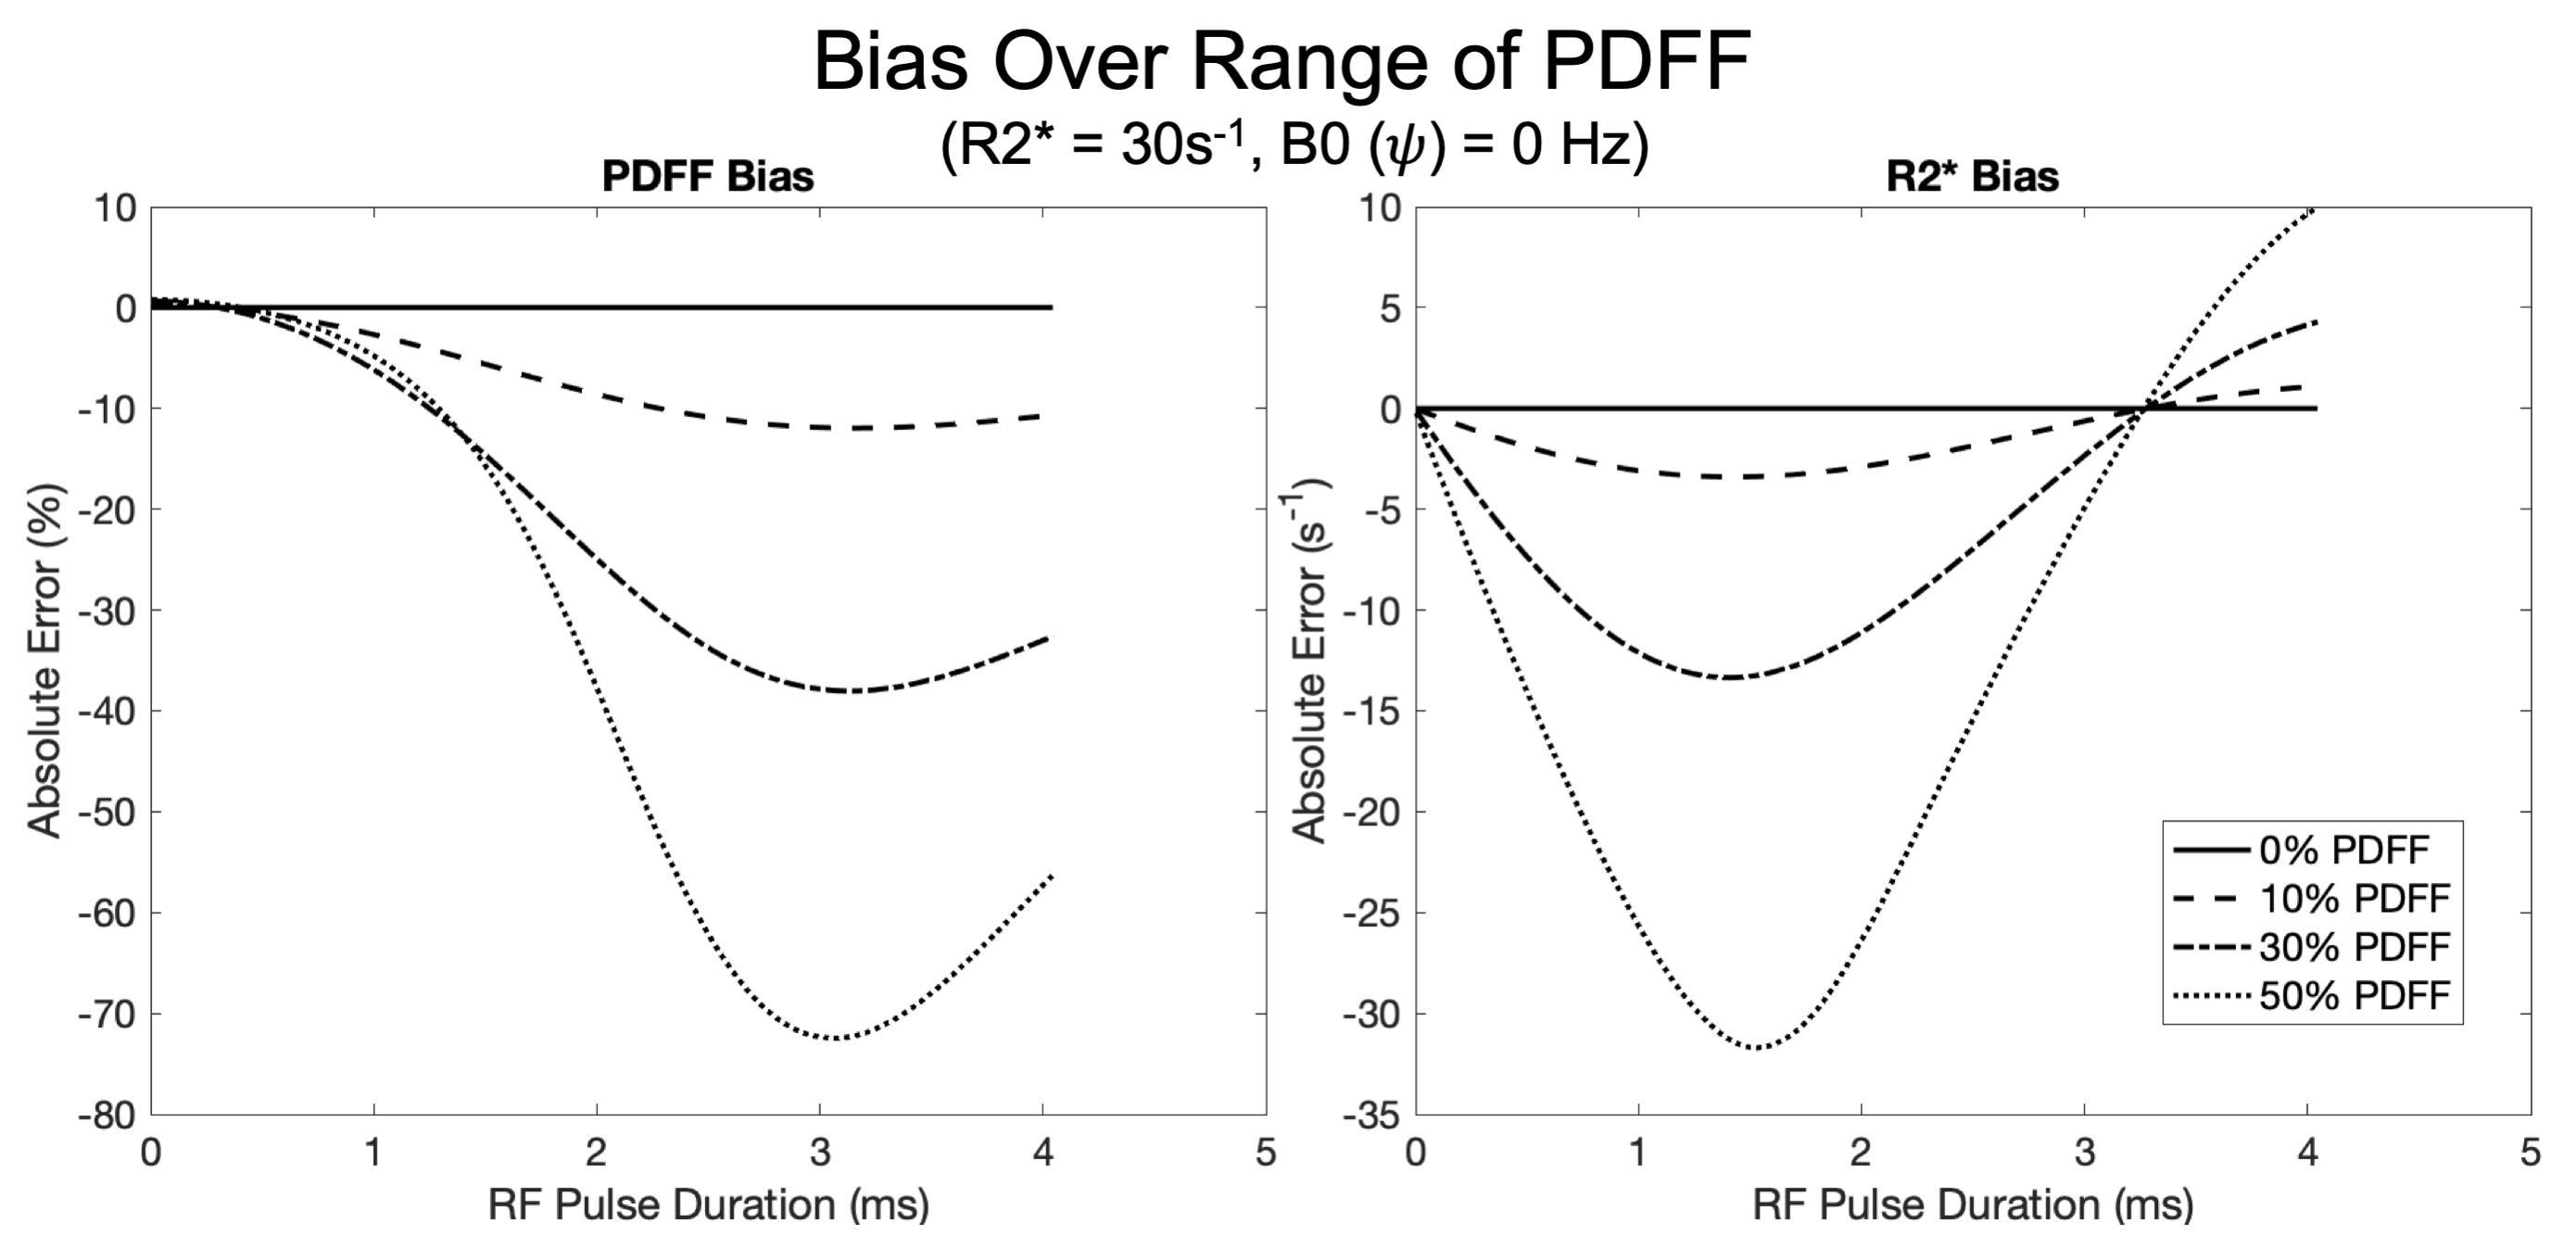
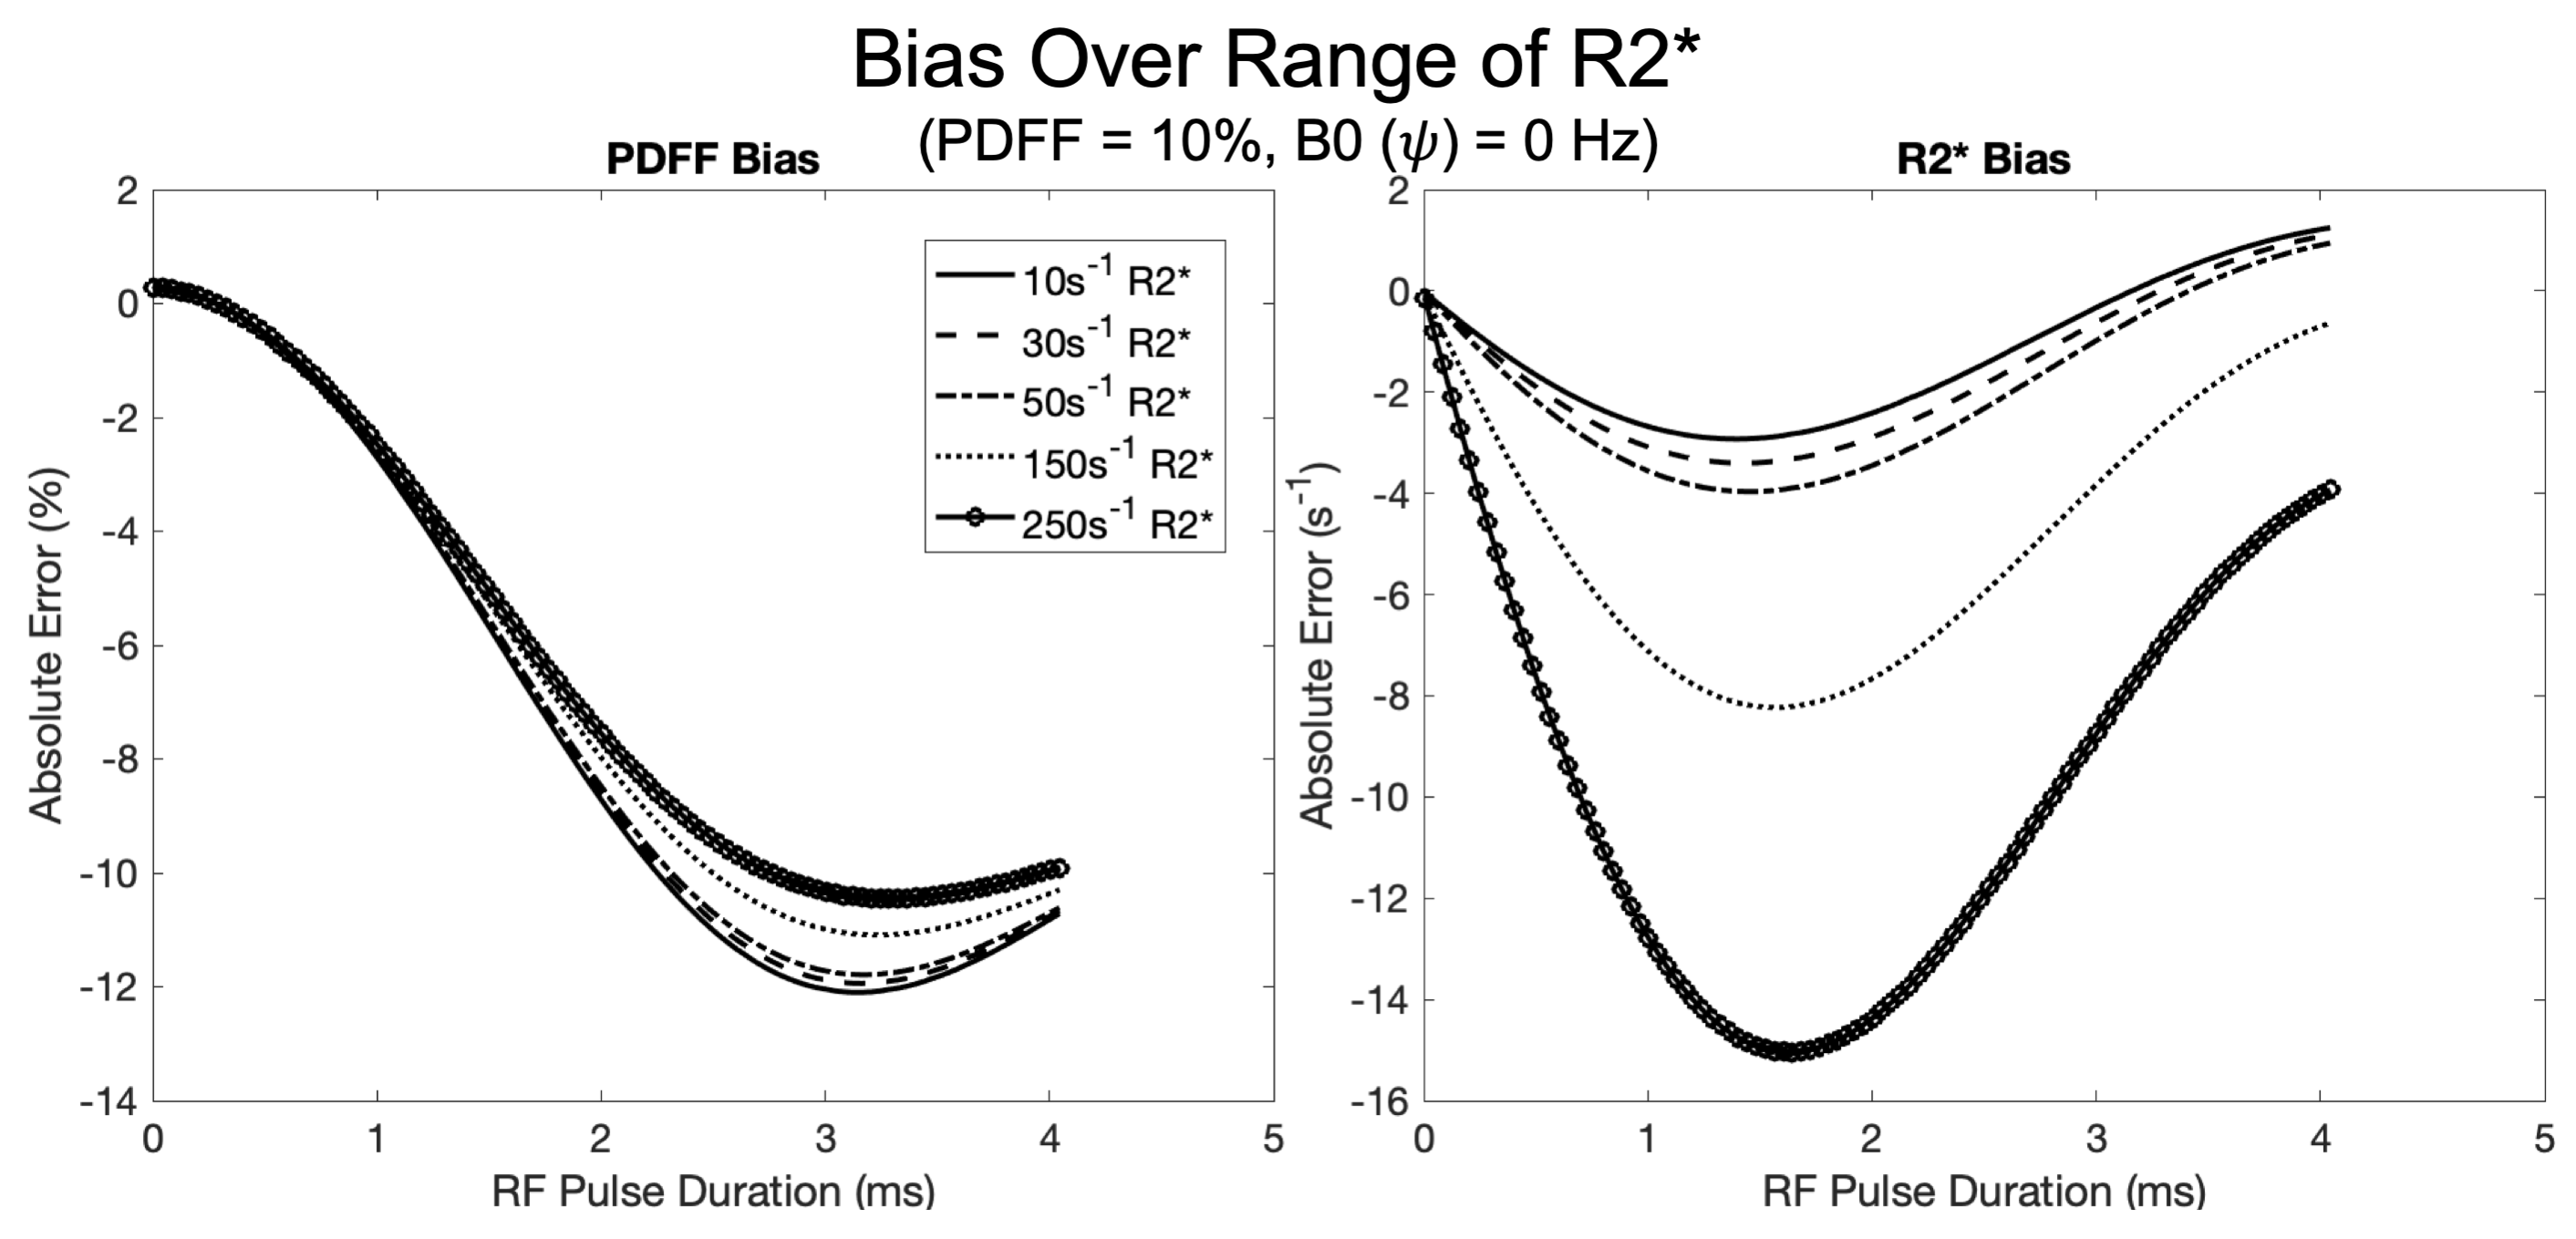
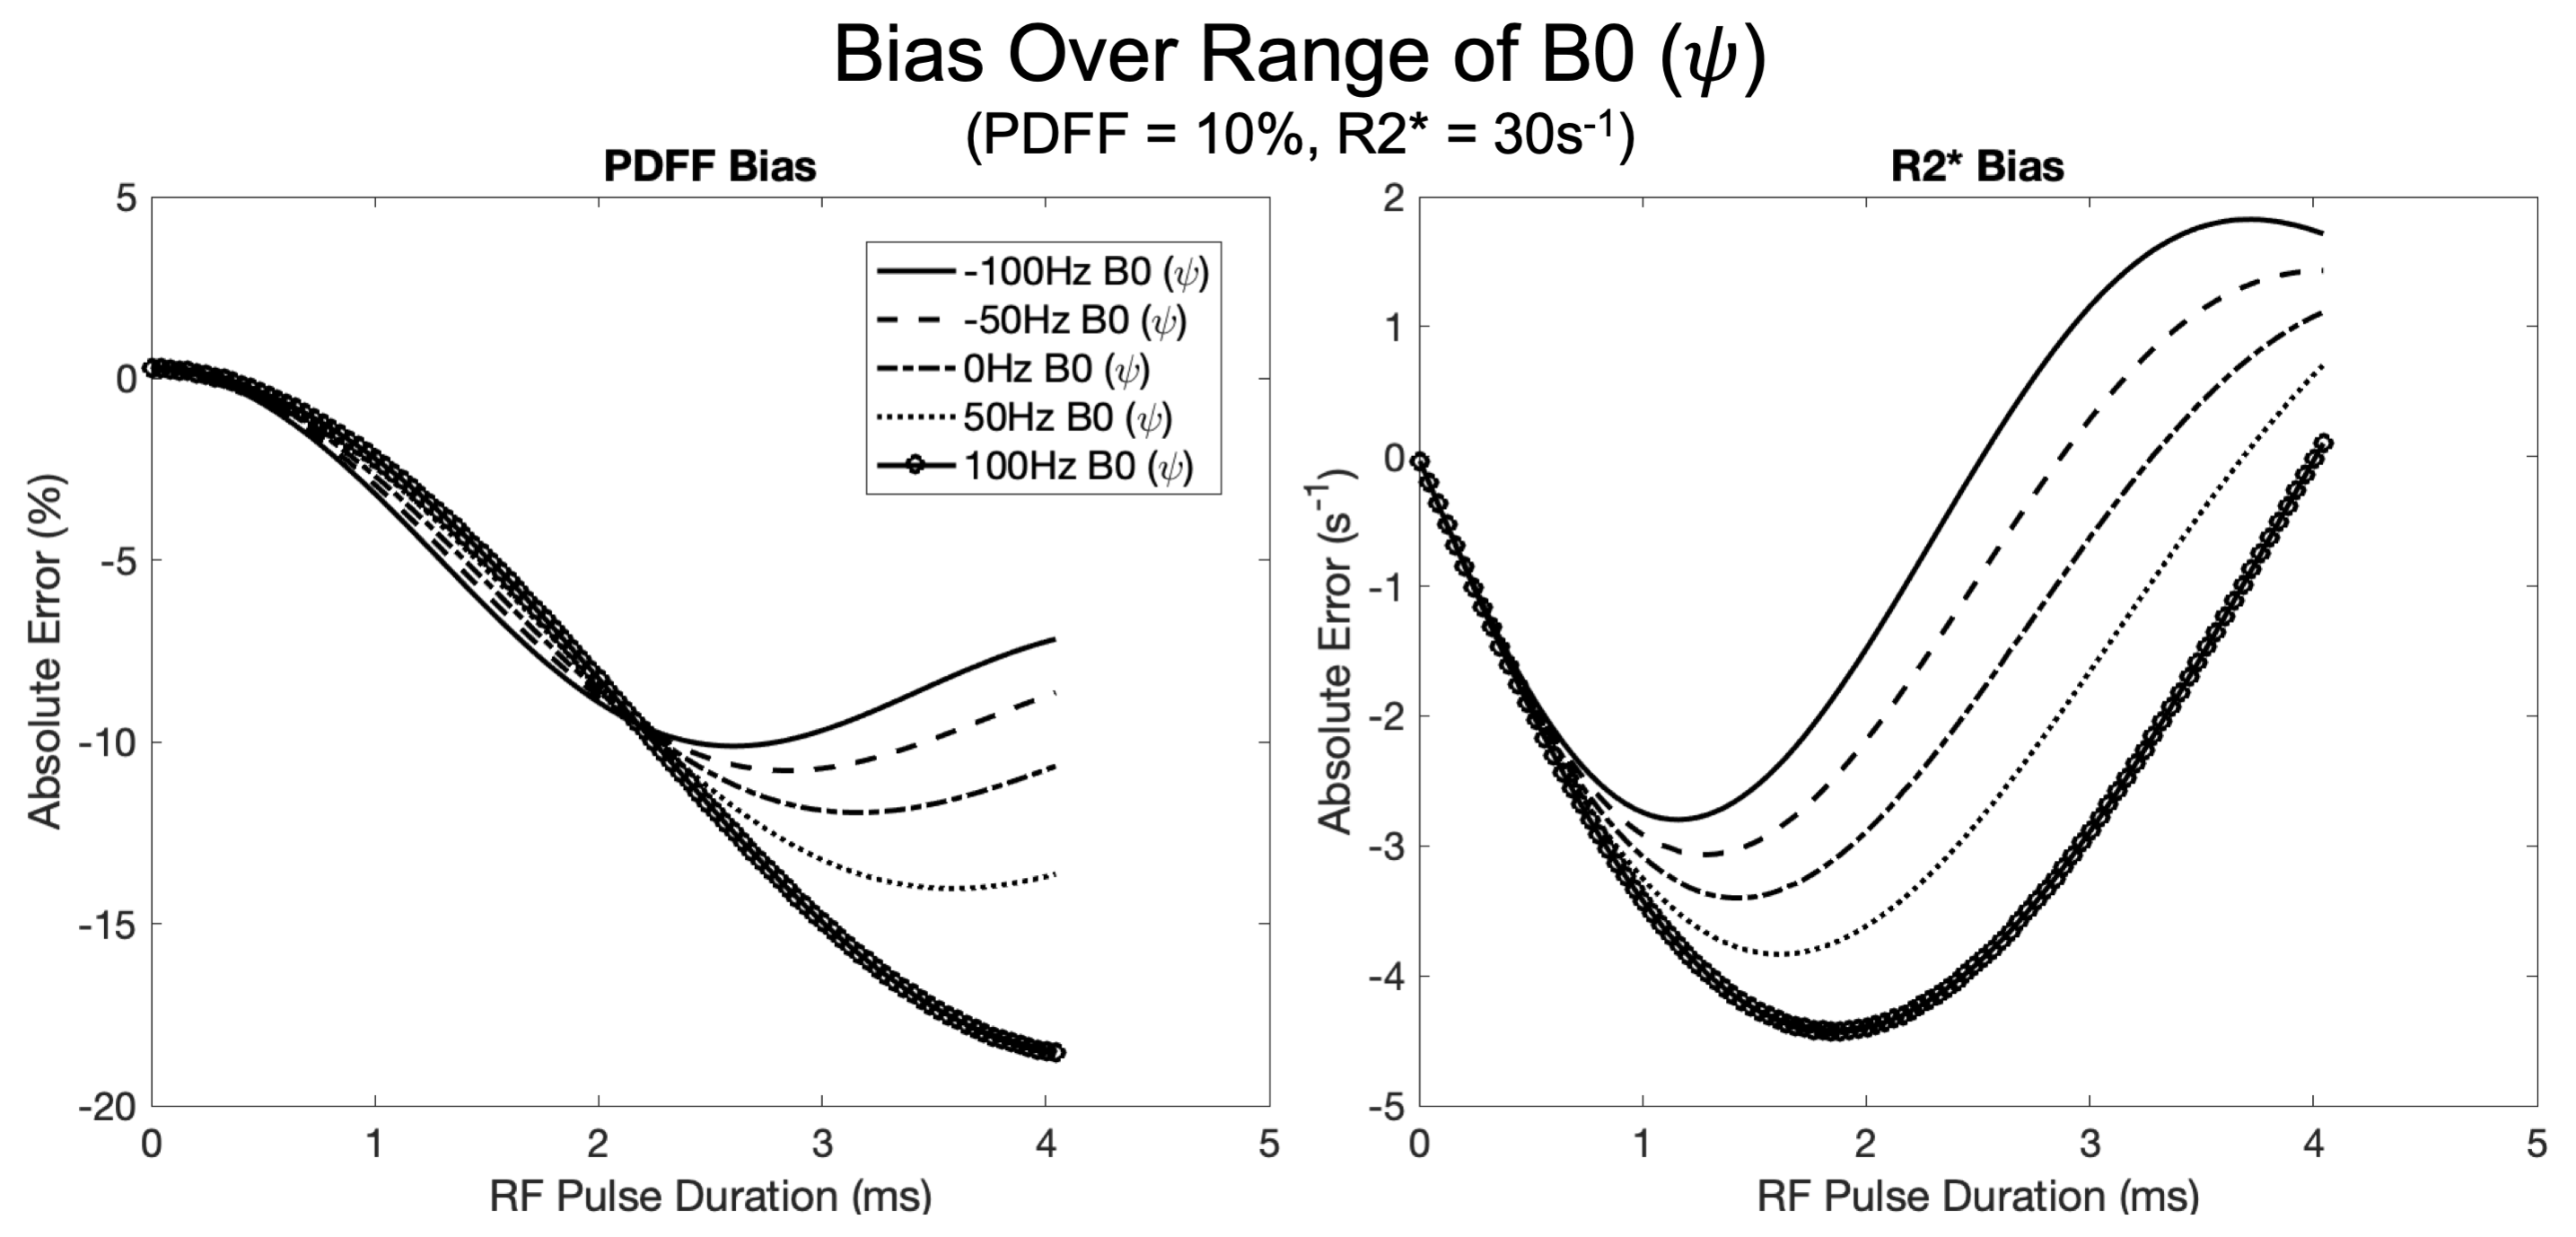
Where 𝜌W , 𝜌F represent the real signals of water and fat, respectively, with $$$\phi$$$ as their shared initial phase (9), $$$\psi$$$ (Hz) represents the B0 fieldmap, and αp and fp represent the amplitude and frequency of the 6-peak spectral model of fat3,10.This simulation and fitting scheme was repeated for combinations of the following parameters: B0 inhomogeneity ($$$\psi$$$) (Hz) [-100,-50,0,50,100], PDFF (%) [0,10,30,50], R2* (s-1) [10,30,50,150, 250] and RF pulse duration ranging from 4μs to 4ms. Non-varied parameters included proton density (𝜌W + 𝜌F) = 100, T1W=576ms, T1F=280ms, and $$$\phi$$$=0. Bias was measured by comparing the estimated PDFF and R2* to their respective simulated true values.
Results
Over the range of simulated parameters, we observed R2* bias to be more sensitive to RF pulse duration with a convex response to increasing RF pulse duration. Conversely, PDFF exhibited an initial concave response to increasing RF pulse duration. Simulation results are plotted over a range of PDFF, R2* and B0 fieldmap and are shown in Figures 2, 3, and 4, respectively.Discussion
In this work we have successfully characterized the bias in PDFF and R2* using non-instantaneous RF excitation for CSE-MRI. Our simulations suggest CSE-MRI estimates of PDFF and R2* may be biased in certain regimes. An important limitation is that our simulations were limited to hard pulses, which may not fully capture the effect of more sophisticated slab selective RF pulses and will alter the effective TE. Future work will explore this effect in a variety of RF pulses and transition this presented theory to experiments in both phantoms and in vivo.Acknowledgements
We wish to acknowledge support from the NIH (R01 DK088925, K24 DK102595, UL1TR002373), UW Institute for Clinical and Translational Research, and the Clinical and Translational Science Award of the NCATS/NIH. Further, we wish to acknowledge GE Healthcare who provides research support to the University of Wisconsin. Finally, Dr. Reeder is a Romnes Faculty Fellow, and has received an award provided by the University of Wisconsin-Madison Office of the Vice Chancellor for Research and Graduate Education with funding from the Wisconsin Alumni Research Foundation.References
1. Reeder SB, Hu HH, Sirlin CB. Proton density fat-fraction: a standardized MR-based biomarker of tissue fat concentration. J Magn Reson Imaging 2012;36:1011–4 doi: 10.1002/jmri.23741.
2. Liu CY, McKenzie CA, Yu H, Brittain JH, Reeder SB. Fat quantification with IDEAL gradient echo imaging: correction of bias from T(1) and noise. Magn Reson Med 2007;58:354–64 doi: 10.1002/mrm.21301.
3. Yu H, Shimakawa A, McKenzie CA, Brodsky E, Brittain JH, Reeder SB. Multiecho water-fat separation and simultaneous R2* estimation with multifrequency fat spectrum modeling. Magn Reson Med 2008;60:1122–34 doi: 10.1002/mrm.21737.
4. Bydder M, Yokoo T, Hamilton G, et al. Relaxation effects in the quantification of fat using gradient echo imaging. Magn Reson Imaging 2008;26:347–59 doi: 10.1016/j.mri.2007.08.012.
5. Hernando D, Hines CD, Yu H, Reeder SB. Addressing phase errors in fat-water imaging using a mixed magnitude/complex fitting method. Magn Reson Med 2012;67:638–44 doi: 10.1002/mrm.23044.
6. Roberts NT, Hernando D, Holmes JH, Wiens CN, Reeder SB. Noise properties of proton density fat fraction estimated using chemical shift-encoded MRI. Magn. Reson. Med. 2018;80:685–695 doi: 10.1002/mrm.27065.
7. Rehm JL, Wolfgram PM, Hernando D, Eickhoff JC, Allen DB, Reeder SB. Proton density fat-fraction is an accurate biomarker of hepatic steatosis in adolescent girls and young women. Eur Radiol 2015;25:2921–30 doi: 10.1007/s00330-015-3724-1.
8. Artz NS, Haufe WM, Hooker CA, et al. Reproducibility of MR-based liver fat quantification across field strength: Same-day comparison between 1.5T and 3T in obese subjects. J Magn Reson Imaging 2015;42:811–7 doi: 10.1002/jmri.24842.
9. Bydder M, Yokoo T, Yu H, Carl M, Reeder SB, Sirlin CB. Constraining the initial phase in water–fat separation. Magn. Reson. Imaging 2011;29:216–221 doi: https://doi.org/10.1016/j.mri.2010.08.011.
10. Hamilton G, Yokoo T, Bydder M, et al. In vivo characterization of the liver fat (1)H MR spectrum. NMR Biomed 2011;24:784–90 doi: 10.1002/nbm.1622.
Figures