3174
R1 reproducibility at 3T and 7T using Bloch-Siegert based corrections for transmit field inhomogeneity1Wellcome Centre for Human Neuroimaging, UCL Institute of Neurology, London, United Kingdom
Synopsis
High reproducibility of longitudinal relaxation rate (R1) estimation using the variable flip angle approach requires unbiased and precise estimation of the transmit field inhomogeneity. In this context, the Bloch-Siegert (BSS)-based B1+ mapping approaches were evaluated at 3T and 7T and compared to the SE/STE approach. R1 values in grey and white matter were slightly higher with the BSS-based techniques. At 3T, the highest reproducibility was observed with the single-echo BSS approach, using an RF spoiling increment of 90°. At 7T, the reproducibility of the techniques were equivalent in well B0-shimmed regions but diverged in regions of high B0 inhomogenity.
Introduction
The longitudinal relaxation rate (R1) is a useful myelin marker for neuroscience research. The Multi-Parameter Mapping (MPM) protocol1 estimates R1 from two multi-echo-spoiled-gradient-echo sequences and a third acquisition mapping the transmit field (B1+). Unbiased and high precision B1+ mapping is essential for reproducible R1 estimates2 and becomes even more important at ultra-high field due to the increased inhomogeneity of the B1+ field. Here we evaluate R1 reproducibility, at 3T and 7T, using recently optimised Bloch-Siegert-shift(BSS)-based B1+ mapping techniques in comparison to a Spin-Echo-Stimulated-Echo (SE/STE) approach commonly used in the MPM protocol.Methods
- 3T Prisma: MPM data were acquired on the same participant on 4 consecutive days using a 32 channel head coil.
- 7T Terra: MPM data were acquired with the 8Tx/32Rx channels Nova head coil on 2 different days on 2 participants. The system was operated in the normal mode for SAR management for the first participant and in the first level mode for the second, allowing higher flip angle for the off-resonance pulse of the BSS technique.
Two FLASH volumes were acquired for each session with different excitation flip angle. At 3T, PD-weighted images from each day were coregistered to an independently acquired R1 map from which grey (GM) and white (WM) matter probabilities were computed. At 7T, data from the second session was coregistered to the first for each participant.
B1+ mapping techniques
BSS B1+ mapping uses an off-resonance RF pulse after the excitation to induce a phase accrual proportional to the square of the B1+ amplitude. Two acquisitions with opposite off-resonance frequency are acquired to isolate the phase of interest. Previous work3 has demonstrated that this “classic” approach is sensitive to the RF spoiling increment such that a 90° increment (ɸinc) should be used to estimate bias-free B1+ maps. Alternatively, it is possible to use a multi-echo approach combined with a General Linear Model (GLM)-based-reconstruction to create bias-free maps regardless of ɸinc. At 3T, 3 protocols were tested:
- SE90: BSS-Single-echo (SE) with ɸinc=90°
- ME90: BSS-Multi-echo (ME) with ɸinc=90°
- ME120: BSS-Multi-echo (ME) with ɸinc=120°
At 7T, only protocols with ɸinc=90° were applied.
Two B1+ maps were reconstructed from the ME acquisitions at 3T, one with the “classic” approach based on the difference between the two echoes acquired immediately after the off-resonance pulses with opposite off-resonance frequencies, the other one based on the GLM parameters as described in 3 . For each session, the SE/STE approach, typical of the MPM protocol and previously been optimized for both 3T4 and 7T5, was also used to map B1+. Since SE/STE uses an EPI readout, a B0 field map was additionally acquired for distortion correction.
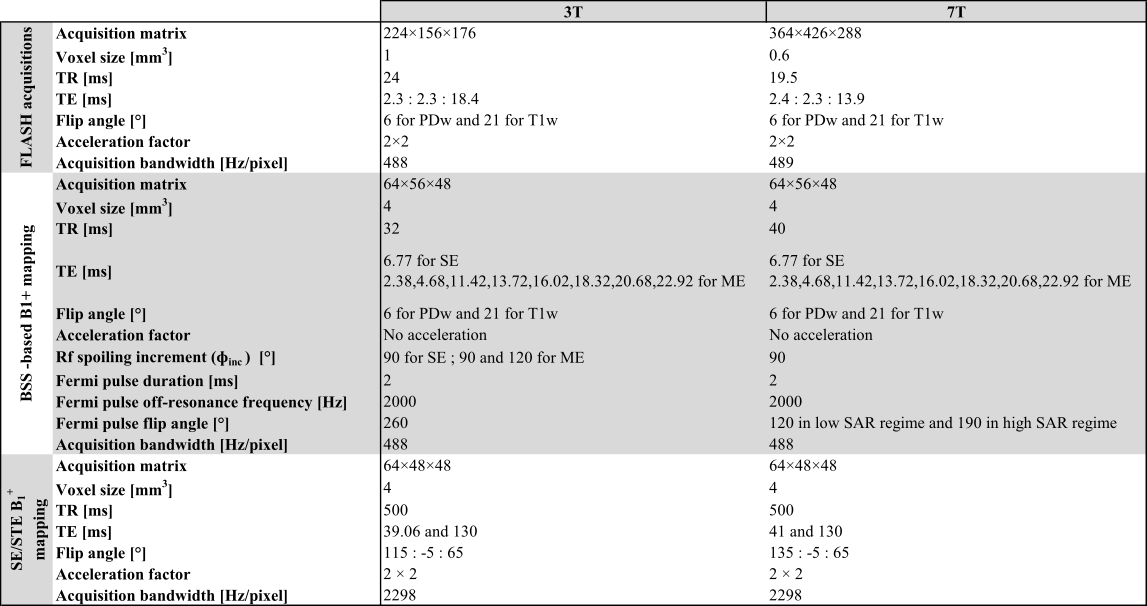
Acquisition parameters are shown in Fig.1.
Image processing:
The hMRI toolbox6 (hMRI.info) was used to compute 6 or 3 R1 maps per session at 3T and 7T respectively, with the same T1 and PD weighted images but different B1+ maps. Correction for imperfect spoiling was applied7. At 3T, the coefficient of variation (CoV) of each technique, across sessions, was computed for each voxel as the ratio of the difference between the maximum and the minimum R1 value over the mean across the 4 sessions. As such it is a very conservative estimate of the reproducibility sensitive to outliers. At 7T, the CoV was computed as the difference between the two sessions over the mean value.
Results
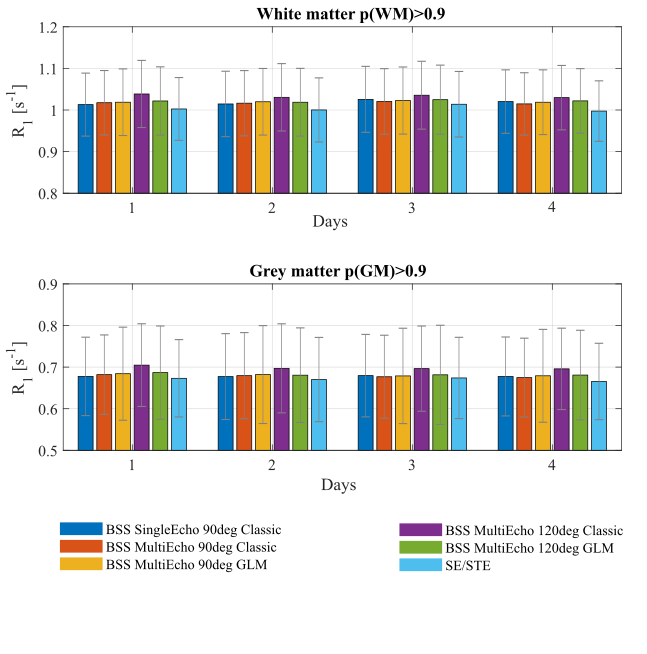
3TThe average R1 estimates in GM and WM were similar across the BSS-based techniques (less than 0.4% difference on average to the SE90Classic approach). The exception was ME120Classic which resulted in higher R1 estimates (1.5% greater (WM) and 3% (GM)). The SE/STE approach resulted in lower estimates than SE90Classic (1.5% smaller (WM) and 1% (GM)) (Fig.2)
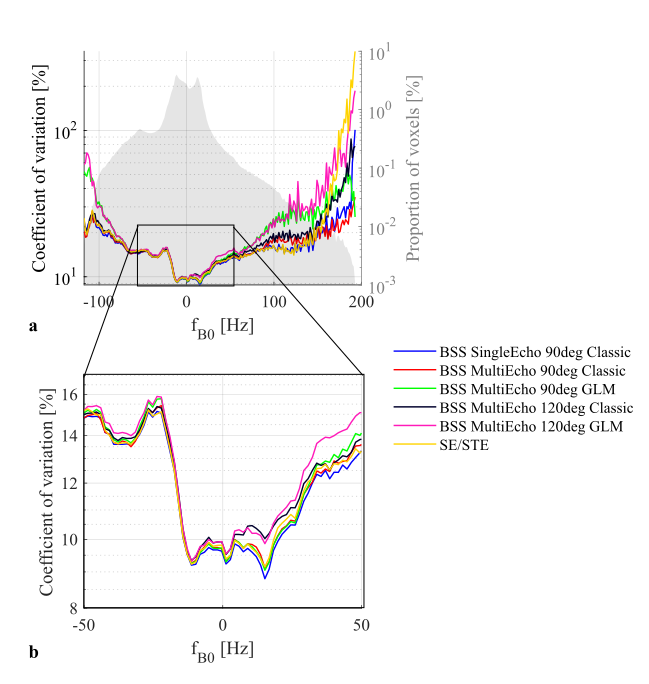
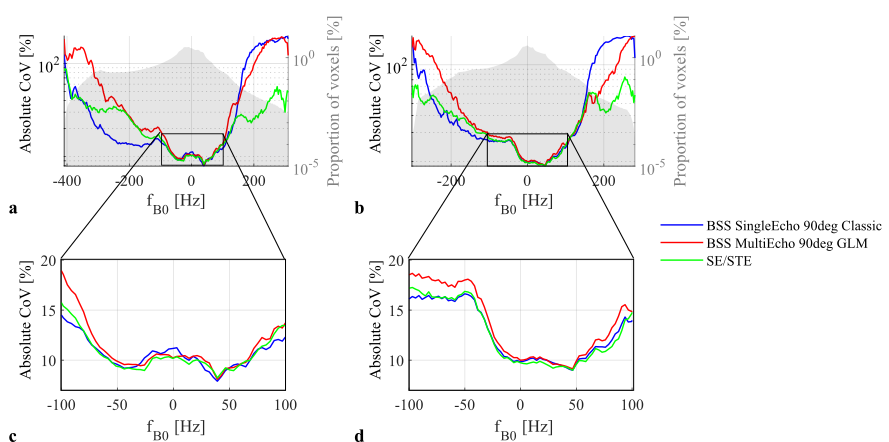
Across the whole brain, the lowest CoV for the R1 estimates was observed with SE90Classic (Fig.3). However, the CoV was highly dependent on the B0 inhomogeneity. In well-shimmed regions, ME120Classic and ME120GLM showed the highest CoV. In regions with high B0 inhomogeneity, GLM-based B1+ maps led to the highest CoV. SE/STE provided marginally higher CoV than SE90Classic in general, with much larger divergence seen only for very high off-resonance.
7T
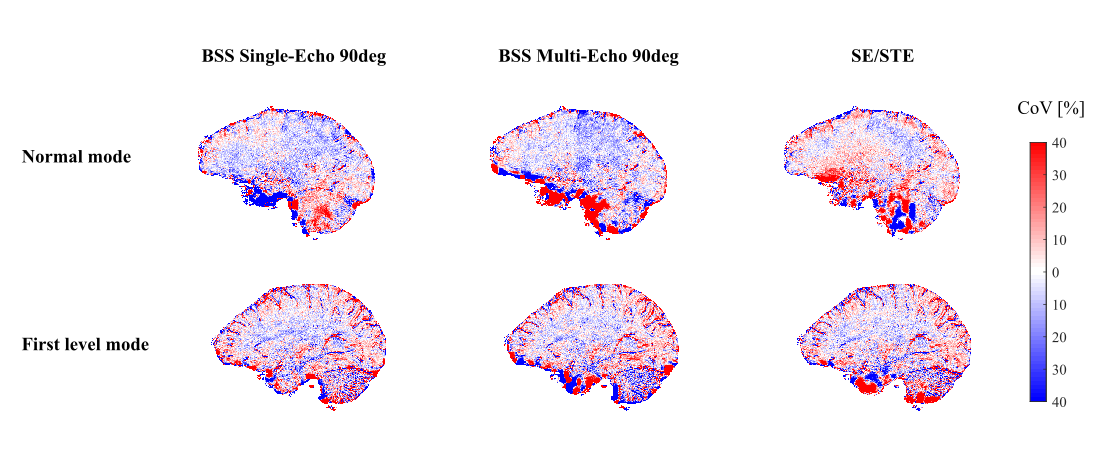
Similar reproducibility was achieved for all approaches in well-shimmed regions but was reduced in areas of high B0 inhomogeneity (Fig.4), especially in orbito-frontal cortex (OFC) and cerebellum (Fig.3). Reproducibility was generally highest for SE90Classic in regions of negative off-resonance frequencies and highest for SE/STE in regions of positive off-resonance frequency.
No substantial difference was observed between normal and first level modes.
Discussion
The BSS-based approaches provided similar R1 estimates except for ME120Classic, likely due to the biased B1+ maps obtained with Φinc≠90° when a GLM-based reconstruction is not used3.Although the GLM approach removed the bias of the 120° case, it did not improve the reproducibility of ME120 and ME90, and even accentuated its sensitivity to B0 inhomogeneity.
SE/STE produced lower R1 estimates and slightly lower reproducibility than the SE-BSS approach at 3T.
At 7T, the B0 sensitivity was more pronounced and the three techniques showed high CoV in off-resonance regions.
SAR is an anticipated limitation of BSS-based techniques at UHF8. However, high SAR regime was not necessary to match the SE/STE reproducibility of SE/STE.
Acknowledgements
The Wellcome Centre for Human Neuroimaging is supported by core funding from the Wellcome [203147/Z/16/Z].References
1. Weiskopf N, Suckling J, Williams G, et al. Quantitative multi-parameter mapping of R1, PD*, MT, and R2* at 3T: a multi-center validation. Front Neurosci 2013;7 doi: 10.3389/fnins.2013.00095.
2. Lee Y, Callaghan MF, Nagy Z. Analysis of the Precision of Variable Flip Angle T1 Mapping with Emphasis on the Noise Propagated from RF Transmit Field Maps. Front Neurosci 2017;11 doi: 10.3389/fnins.2017.00106.
3. Corbin N, Acosta‐Cabronero J, Malik SJ, Callaghan MF. Robust 3D Bloch-Siegert based mapping using multi-echo general linear modeling. Magnetic Resonance in Medicine 2019;82:2003–2015 doi: 10.1002/mrm.27851.
4. Lutti A, Hutton C, Finsterbusch J, Helms G, Weiskopf N. Optimization and Validation of Methods for Mapping of the Radiofrequency Transmit Field at 3T. Magn Reson Med 2010;64:229–238 doi: 10.1002/mrm.22421.
5. Lutti A, Stadler J, Josephs O, et al. Robust and Fast Whole Brain Mapping of the RF Transmit Field B1 at 7T. PLoS One 2012;7 doi: 10.1371/journal.pone.0032379.
6. Tabelow K, Balteau E, Ashburner J, et al. hMRI - A toolbox for quantitative MRI in neuroscience and clinical research. Neuroimage 2019;194:191–210 doi: 10.1016/j.neuroimage.2019.01.029.
7. Preibisch C, Deichmann R. Influence of RF spoiling on the stability and accuracy of T1 mapping based on spoiled FLASH with varying flip angles. Magnetic Resonance in Medicine 2009;61:125–135 doi: 10.1002/mrm.21776.
8. Pohmann R, Scheffler K. A theoretical and experimental comparison of different techniques for B1 mapping at very high fields. NMR in Biomedicine 2013;26:265–275 doi: 10.1002/nbm.2844.
Figures