3173
Reducing parameter estimate bias due to B1 field error ambiguity in CPMG MRI T2 relaxometry1UCL Queen Square Institute of Neurology, London, United Kingdom, 2MRC Centre for Neuromuscular Diseases, London, United Kingdom, 3King's College London, London, United Kingdom
Synopsis
B1 field deviations above and below 100% of the nominal prescribed values have been noted by previous authors as a potential source of error in MRI CPMG T2 relaxometry. We show in simulations of clinically realistic acquisition protocols that this effect causes fit instability and loss of precision, and corroborate this with in vivo lower limb muscle image data. We then introduce a B1 error polarity spatial regularization scheme, and show that this improves parameter estimation accuracy.
Introduction
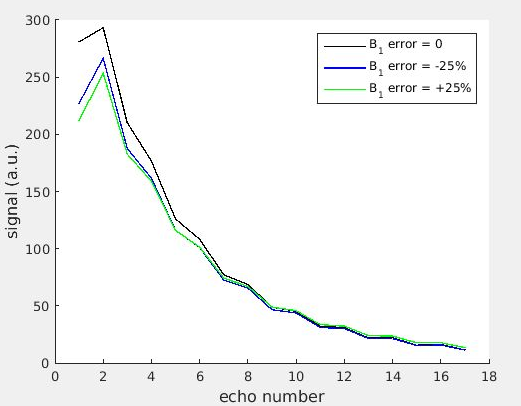
For the purpose of T2 relaxometry, the slice selective CPMG multi-echo signal can be modelled accurately using a slice-profile corrected EPG model. Assuming a single T2 component this model would typically be parametrized in terms of T1, T2, overall amplitude and B1f, which is a percentage scale factor accounting for B1 transmit inhomogeneity, having a value of 100% for a slice profile with 180° refocusing angle at its centre. B1f determines the precise excitation and refocusing flip angles. Early work fitting these models constrained B1f as 0 < B1f<100%1,2; i.e. it was assumed that for example a nominal 170° refocussing pulse produces the same echo train as a 190° pulse. Later work showed that this assumption fails for slice-selective pulses3. This may cause redundancy and hence instability in the parameter estimates, since B1f equally above or below the correct value produces similar but not identical signal models (Figure 1). Since transmit B1 typically varies smoothly and slowly across in vivo images, we expect B1f to do the same. Therefore we hypothesise that locally constraining pixels to have the same polarity of B1f (i.e. either all above, or all below, the prescribed value) will yield more accurate parameter estimates.Aims
Our purpose was to characterise this source of error and test a spatial regularization scheme to reduce parameter estimation bias. To clearly elucidate these effects we first investigated their importance, and the advantage of a spatial regularization approach in single component CPMG signal simulations, and then illustrated an application in real world muscle T2 CPMG imaging data where the presence of fat in diseased tissue necessitates the use of a multi-T2-component model.Methods
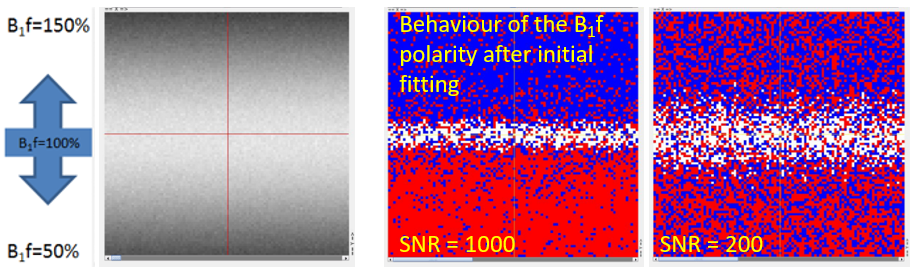
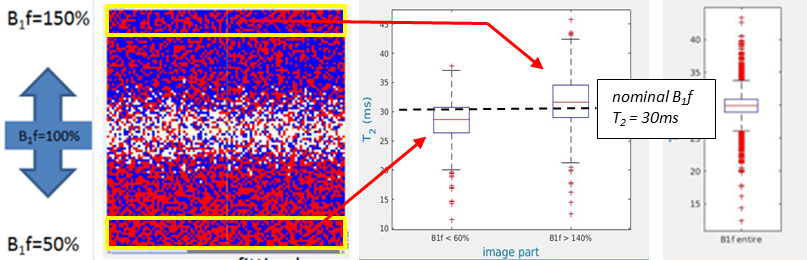
Simulations were performed in MATLAB using a single component sEPG model, with Bloch equation simulated excitation and refocusing profiles using RF pulse shapes from our 3T scanner (Siemens Prisma). Simulated 17 echo sEPG signals with 10ms echo spacing and varying Rician noise levels were used to create synthetic images with varying B1f for a ground truth T2 of 30ms, typical of healthy muscle at 3T; fitting was performed using maximum likelihood estimation (MLE) (Figure 2) explicitly accounting for Rician noise. The MLE method seeks the parameter values yielding a global minimum in the log-likelihood. Due to noise contamination, in practice each pixel may return a log-likelihood surface with, with respect to B1f, a single minimum close to the true value, or due to the near symmetry of the CPMG signal behaviour for B1f values with equal positive or negative deviations from the nominal value, 2 local minima corresponding to these respective conditions. In the later case one of these local minima is identified as the global minimum, but random errors may in fact cause incorrect assignment, producing an error in the parameter estimates (Figure 3).To mitigate this problem B1f spatial regularisation was introduced for those pixels where two local minima with respect to B1f were found. The B1f polarity for a given pixel was fixed to a value corresponding to a majority vote (median filter) of the dominant B1f polarity, calculated over a surrounding 20 pixel diameter disc for the simulations, and a 40 pixel diameter disc for the in vivo datasets. The diameter was determined empirically to avoid either over- or under-smoothing (Figure 4).
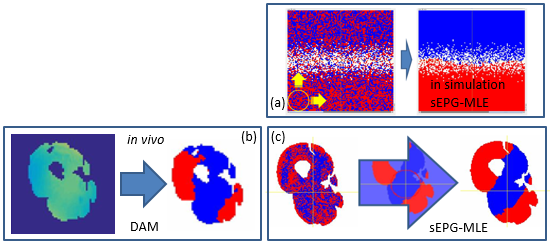
To investigate in vivo applicability the spatially regularized sEPG-MLE method was implemented with an extended multi-component model accounting for muscle-water and intra-muscular fat compartments4, and applied to in vivo human thigh-level CPMG data (22 echoes, other parameters as above) providing muscle water T2 (T2m), apparent fat fraction (ffa), and B1f estimates. For corroboration, maps of estimated B1f where compared with dual angle method (DAM) B1 field maps5.
Results
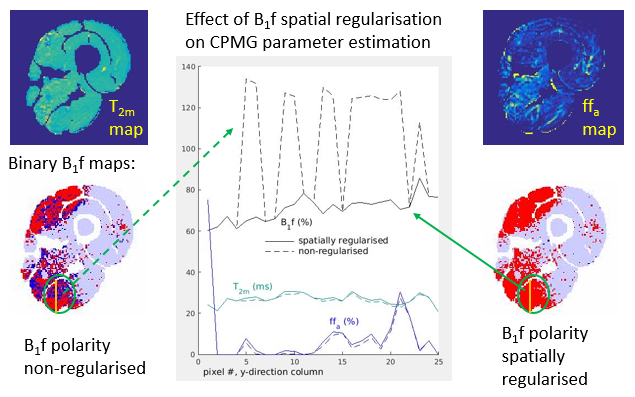
Applying the spatial regularization when fitting the simulated data yielded more accurate T2 estimates (Figure 3) than the preliminary non regularized fit, in fact returning T2 values identical to those obtained for a fit with B1f polarities fixed to the a priori correct values. B1f polarity maps were consistent with B1 maps produced with the established DAM method (Figure 4).On fitting the multi-component fat-water sEPG model to the in vivo data, similar B1f polarity related fit instability was seen, producing biased parameter estimates (Figure 5). Consistent with simulations, the direction of this bias was dependent on the polarity of the B1f error. Applying the B1f polarity spatial regularization scheme to the in vivo data improved the parameter estimation, exemplified by the more physically consistent B1f behaviour seen in the figure.
Conclusion
Addition of a B1f polarity spatial regularisation step to the sEPG-MLE fitting approach resolves the B1f polarity ambiguity issue and increases accuracy of the estimated parameters.Acknowledgements
Supported by:
an EPSRC CASE studentship award with industrial partner GlaxoSmithKline
the MRC Centre for Neuromuscular Diseases
the UCLH NIHR Biomedical Research Centre
References
1. LEBEL, R. M. & WILMAN, A. H. 2010. Transverse relaxometry with stimulated echo compensation. Magn Reson Med, 64, 1005-14.
2. PETROVIC, A., SCHEURER, E. & STOLLBERGER, R. 2015. Closed‐form solution for T2 mapping with non-ideal refocusing of slice selective CPMG sequences. Magn Reson Med, 73, 818-827.
3. MCPHEE, K.C. & WILMAN, A.H. 2017. Transverse relaxation and flip angle mapping: evaluation of simultaneous and independent methods using multiple spin echoes. Magn Reson Med, 77, 2057-2065.
4. ZAFEIROPOULOS, N, 2018. Improved muscle T2 estimation by maximum-likelihood parameter estimation using an extended-phase-graph signal model with locally estimated Rician noise levels. ISMRM 2018 abstract 2763.
5. STOLLBERGER, R. & WACH, P. 1996. Imaging of the active B1 field in vivo. Magn Reson Med, 35, 246-251.
Figures