3171
Simulation of B1+ inhomogeneities errors induced on T1w/T2w contrast at 3T and 7T
Mathilde Ripart1,2, Vincent Gras1, Rachida Elamrani1, Lucie Hertz-Pannier1, and Alexandre Vignaud1
1CEA, Neurospin, Université Paris-Saclay, Gif-sur-Yvette, France, 2Centrale Lyon, Ecully, France
1CEA, Neurospin, Université Paris-Saclay, Gif-sur-Yvette, France, 2Centrale Lyon, Ecully, France
Synopsis
The T1w/T2w ratio is commonly used at 3T as a biomarker of pathological changes in brain's structure. However, this method faces strong B1+ inhomogeneities that induce bias in the contrast. Simulations of this bias at 3T and 7T were done using an EPG model, and reported on the anatomical contours of human brains. At 3T, only a central part of the brain provides acceptable bias in the contrast (≤5%). At 7T, more than half of the brain gives unreliable contrast values. Therefore, T1w/T2w needs to be employed with cautiousness at 3T, and might not be a reliable method at 7T.
Purpose
In 2011, the ratio T1w/T2w was introduced to reveal enhanced myelin contrast in cortical areas 1. Since then, because of its easy clinical acquisition, it has been widely used at 3T to study myelin-related diseases, such as multiple sclerosis (MS), but also to highlight pathological changes resulting from brain diseases such as Schizophrenia. Indeed, at 3T the contrast between white matter (WM) and grey matter (GM) of the T1w/T2w ratio was reported to decrease by 18%, on average, in the case of patients with Schizophrenia compared to age-matched healthy controls 2. However, at higher magnetic fields (B0≥3T), these images are facing strong inhomogeneities of the transmitted field (B1+), which are known to induce bias in the contrast weighting. We present simulations of the T1w/T2w ratio at 3T and 7T, and compute the error that can be induced in the WM-GM contrast, with typical B1+ inhomogeneities observable in the human brain. Then, we discuss implications on its possible use at both these magnetic fields strengths.Methods
Signals from T1w and T2w images have been simulated with an Extended Phase Graph (EPG) model 3 using an MPRAGE sequence and a SPACE sequence respectively, with the corresponding standard MR sequence parameters, described in Figure 1. These signals have been computed with the MR parameters of the WM and GM found in the literature at 3T and 7T 4,5. WM-GM contrasts have been simulated for a range of relative flip angles (FA), going from 0.8 to 1.2 the nominal value at 3T 6 and 0.2 to 1.35 the nominal value at 7T 7 to cover the range of B1+ inhomogeneities present in human brain at these fields. We empirically set a ± 5% contrast error threshold to asset with confidence variations such as those expected in Schizophrenia. On another hand, a real magnetization-prepared turbo-FLASH B1+ mapping sequence 8 was used to map the typical inhomogeneities in human brains at 3T and 7T, to assess its impact on the T1w/T2w-contrast between WM and GM. The results were reported on the anatomical contours obtained with corresponding MPRAGE scans.Results
Figure 2 presents the results of the simulation obtained at 3T (top) and 7T (bottom). The black line represents the WM-GM contrast of the T1w/T2w ratio as a function of the relative B1+ inhomogeneities tested. The hashed area represents the range of inhomogeneities observed in the human brain at each respective field. The green box represents the range of inhomogeneities that induces a contrast bias less than 5%. It can be seen that the range of acceptable inhomogeneities covers ¾ of the entire range at 3T and less than half of the range at 7T. Figure 3 presents the area covered by reliable flip angles at 3T (top) and 7T (bottom) on the contours of anatomical brains. It can be noticed that only central parts of the brains in axial, coronal and sagittal views would provide an accurate contrast.Discussion
These results confirm that B1+ inhomogeneities induce errors in the T1w/T2w contrast that are not negligible. At 3T, a quarter of the inhomogeneities observable in the brain induces more than 5% bias in the contrast. With the increase of the magnetic field, the inhomogeneities observable in the brain at 7T are stronger and only half of this range allows accurate contrast measurement. Translated on anatomical images, these confidence areas only cover a central part of the brain at 3T and an even smaller one at 7T, largely excluding cortical areas. These inhomogeneities can result in errors that can bias the detection of variations in WM-GM contrast. Therefore, this method does not seem sensitive enough to highlight contrast differences between patients and healthy individuals with a 3T or 7T MRI scanner. Plus, at 7T we can be particularly suspicious about high contrast variations occurring in the temporal lobe or any other part of the brain known to suffer from strong B1+ inhomogeneities.Conclusion
These preliminary results imply that the use of the ratio T1w/T2w needs to be employed with cautiousness even at 3T, and might not be a reliable disease biomarker at 7T, with conventional MRI acquisitions. However, the use of parallel transmission (PTx) to reduce the B1+ inhomogeneities at 7T could enable the T1w/T2w ratio to be reconsidered as a good candidate at ultra-high-fields. This direction will constitute the matter of further study at 7T.Acknowledgements
No acknowledgement found.References
1 Glasser MF. et al, Jour. Neuro., 31: 11597–11616 (2011). 2 Ganzetti M. et al, Neuroradiology, 57, p 917–928 (2017). 3 Henning J., Con. Magn. Reson. , 3: 125–143 (1991). 4 Sengupta A.et al , Jour. Trans. Med. ,15 (2017). 5 Singh A. et al, Mag. Res. Med. , 69 (2013). 6 Wright PJ., MAGMA, 21: 121-30 (2008). 7 Cox F., ISMRM 2008, p.1411. 8 Amadon A, ISMRM 2015, p. 2377.Figures
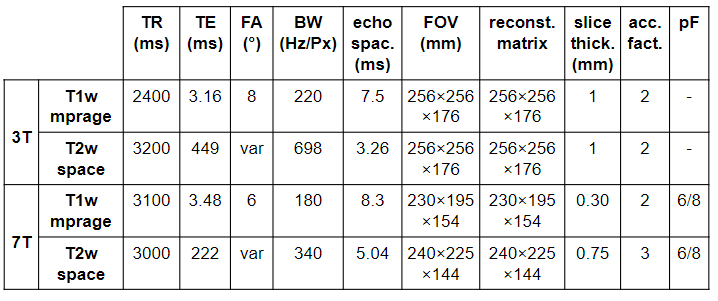
Figure 1: Sequence parameters used to acquired standard T1w and T2w volumes at 3T and 7T
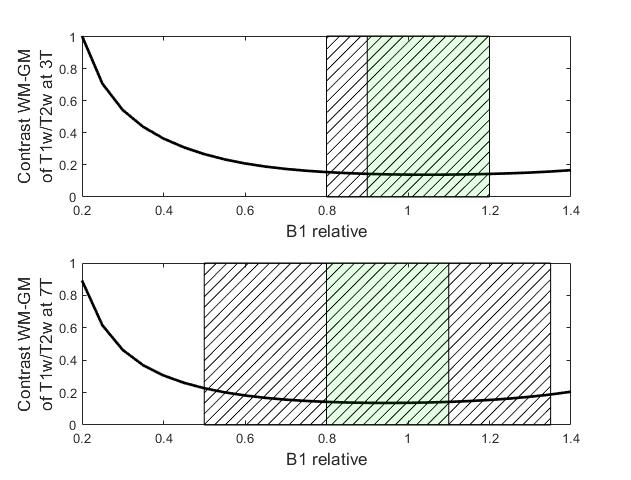
Figure 2: Simulation of the contrast WM-GM of the ratio T1w/T2w for variations of the flip angles going from 0.2 to 1.4 the nominal value. The hatched area corresponds to the range of B1+ inhomogeneities variations in the human brain at 3T and 7T. The green area corresponds to the range of relative flip angles that induce a bias in the contrast less than 5%.
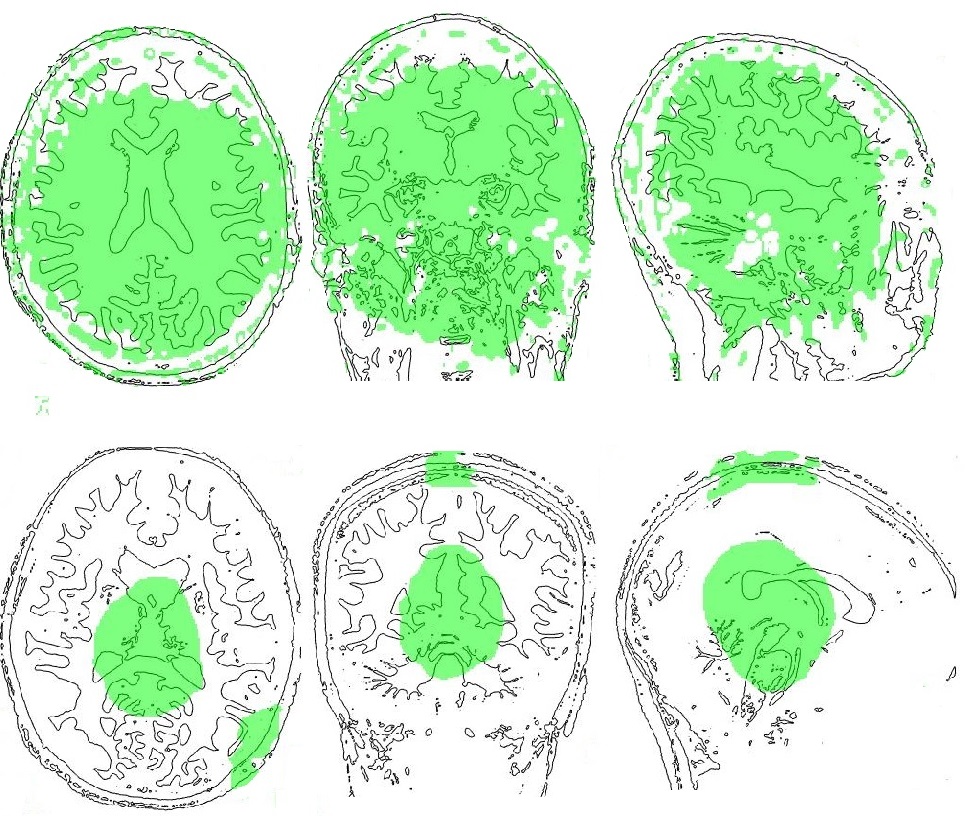
Figure 3: The range of acceptable B1+ inhomogeneities (green zone) translated on anatomical views of brains at 3T (top) and 7T (bottom).