3170
A method to remove the influence of fixative concentration on post-mortem T2 maps using a kinetic-tensor model1Wellcome Centre for Integrative Neuroimaging, Nuffield Department of Clinical Neurosciences, University of Oxford, Oxford, United Kingdom, 2Department of Radiology, University of Chicago, Chicago, IL, United States, 3Nuffield Department of Clinical Neurosciences, University of Oxford, Oxford, United Kingdom, 4School of Medicine and Public Health, University of Wisconsin-Madison, Madison, WI, United States
Synopsis
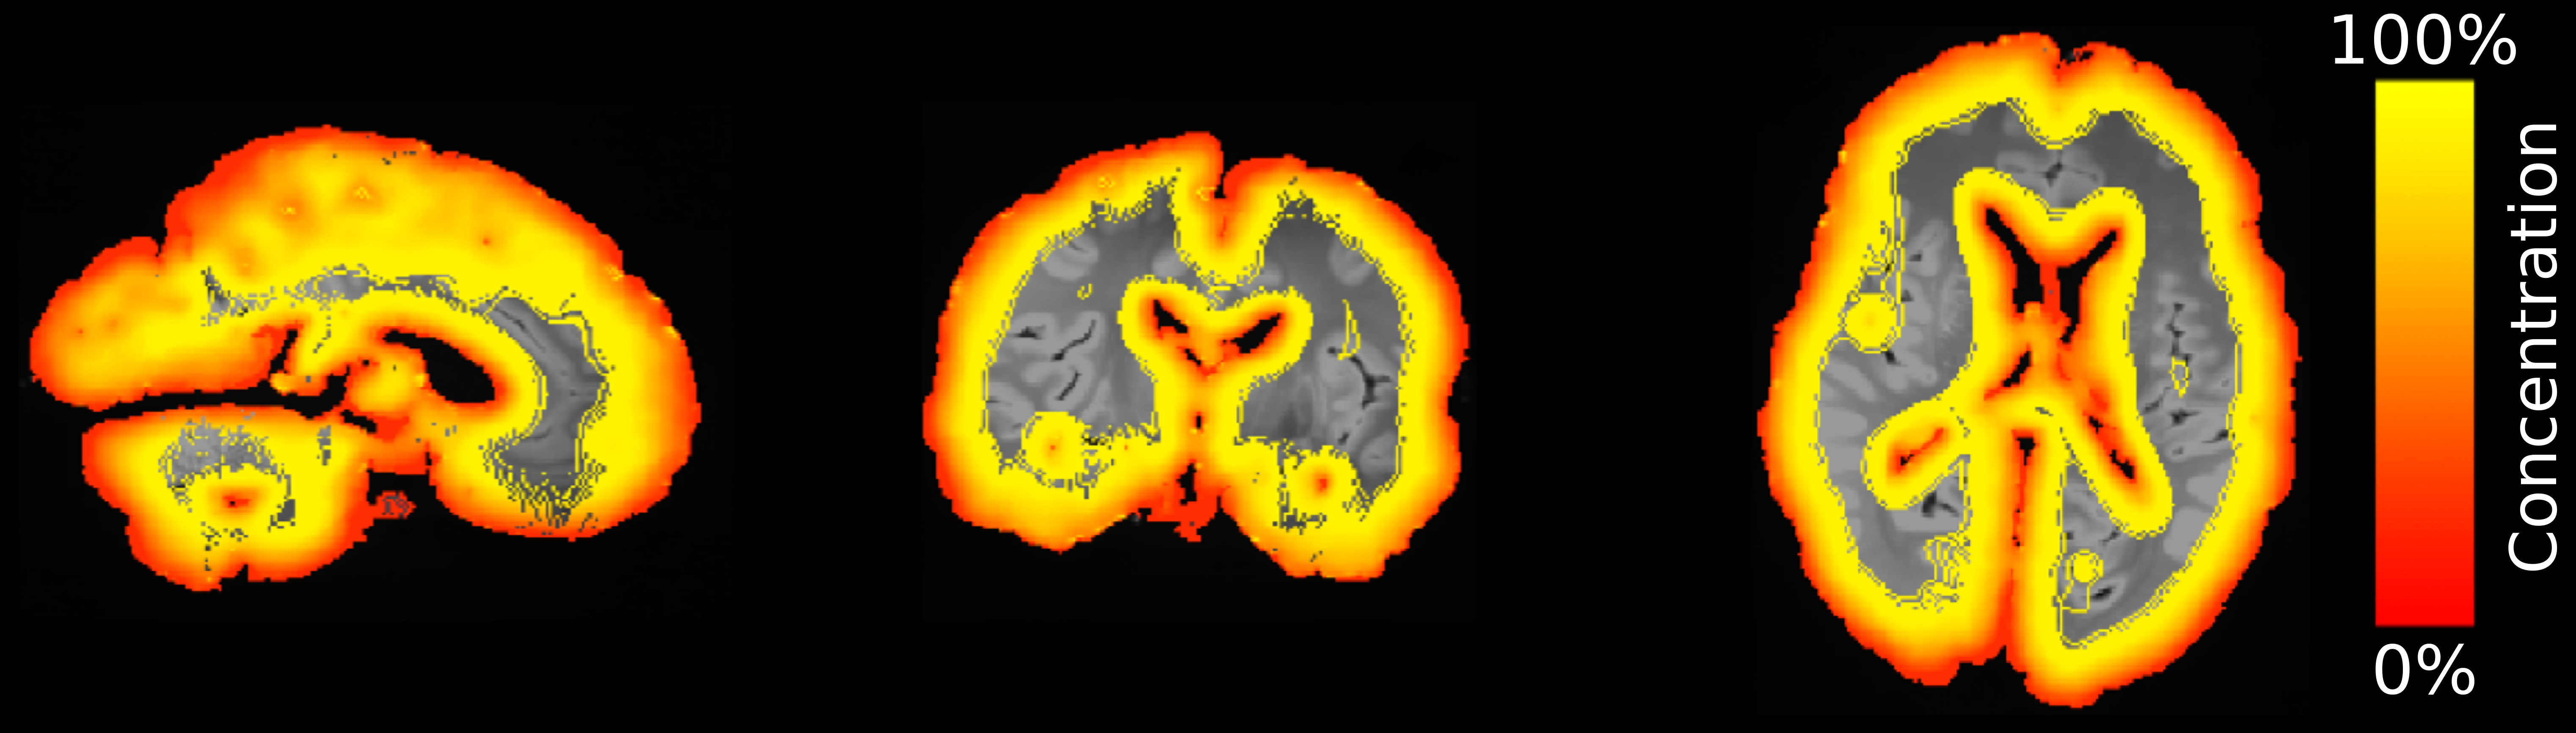
Postmortem imaging allows for validation of the origins of image contrast through comparisons with histology. However, the inclusion of formalin fixative substantially reduces the T2. This reduction is (approximately) linear with concentration. Prior to scanning, samples are often placed in a fluid that has more favourable properties for imaging (e.g. perfluorocarbon fluids). This may lead to an outflow of fixative and an increase in T2 at the tissue surface. Here we propose to correct for T2 inhomogeneity by modelling the outflow of fixative within whole, human brains using a novel kinetic tensor model, which incorporates the effects of diffusion anisotropy.
Introduction
To determine the origins of MR image contrast, it is essential to perform comparisons with a gold-standard reference such as histology. One such approach is to perform a combined post-mortem MRI and histology experiment. To perform these experiments, post-mortem tissue is often first preserved in a fixative such as formalin. The presence of formalin fixative in tissue has been shown to dramatically reduce the T2. This effect is (approximately) linearly dependent on the concentration of fixative present1. Prior to scanning, samples are often placed in a fluid that has more favourable properties for imaging (e.g. perfluorocarbon fluids). Whilst placed in this fluid, if fixative slowly leaks out of the sample into the surrounding environment, this may lead to a reduced fixative concentration (Fig. 1) and increased T2 at the tissue surface. Here we propose a method to improve the homogeneity in these T2 maps by modelling the outflow of fixative in whole human brains. In these large samples, it is prohibitively time consuming to use conventional tissue preparation methods (i.e. soaking in PBS). Modelling is performed using a novel ‘kinetic-tensor’ (KT) model, which incorporates the effects of diffusion anisotropy within tissue.Theory
The decrease in T2 due to the presence of fixative has been previously explored by modelling the uptake of fixative into unfixed tissue2,3. Here we aim to use this same approach to model the outflow of fixative. We subsequently use the spatial pattern of fixative concentration as a confound to be removed, an approach that has not previously been explored. Previous work3 has modelled the flow of fixative within tissue assuming isotropic diffusion, defined here as the kinetic-isotropic (KI) model. Here, we additionally explore whether such a correction is more effective if it includes information about the orientational dependence of diffusion (the KT model), or improved modelling of the brains surface (KIgeom model), which additionally accounts for the fluid filled ventricles.The Kinetic Tensor model
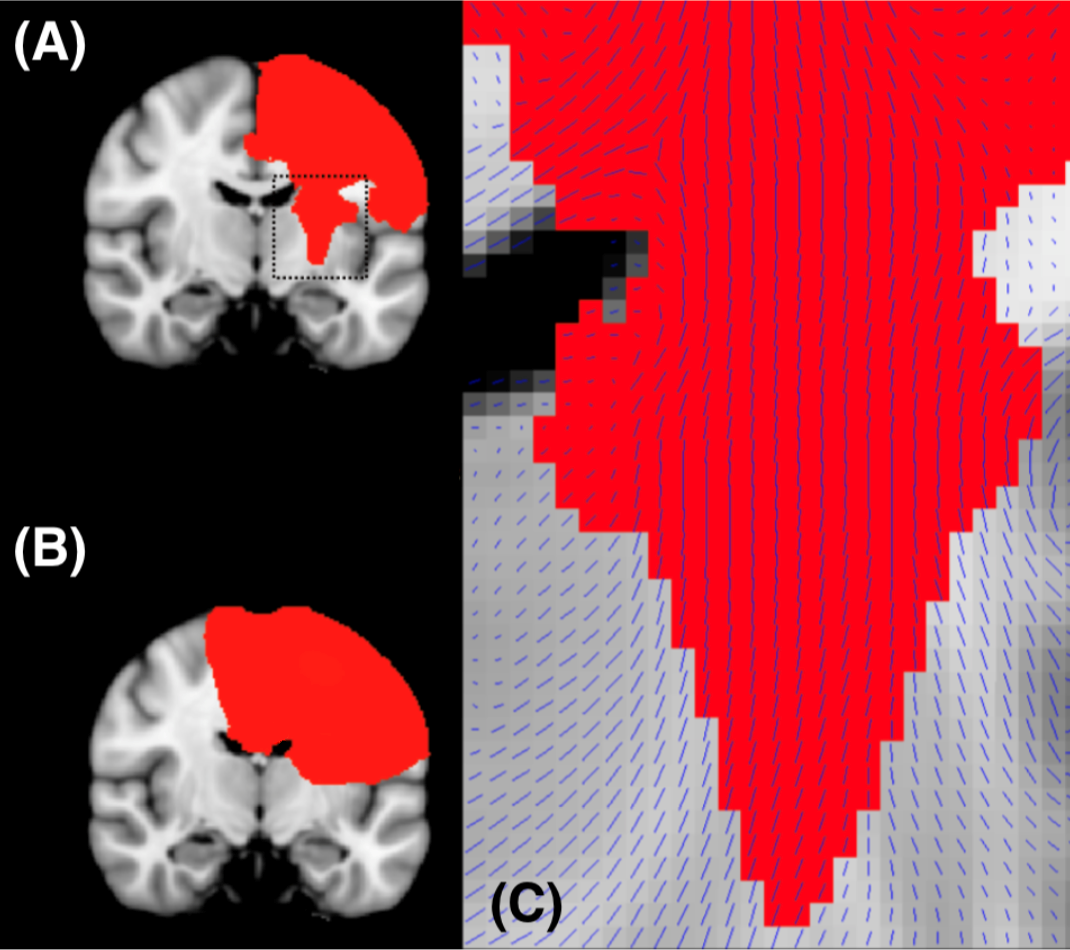
The KT model uses diffusivity estimates derived from diffusion MRI data within the same brain to model fixative dynamics, aiming to provide more accurate modelling within different tissue types then the KI model (Fig. 2). From a voxelwise estimate of the diffusion tensor within a post-mortem brain, using Fick’s second law: $$\frac{\partial{}c}{\partial{}t}=\nabla\cdot(\vec{D}\cdot\nabla{}c),\tag{1}$$ where $$$c$$$ is the concentration of fixative and $$$\vec{D}$$$ is the diffusion tensor. To model outflow, we simulate a concentration gradient at the tissue surface, assuming no fixative is present outside the brain (0% concentration), and the brain is fully fixed (100% concentration).
Methods
Whole, formalin-fixed, postmortem brains of 13 ALS patients and 3 controls were used in our experiment. All brains were formalin-fixed for at least one month (121$$$\pm$$$71 days) and immersed in fluorinert for approximately 48 hours prior to scanning. Samples were scanned using a multi-echo turbo spin-echo (TSE) sequence on a 7T whole body Siemens system (6 echoes, TEs=11,23,34,46,57,69ms, TR= 1000ms, resolution=0.65x0.65x1.3mm3). Diffusion MRI data were also acquired in each brain (further details in4) and diffusion tensor estimates derived. Quantitative T2 maps were derived through a regularised fitting of the signal to an extended phase graph (EPG) model, which accounts for B1 inhomogeneity5. The concentration of formalin within each brain was simulated using our KT model, assuming outflow for 48 hours (Fig. 1). This was implemented by discretizing Eq. (1) and using finite difference methods to iteratively update the fixative distribution6. The resulting concentration map was regressed out of the T2 map (i.e. assuming a linear relationship estimating a global regression coefficient). Comparisons were made between the KT, KI and KIgeom model by evaluating the homogeneity of T2 separately within grey and white matter. Correlations between T2 and stains for ferritin and myelin-proteolipid-protein (PLP) obtained within the same brains sample were estimated with and without correction using the KT model (which produced the most homogenous T2 estimates - see Results and Discussion).Results and Discussion
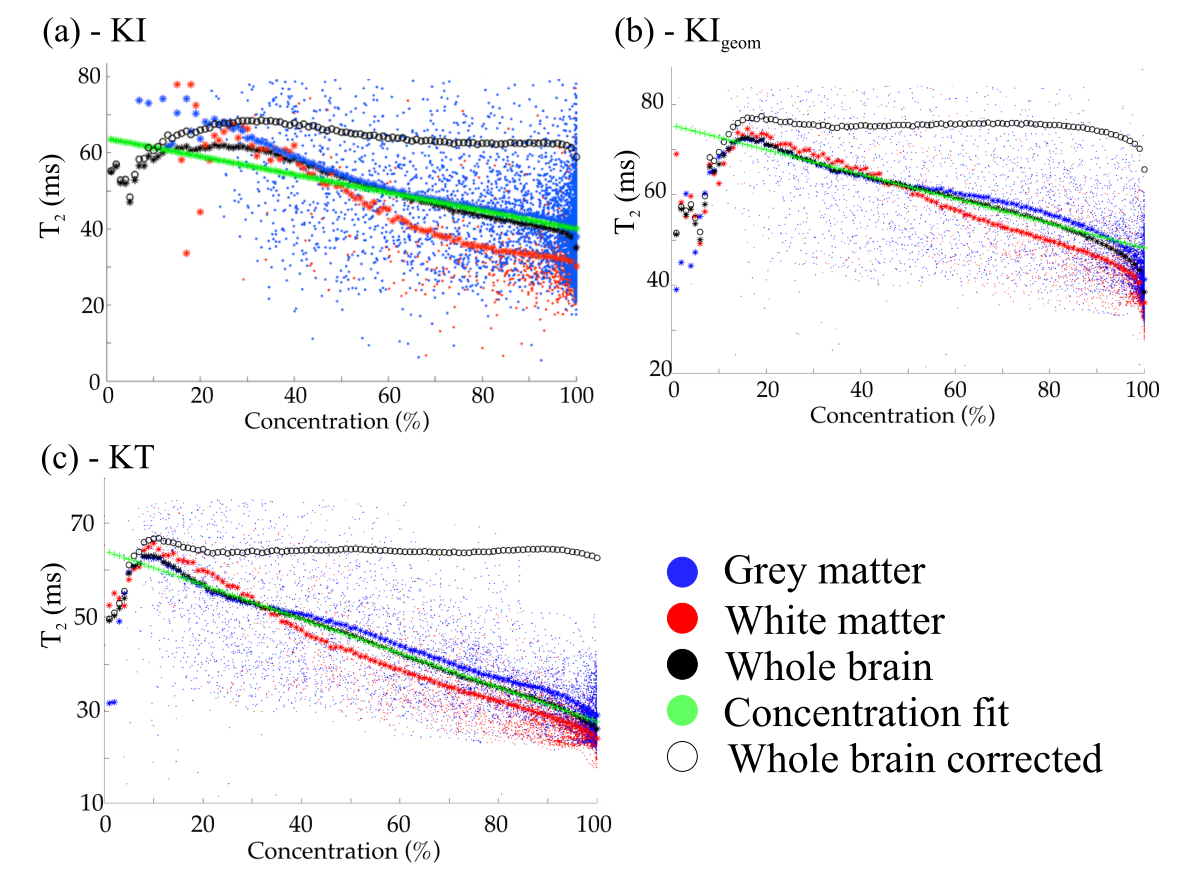
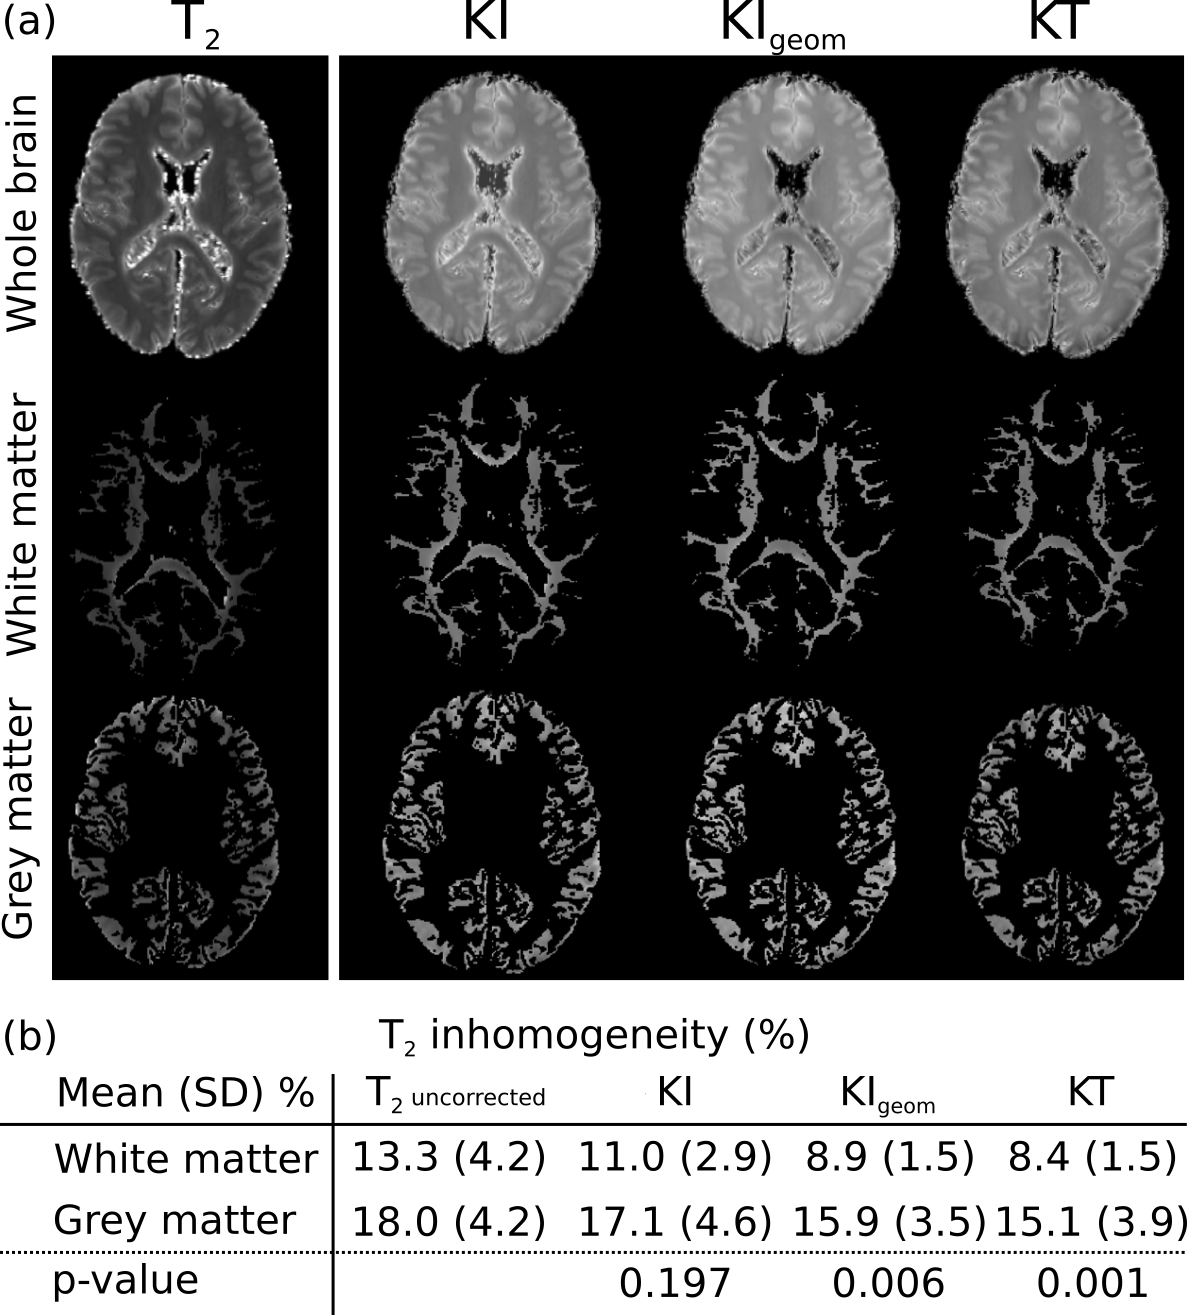
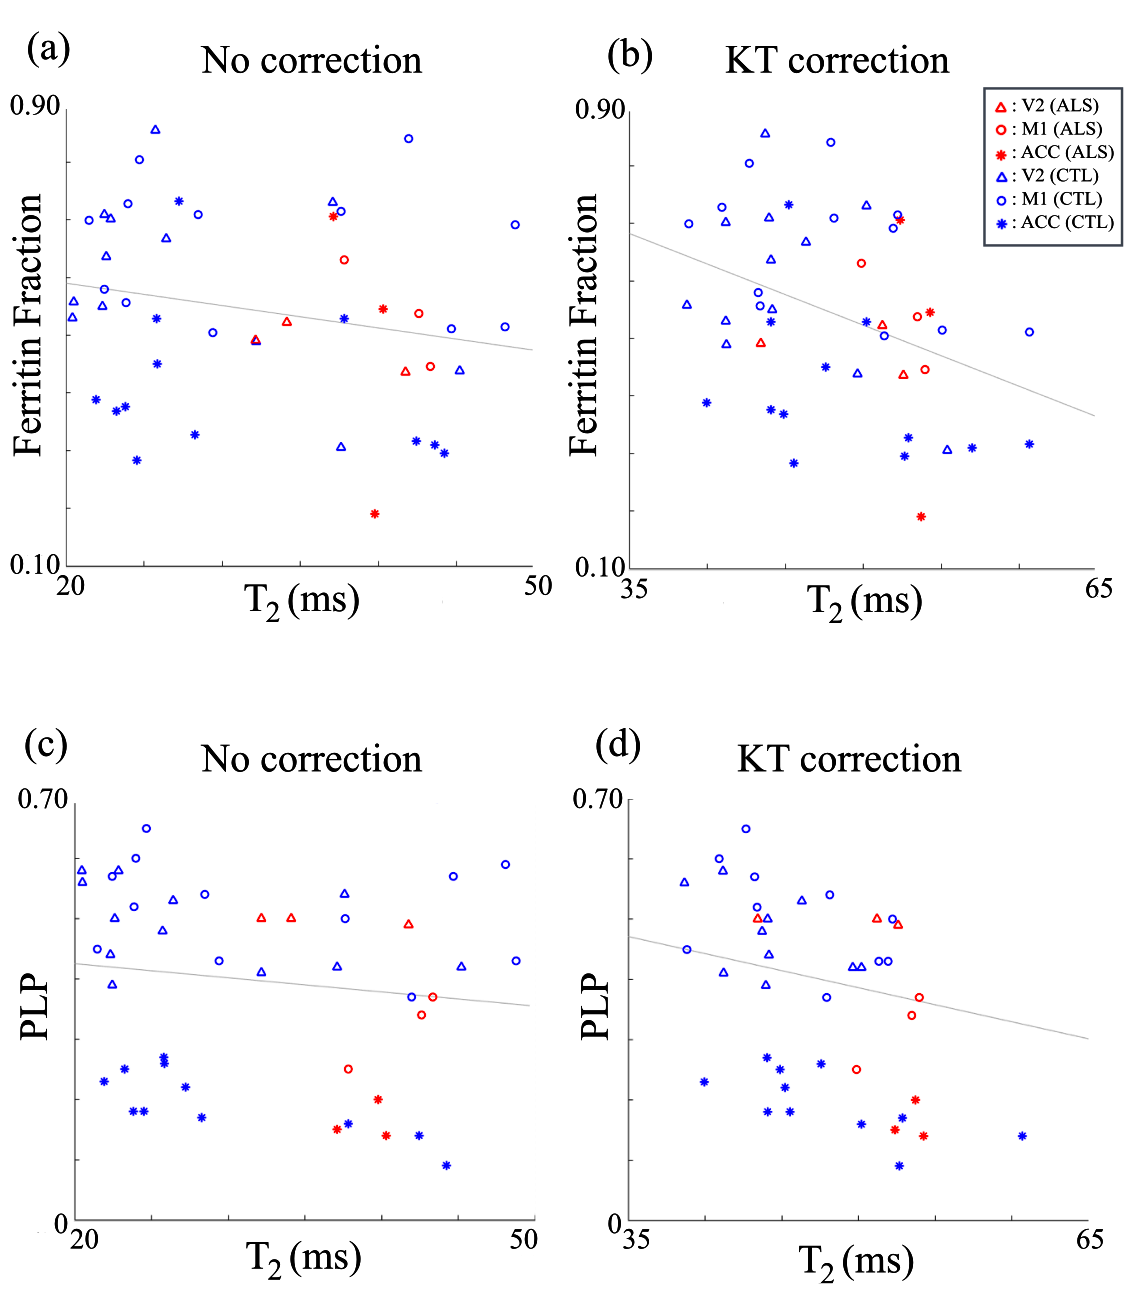
Figure 3 displays the relationship between T2 and fixative concentration. An approximately linear relationship is observed for all models, consistent with1. By fitting (green crosses) and regressing out the influence of fixative concentration (open circles), all models increase homogeneity. The KT model results in the flattest profile at high concentration, which corresponds to the majority of brain tissue. Figure 4a displays an example T2 map from our EPG fit before and after different corrections. Estimated T2 is increased in all our corrected maps, consistent with the literature suggesting that formalin reduces T2. The KT model achieved the highest homogeneity within both grey and white matter ROIs (Fig. 4b), highlighting the importance of incorporating both anisotropy and correct tissue geometry.Figure 5 compares correlation between the histological stains and the T2 estimates from the original EPG fit and after correction with the KT model. Correction for fixative concentration improves the correlation between staining results and T2. An increased effect size is obtained in both ferritin ($$$r=-0.21\rightarrow{}r=-0.37$$$) and PLP ($$$r=-0.07\rightarrow{}r=-0.12$$$), with ferritin only reaching significance (p<0.05) after KT correction.
Conclusion
By modelling and regressing out fixative concentration, we improve the homogeneity of T2 estimates across the brain, with further improvements when incorporating diffusion anisotropy and accurate anatomical geometry. This correction additionally strengthens the correlation between T2 and histology.Acknowledgements
Samuel A. Hurley and Benjamin C. Tendler contributed equally to this work.
This study was funded by a Wellcome Trust Senior Research Fellowship (202788/Z/16/Z) and Medical Research Council grant MR/K02213X/1. Brain samples provided by the Oxford Brain Bank (BBN004.29852). The Wellcome Centre for Integrative Neuroimaging is supported by core funding from the Wellcome Trust (203139/Z/16/Z).
References
1.Shepherd TM, Thelwall PE, Stanisz GJ, Blackband SJ. Aldehyde fixative solutions alter the water relaxation and diffusion properties of nervous tissue. Magn Reson Med. 2009. doi:10.1002/mrm.21977
2. Yong-Hing CJ, Obenaus A, Stryker R, Tong K, Sarty GE. Magnetic resonance imaging and mathematical modeling of progressive formalin fixation of the human brain. Magn Reson Med. 2005. doi:10.1002/mrm.20578
3. Dawe RJ, Bennett DA, Schneider JA, Vasireddi SK, Arfanakis K. Postmortem MRI of human brain hemispheres: T2 relaxation times during formaldehyde fixation. Magn Reson Med. 2009. doi:10.1002/mrm.21909
4. Pallebage-Gamarallage M, Foxley S, Menke RAL, et al. Dissecting the pathobiology of altered MRI signal in amyotrophic lateral sclerosis: A post mortem whole brain sampling strategy for the integration of ultra-high-field MRI and quantitative neuropathology. BMC Neurosci. 2018;19(1). doi:10.1186/s12868-018-0416-1
5. Weigel M. Extended phase graphs: Dephasing, RF pulses, and echoes - Pure and simple. J Magn Reson Imaging. 2015. doi:10.1002/jmri.24619
6. Jbabdi S, Mandonnet E, Duffau H, et al. Simulation of anisotropic growth of low-grade gliomas using diffusion tensor imaging. Magn Reson Med. 2005. doi:10.1002/mrm.20625
Figures