3169
Exploring the anatomical variability in the precision of frequency difference mapping in the corpus callosum at 7T1Department of Psychology, Cardiff University Brain Research Imaging Centre, Cardiff, United Kingdom
Synopsis
We explored the anatomical variability in reliability of complex mGRE signal, and of parameters estimated by modelling this signal as a superposition of complex myelin, intra- and extra-axonal water signals, in the corpus callosum at 7T. Our data showed to be repeatable in the posterior portion of the corpus callosum, while reliability was lower in more anterior portions. These findings have important implications and need to be considered when investigating callosal microstructure with mGRE in health and disease.
Introduction
Myelin plays an essential role in the healthy development and function of the nervous system. This stresses the fundamental importance of monitoring myelination longitudinally and non-invasively, both to inspect the healthy brain and to assess progression of brain disorders and treatment effects. A plethora of studies have demonstrated the non-mono-exponential nature of multi-echo gradient-recalled echo (mGRE) signal evolution1,2,3, which arises from anisotropic susceptibility of myelin sheaths. This provides quantitative measures sensitive to myelin. Assessing the test-retest repeatability of MRI measurements is essential for understanding their inherent technical and physiological variability, which in turn contribute to errors in measurement and confound detection of pathological or therapeutic changes.The present study explored the anatomical variability in reliability of complex mGRE signal, and of parameters estimated by modelling this signal as a superposition of complex myelin, intra- and extra-axonal water signals. The corpus callosum (CC) was chosen as area of interest because it presents high mGRE signal contrast due to its perpendicular orientation to the main magnetic field. Importantly, the CC is the biggest white matter tract in the human brain and plenty of studies have highlighted its importance in neurological and psychiatric disorders4,5,6.
Methods
Data acquisitionSix healthy subjects (3 female, 26-33y), underwent a series of mid-sagittal, single-slice mGRE scans (25 echoes; TE1/∆TE/TR = 1.62/1.23/100ms; flip-angle: 15°; voxel-size: 1x1x5mm3; FoV: 256x256x5mm3; 20 repeats with bipolar gradient-readout-polarity reversed half-way through the acquision) in a 7T MRI scanner (Siemens Healthineers, Erlangen, Germany) equipped with a 32-channel array-receive coil. Subjects were scanned five times within a two-week period to assess repeatability.
Data processing
The complex data were reconstructed per receive channel, followed by a complex multiplication of signals acquired with opposite read-gradient-polarities, in order to remove phase shift between the adjacent echoes. Image-based coil-sensitivity-estimation was then used to perform coil combination, which was integrated into frequency difference mapping (FDM) of the phase data7. FDM allowed removal of the RF-related phase offsets and linear effect of large-length-scale field perturbations, without perturbing the local non-mono-exponential white matter signal. Fig.1 shows an example of FDM and magnitude signal evolution with the echo-time for anterior/middle/posterior callosal segments and the corresponding images at TE=15ms for five visits.
Data analysis
We evaluated the test-retest repeatability between the FDM curves of each subject’s five repeats, for each segment, with the discrete Frechet distance, a measure of similarity between curves which takes into account the location and ordering of points along the curves.
FDM and magnitude signal evolutions from each callosal segment were modelled using a three-pool-model of complex signal evolution:
$$S(\mathrm{TE})\sim{}f_\text{a}\cdot{}e^{i\omega_\text{a}TE}+f_\text{m}\cdot{}e^{i\omega_\text{m}TE}{}e^{-R_{2,\text{m}}^*\mathrm{TE}}+f_\text{e}\cdot{}e^{-R_{2,\text{e}}^*\mathrm{TE}},\qquad\qquad\qquad[1]$$
where subscripts a/m/e denote intra-axonal/myelin/extra-axonal water pools, f stands for signal fractions, $$$\omega$$$-s are angular frequency offsets relative to the extra-axonal frequency, and R2* stands for the effective transverse relaxation rates. Intra-axonal R2*-values were constrained to 0 because of relatively short maximum TE (31ms). Non-linear least-squares fitting was performed in Matlab with the starting points and fitting boundaries of parameter set based on previous literature1,2,3,7,9. The coefficients of variation across the 5 visits were computed for Aa,m,e and for fa,m for each participant for each segment and across the whole CC.
Results
Fig.2 shows the test-retest similarity of the frequency difference curves based on the discrete Frechet distance. The top row displays Frechet distance matrices from a representative participant for the three callosal segments. The bottom row plots repeatability of frequency difference evolution across five visits for all subjects. The parameters estimated by fitting the 3-pool-model in Eq.[1] to the data from all subjects averaged across visits are shown in Fig.3. Tab.1 quantifies the reproducibility of fitting parameters across the callosal segments by showing the corresponding mean, standard deviation and coefficients of variation.Discussion
Our results show that the precision of FDM in the corpus callosum is anatomically variable: analysis of curve similarity (Fig.2) and fitting parameters' repeatability (Fig.3) suggested greater accuracy of obtained measures in the posterior callosal portion as compared to the anterior sections. This is shown by generally lower Frechet distance values and by overall low coefficients of variation calculated for the fitting parameters, which ranged between 3.72% and 12.02%, in this region. Lower reproducibility of the data in the anterior portion of the corpus callosum could be attributed to in-flow artifacts from the anterior cerebral artery; potential solutions and their limitations have been discussed in previous work10.The estimated fitting parameters for the intra-axonal and myelin water frequency offsets ($$$-7.9~$$$to$$$~-8.5\,$$$Hz and $$$27.1~$$$to$$$~31.4\,$$$Hz, respectively) and the myelin water signal fraction ($$$0.15~$$$to$$$~0.16$$$) are consistent with previously reported values1,2,7,9. The relative signal fraction between intra- and extra-axonal compartments was lower than in other studies. This could be attributed to the constraint on the intra-axonal water R2* in our model, which we introduced in order to reduce the effect of the limited number of long echo times on the value estimation uncertainty.
Conclusion
Our data shows that complex mGRE signal, and parameters estimated by modelling this signal as a superposition of myelin, intra- and extra-axonal water pools, are repeatable in the posterior portion of the CC, while they are less so in more anterior portions. These findings have important implications and need to be considered when investigating callosal microstructure with mGRE in health and disease.Acknowledgements
We thank Dr Slawomir Kusmia, Dr Mark Drakesmith and Dr Fabrizio Fasano (Siemens Healthcare GmbH) for their support with the project.
References
1. Wharton S, Bowtell R. Fiber orientation‐dependent white matter contrast in gradient echo MRI. Proc Natl Acad Sci U S A. 2012;109:18559–18564.
2. Sati P, van Gelderen P, Silva AC, et al. Micro‐compartment specific T2* relaxation in the brain. NeuroImage. 2013;77:268–278.
3. Wharton S, Bowtell R. Gradient echo based fiber orientation mapping using R2* and frequency difference measurements. NeuroImage. 2013;83:1011–1023.
4. Luders E, Di Paola M, Tomaiuolo F, Thompson PM, Toga AW, Vicari S, Petrides M, Caltagirone C. Callosal morphology in Williams syndrome: a new evaluation of shape and thickness, Neuroreport , 2007; 18:203-207)
5. Kim H, Piao Z, Liu P, Bingaman W, Diehl B. Secondary white matter degeneration of the corpus callosum in patients with intractable temporal lobe epilepsy: a diffusion tensor imaging study, Epilepsy Res , 2008; 81:136-142)
6. Di Paola M, Luders E, Di Iulio F, Varsi AE, Sancesario G, Passafiume D, Thompson PM, Caltagirone C, Toga AW, Spalletta G. Callosal atrophy in mild cognitive impairment and Alzheimer's disease: different effects in different stages, Neuroimage, 2010; 49:141-149.
7. Tendler, B C, & Bowtell, R. Frequency difference mapping applied to the corpus callosum at 7T. Magnetic Resonance in Medicine, 2019; 3017–3031.
8. Eiter T, Mannila H. Computing discrete fréchet distance. See Also 1994; 64:636–637.
9. Thapaliya, K., Vegh, V., Bollmann, S., & Barth, M. (2018). Assessment of microstructural signal compartments across the corpus callosum using multi-echo gradient recalled echo at 7 T. NeuroImage, 182, 407–416. https://doi.org/10.1016/j.neuroimage.2017.11.029
10. Nam, Y., Kim, D.-H., & Lee, J. (2015). Physiological noise compensation in gradient-echo myelin water imaging. NeuroImage, 120, 345–349. https://doi.org/10.1016/j.neuroimage.2015.07.014
Figures
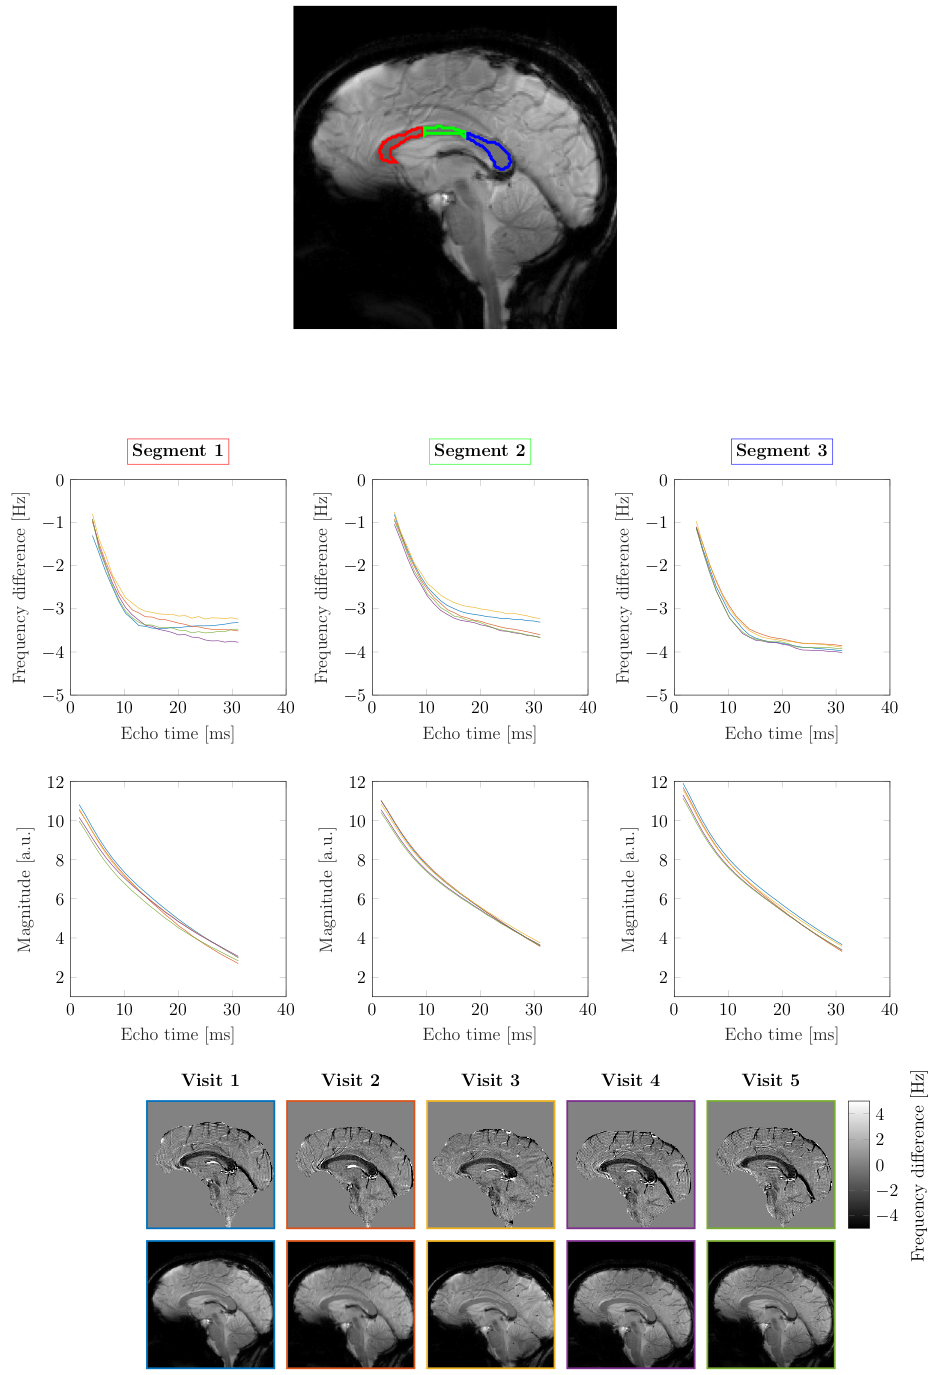
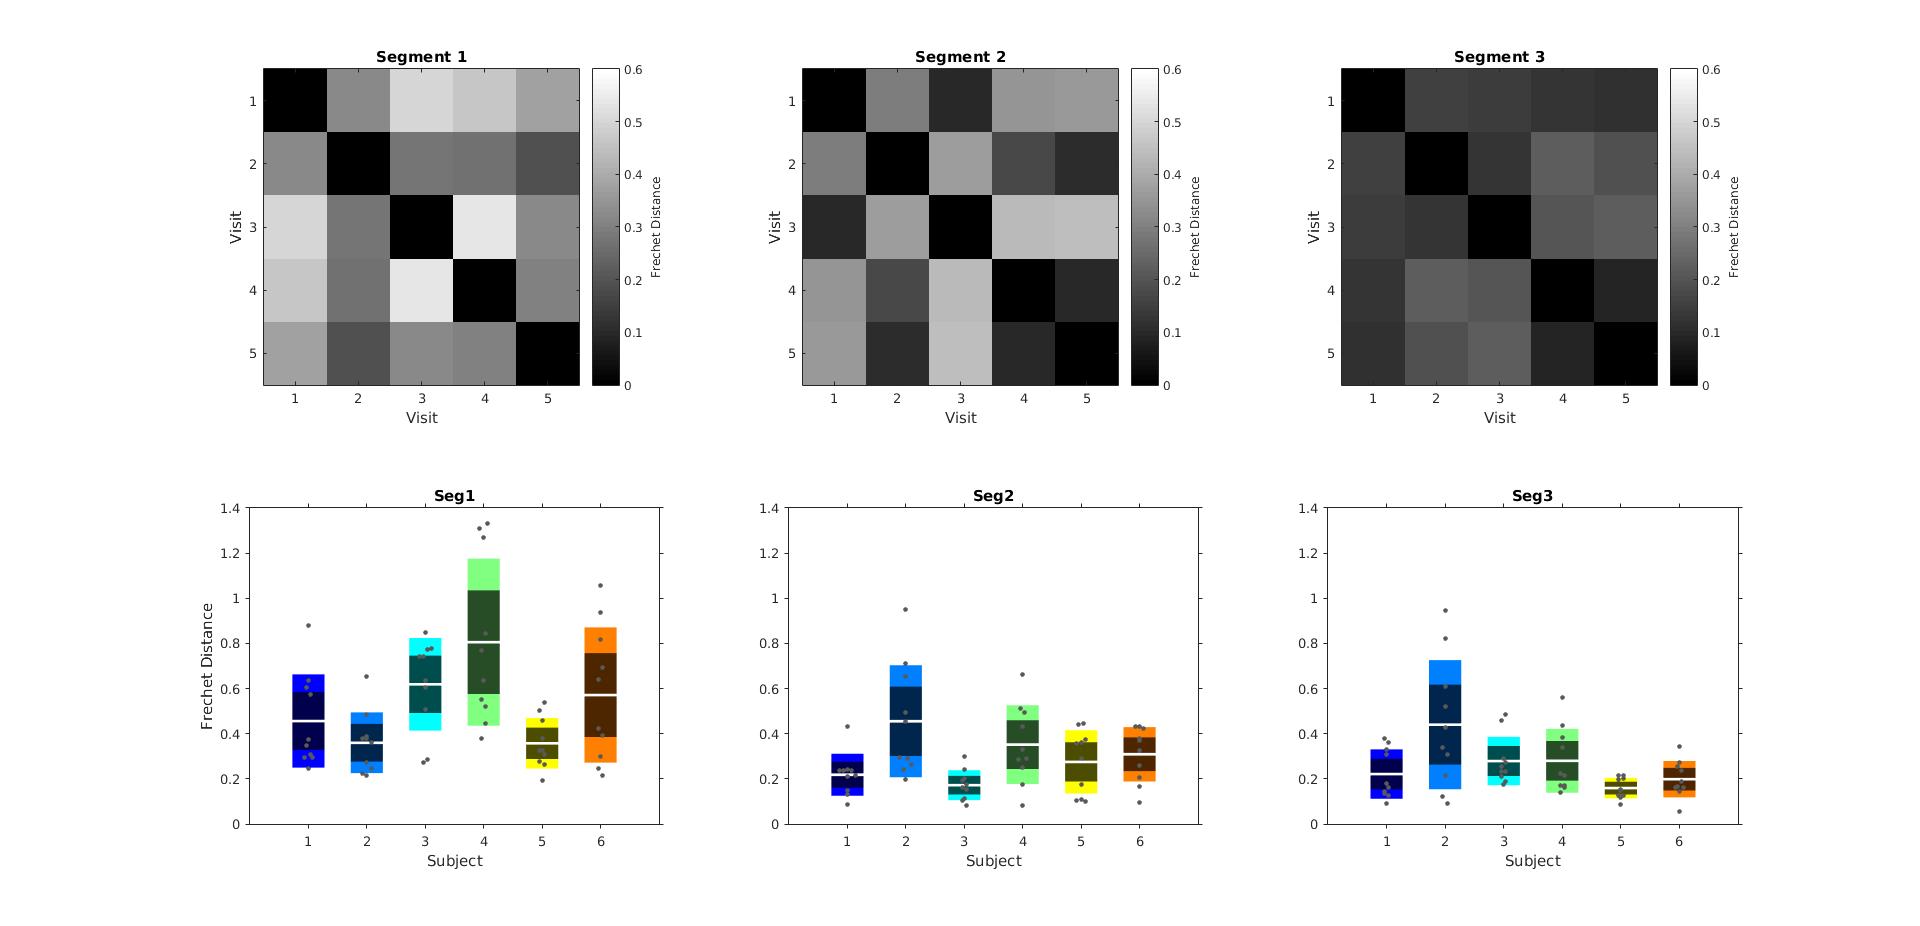
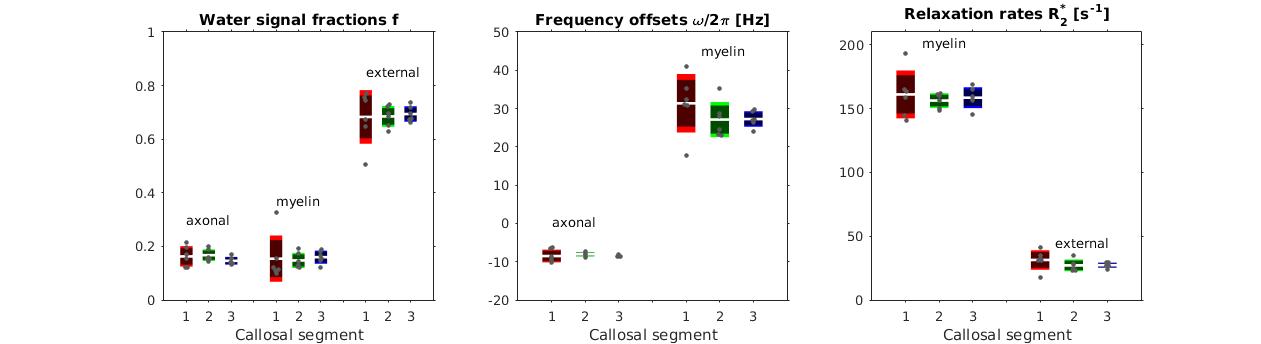
Fig.3: Fitting parameters estimated from fitting the three-pool model, grouped for all subjects. Colours represent the three callosal segments (red/green/blue for anterior/mid/posterior segments, respectively). The first plot shows signal fractions of myelin, intra-/extra-axonal water; the frequency offsets are displayed in the middle plot; the last plot shows the relation rates of myelin and extra-axonal water signals.
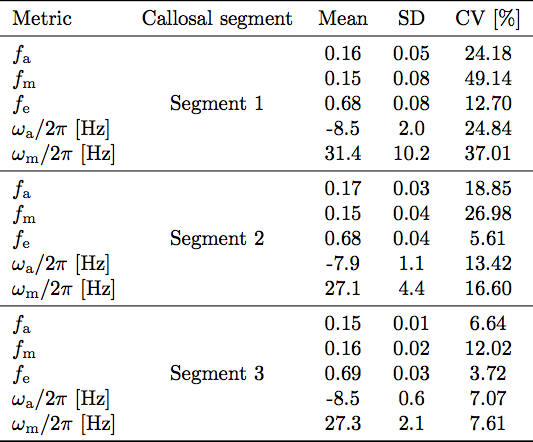
Tab.1 Repeatability was tested for signal fractions of myelin, intra-/extra-axonal water, and the frequency offsets of axonal and myelin pools, as these are of interest when quantifying myelin status. Means, standard deviation (SD) and coefficients of variation (CV) are reported for each value, across the different segments.