3168
Quantitative Estimation of Visual Sensitivity to Early Pathological Changes in T2-Weighted Images1Department of Biomedical Engineering, Tel Aviv University, Tel Aviv, Israel, 2Brain Imaging Research Center (BIRC), Soroka Medical Center, Beer Sheva, Israel, 3Zlotowski Center for Neuroscience, Ben-Gurion University of the Negev, Beer Sheva, Israel, 4Center for Advanced Imaging Innovation and Research (CAI2R), New-York University Langone Medical Center, New York, New York, NY, United States, 5Sagol School of Neuroscience, Tel-Aviv University, Tel Aviv, Israel
Synopsis
Quantitative MRI (qMRI) may provide higher sensitivity to early pathological changes than standard qualitative assessment. This advantage, however, is yet to be rigorously compared with conventional diagnostic methods. This study aims to quantify the human ability to detect predefined changes in T2-weighted images as part of the diagnostic process of multiple sclerosis (MS). A visual diagnostic test was performed on neurosciences students, suggesting that the human vision has lower sensitivity to subtle MS lesions in T2-weighted images, in comparison to quantitative assessment of the change in T2 values.
Introduction
Multiple sclerosis (MS) is a chronic neurological disease affecting more than 2 million people worldwide. MS is characterized by demyelination of white matter (WM) in the central nervous system, visible on MRI1. MS pathology is typically assessed on T1 or T2 weighted images (e.g. using MPRAGE or FLAIR) according to brain lesion load2. Recent studies report the use of quantitative MRI (qMRI) as a new approach for diagnosing neurodegenerative diseases, and specifically MS, allowing to identify pathology in normal-appearing white matter (NAWM)3–5. Past attempts to evaluate the utility of standard diagnosis included assessing the sensitivity of radiologists’ eyes to MS related lesions6, while more recent studies attempted to compare physicians’ performance to neural networks7,8. Still, the common qualitative diagnosis and qMRI are yet to be explicitly compared. In this work, the traditional diagnostic method was numerically evaluated using a two-alternative forced choice test (2AFC)9 and compared with an alternative qMRI-based tool.Methods
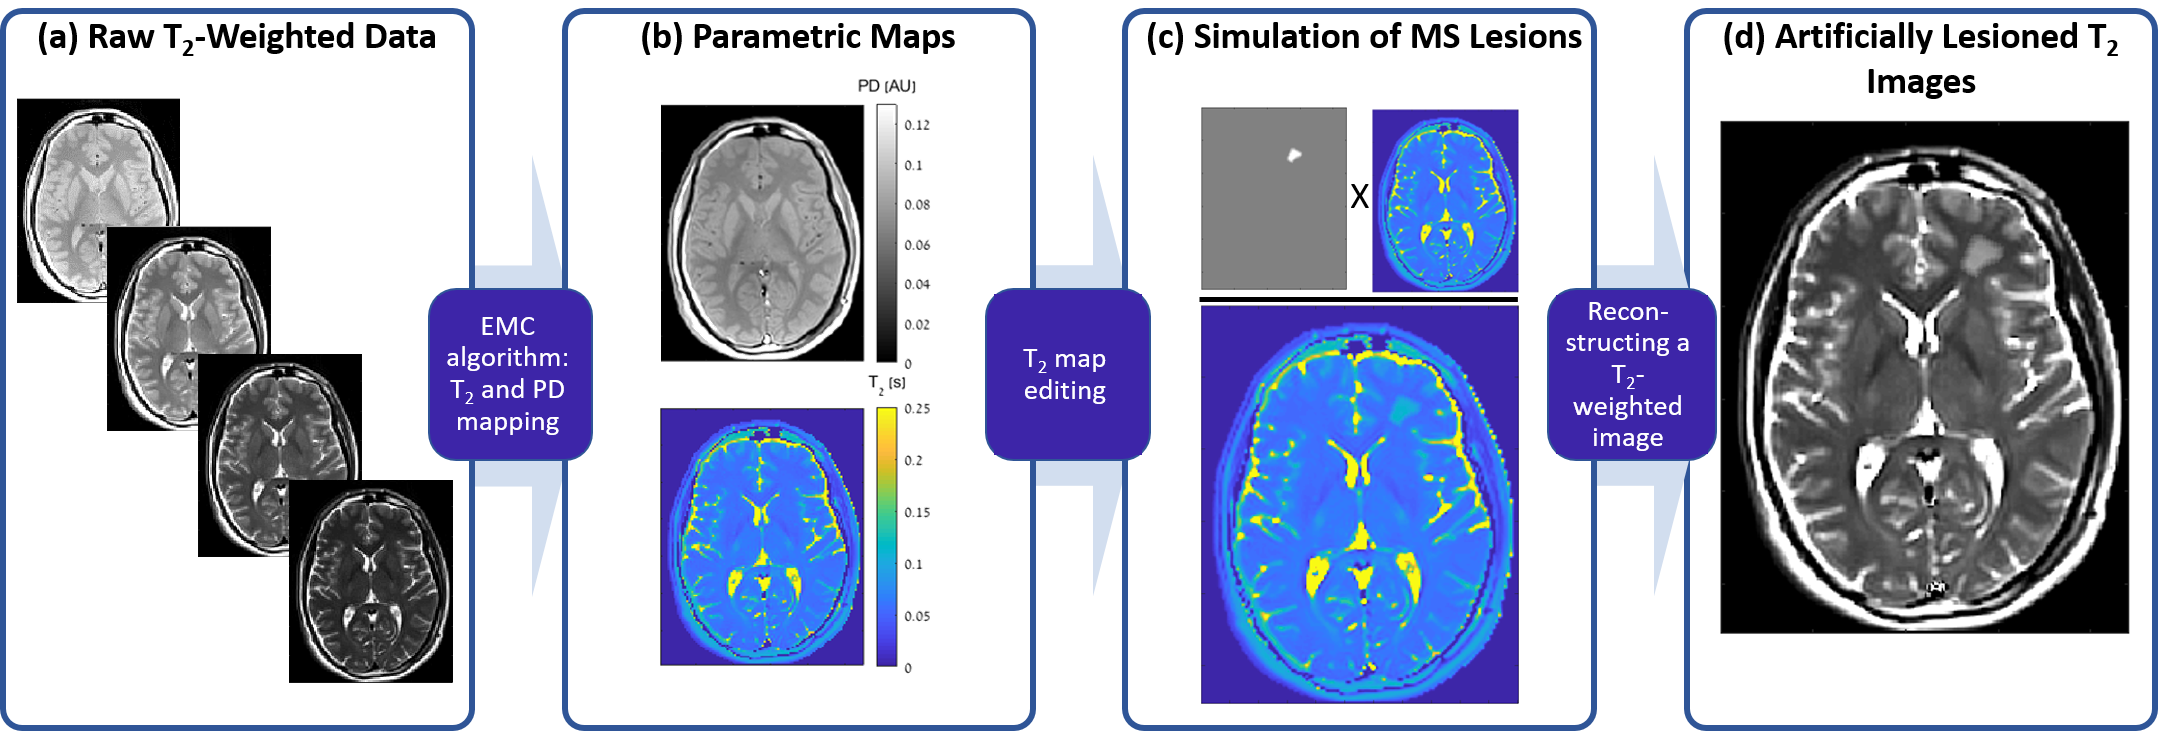
MRI scans: Axial brain images were acquired using a multi echo spin-echo (MESE) sequence. Imaging was done on a 3T Siemens Prisma scanner. Scan parameters included: Nechoes=20; TE/TR=10/2400 ms; in-plane resolution=1.5x1.5 mm2, slice=3 mm, bandwidth=200 Hz/Px, Nslices=9.Generation of parametric maps: T2 and PD maps were generated using a pixel-wise fitting of the MESE data using the Echo-Modulation-Curve algorithm10.
Generation of artificial lesions on T2-weighted (T2w) images: Resulting T2 maps were altered to simulate a MS related WM focal change in T2 values. T2w images were reconstructed using the theoretical exponential decay model with the original PD map and the altered T2 map (Fig. 1).
T2w images were simulated in 3 different TEs: 90, 70, and 40 ms, and 8 different lesion severity levels: 6, 9, 12, 15, 18, 21, 25 and 30 % of change in T2 value.
2AFC experiment: A trial was designed, according to the 2AFC method9, to measure the human ability to detect pathological alteration of T2 relaxation times via visual inspection of T2w images. The trial took ~30 minutes, during which subjects were presented with a series of T2w brain images, each containing a single WM lesion with a predefined severity (i.e. predefined change in T2 value).
Trial consisted of two phases: training and test. In the training phase, the subject was presented with a pair of images of the same anatomy: one for reference, and another embedded with an artificial lesion. By comparing the two images, the subject learned the trial’s typical lesion size, shape and location. During the test phase, subjects were shown a series of images from 3 different anatomical slices, and were requested to detect the existence location of lesions. Trial is repeated three times for three levels of T2 weighting, i.e. echo times (TEs). Each trial consisted of 32 images with lesions and 16 control images with no lesion. Subjects for the trial were a group of 33 neuroscience and medical students.
Statistical analysis: trial data was analyzed to calculate the rates of true positives (correct detections of lesions), true negatives (correct identifications of images with no lesions), false positives (incorrect detections of nonexistent lesions) false negatives (missed lesions). Rates were then used to evaluate the subjects’ performance (area under the receiver operating characteristic, AUC) in diagnosing MS pathology.
Results
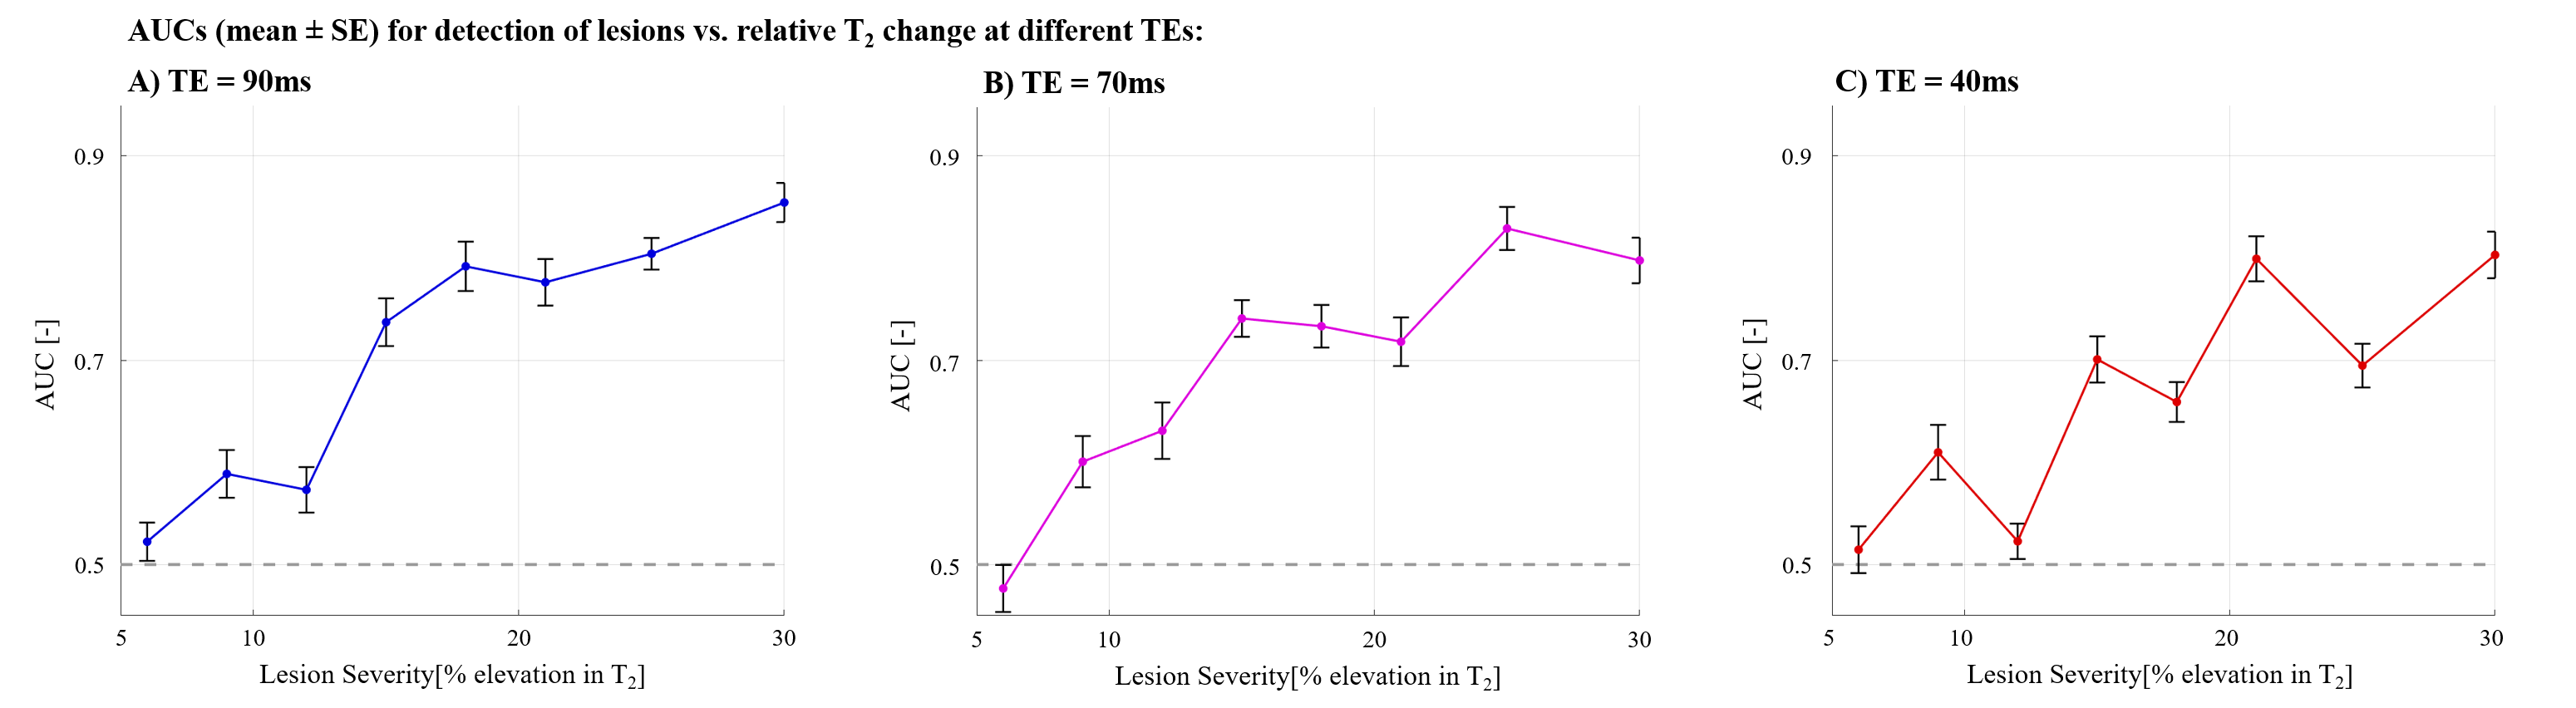
Figure 2 presents the AUC detection rate vs. lesion severity, for a group of 33 subjects.Our results suggest that the tested population was able to detect pathological T2 changes in brain WM tissue, only for relative changes of 9% and above. AUCs for T2 change of 6% were not significantly different than 0.5, meaning that the subjects did not perform better than a random guess for this value.
Discussion
Quantitative assessment of pathology in NAWM was previously shown to be sensitive to ~5% change in the tissue T2 value3. This is based on comparing T2 values in NAWM tissue of MS patients vs. heathy controls, and across different brain segment (e.g., caudate nucleus, body of corpus callosum). The visual assessment performed in this study suggests that only changes of 9% and above are visually detectable.Our results suggest that quantitative techniques might be a more powerful diagnostic tool. The study, however, reflects performance for students with basic knowledge in brain anatomy, and thus stand only as a preliminary stage, requiring further validation on a population of radiologists vis-à-vis quantitative computerized diagnosis of the same dataset.
We believe that additional improvement to diagnostic sensitivity can be gained by incorporating changes in tissue PD values, in combination with the T2 relaxation times.
Acknowledgements
ISF Grant 2009/17References
1. Reich, D. S., Lucchinetti, C. F. & Calabresi, P. A. Multiple Sclerosis. N. Engl. J. Med. 2018;378, 169–180.
2. Filippi, M. et al. MRI criteria for the diagnosis of multiple sclerosis: MAGNIMS consensus guidelines. Lancet Neurol. 2016;15, 292–303.
3. Shepherd, T. M. et al. New rapid, accurate T2quantification detects pathology in normal-appearing brain regions of relapsing-remitting MS patients. NeuroImage Clin. 2017;14, 363–370.
4. Gracien, R.-M. et al. Multimodal quantitative MRI assessment of cortical damage in relapsing-remitting multiple sclerosis. J. Magn. Reson. Imaging 2016;44, 1600–1607.
5. Hagiwara, A. et al. Utility of a Multiparametric Quantitative MRI Model That Assesses Myelin and Edema for Evaluating Plaques, Periplaque White Matter, and Normal-Appearing White Matter in Patients with Multiple Sclerosis: A Feasibility Study. Am. J. Neuroradiol. 2017;38, 237–242.
6. Woo, J. H., Henry, L. P., Krejza, J. & Melhem, E. R. Detection of Simulated Multiple Sclerosis Lesions on T2-weighted and FLAIR Images of the Brain: Observer Performance. Radiology 2006;241, 206–212.
7. Liu, X. et al. A comparison of deep learning performance against health-care professionals in detecting diseases from medical imaging: a systematic review and meta-analysis. Lancet Digit. Heal. 2019;1, e271–e297.
8. Cook, T. S. Human versus machine in medicine: can scientific literature answer the question? Lancet Digit. Heal. 2019;1, e246–e247.
9. Hanley, J. A. & McNeil, B. J. The meaning and use of the area under a receiver operating characteristic (ROC) curve. Radiology 1982;143, 29–36.
10. Ben-Eliezer, N., Sodickson, D. K. & Block, K. T. Rapid and accurate T 2 mapping from multi-spin-echo data using Bloch-simulation-based reconstruction. Magn. Reson. Med. 2015;73, 809–817.
Figures