3167
Assessment of the sensitivity of inhomogeneous Magnetization Transfer (ihMT) brain imaging with B1+ variations at 3T1Aix-Marseille Univ, CNRS, CRMBM, Marseille, France, 2APHM, Hôpital Universitaire Timone, CEMEREM, Marseille, France, 3Siemens Healthcare SAS, Saint-Denis, France, 4Division of MR Research, Radiology, Beth Israel Deaconess Medical Center, Harvard Medical School, Boston, MA, United States
Synopsis
Inhomogeneous Magnetization Transfer (ihMT) is a novel myelin imaging technique. As for many other MRI techniques special attention must be paid to local B1+ variations in applications at high field. In this work, a detailed analysis of the ihMT ratio sensitivity to B1+ inhomogeneities is performed in the context of human brain imaging at 3T. It is shown that concentrating RF power is an efficient way to reduce B1+ induced bias and that the overall performance of the technique lies on a tradeoff between high ihMT ratios (sensitivity) and reduced sensitivity to B1+ inhomogeneities.
Introduction
Inhomogeneous Magnetization Transfer (ihMT) imaging is a recent technique that has demonstrated good sensitivity to myelination1,2. When performed at relatively low field (e.g. 1.5T) or in small field of view (e.g. in small animal applications) a rather homogeneous B1+ environment is typically observed. However, special attention must be paid to the local B1+ variations when applications at high field or on large samples are targeted, to prevent shadowing artifacts inherent to B1+ inhomogeneities.Mchinda et al. have evidenced different B1+ dependency regimes of the ihMT ratio metric (ihMTR) as a function of the RF energy concentration of MT saturation pulses using a sensitivity-boosted ihMT gradient echo (ihMT-GRE) sequence at 1.5T3. It was shown that concentrating RF power (i.e. use of long TR) may yield lower relative variations of ihMTR with B1+ variations (illustrated on Figure 1 with simulated ihMTR data), hence holding promise for high field applications. These findings have been confirmed experimentally in a recent preliminary study performed on brain at 3T4.
In this work, we expand on these results and present a thorough analysis of the ihMTR metric sensitivity to local B1+ values in order to provide hints for the optimization of ihMT-GRE sequences at 3T for human brain applications.
Materials and methods
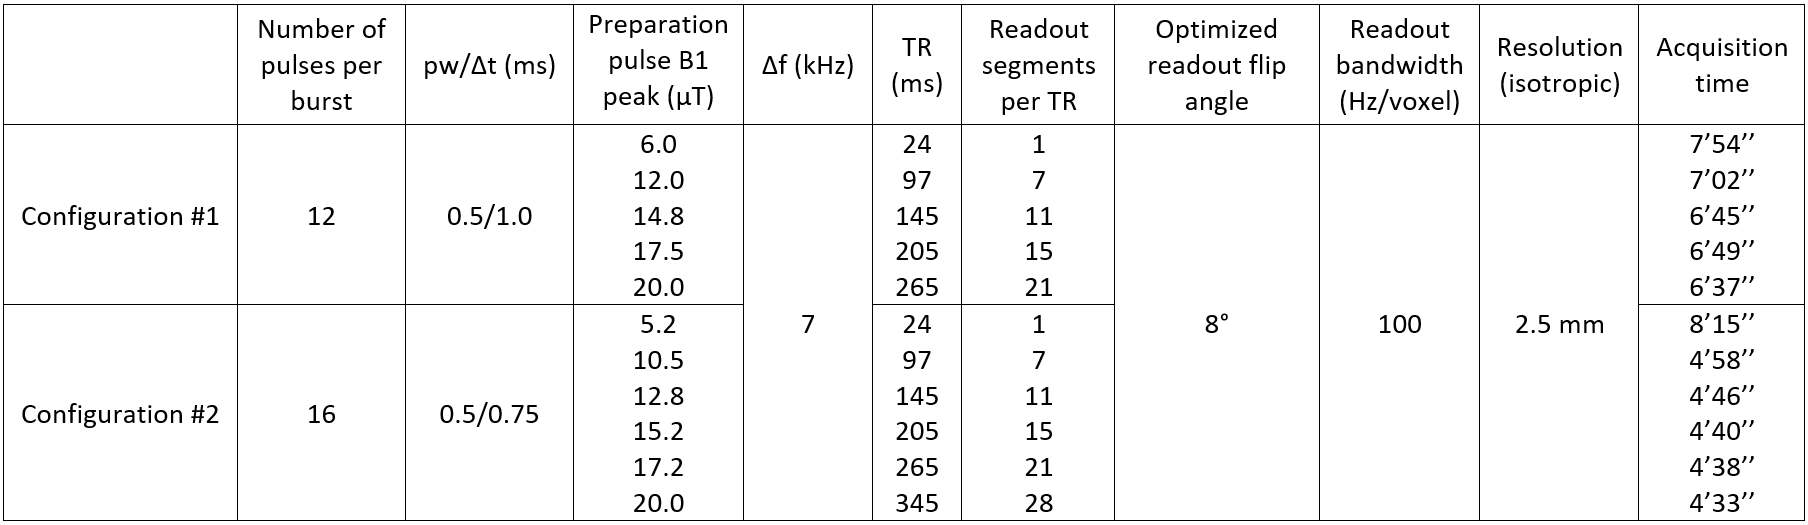
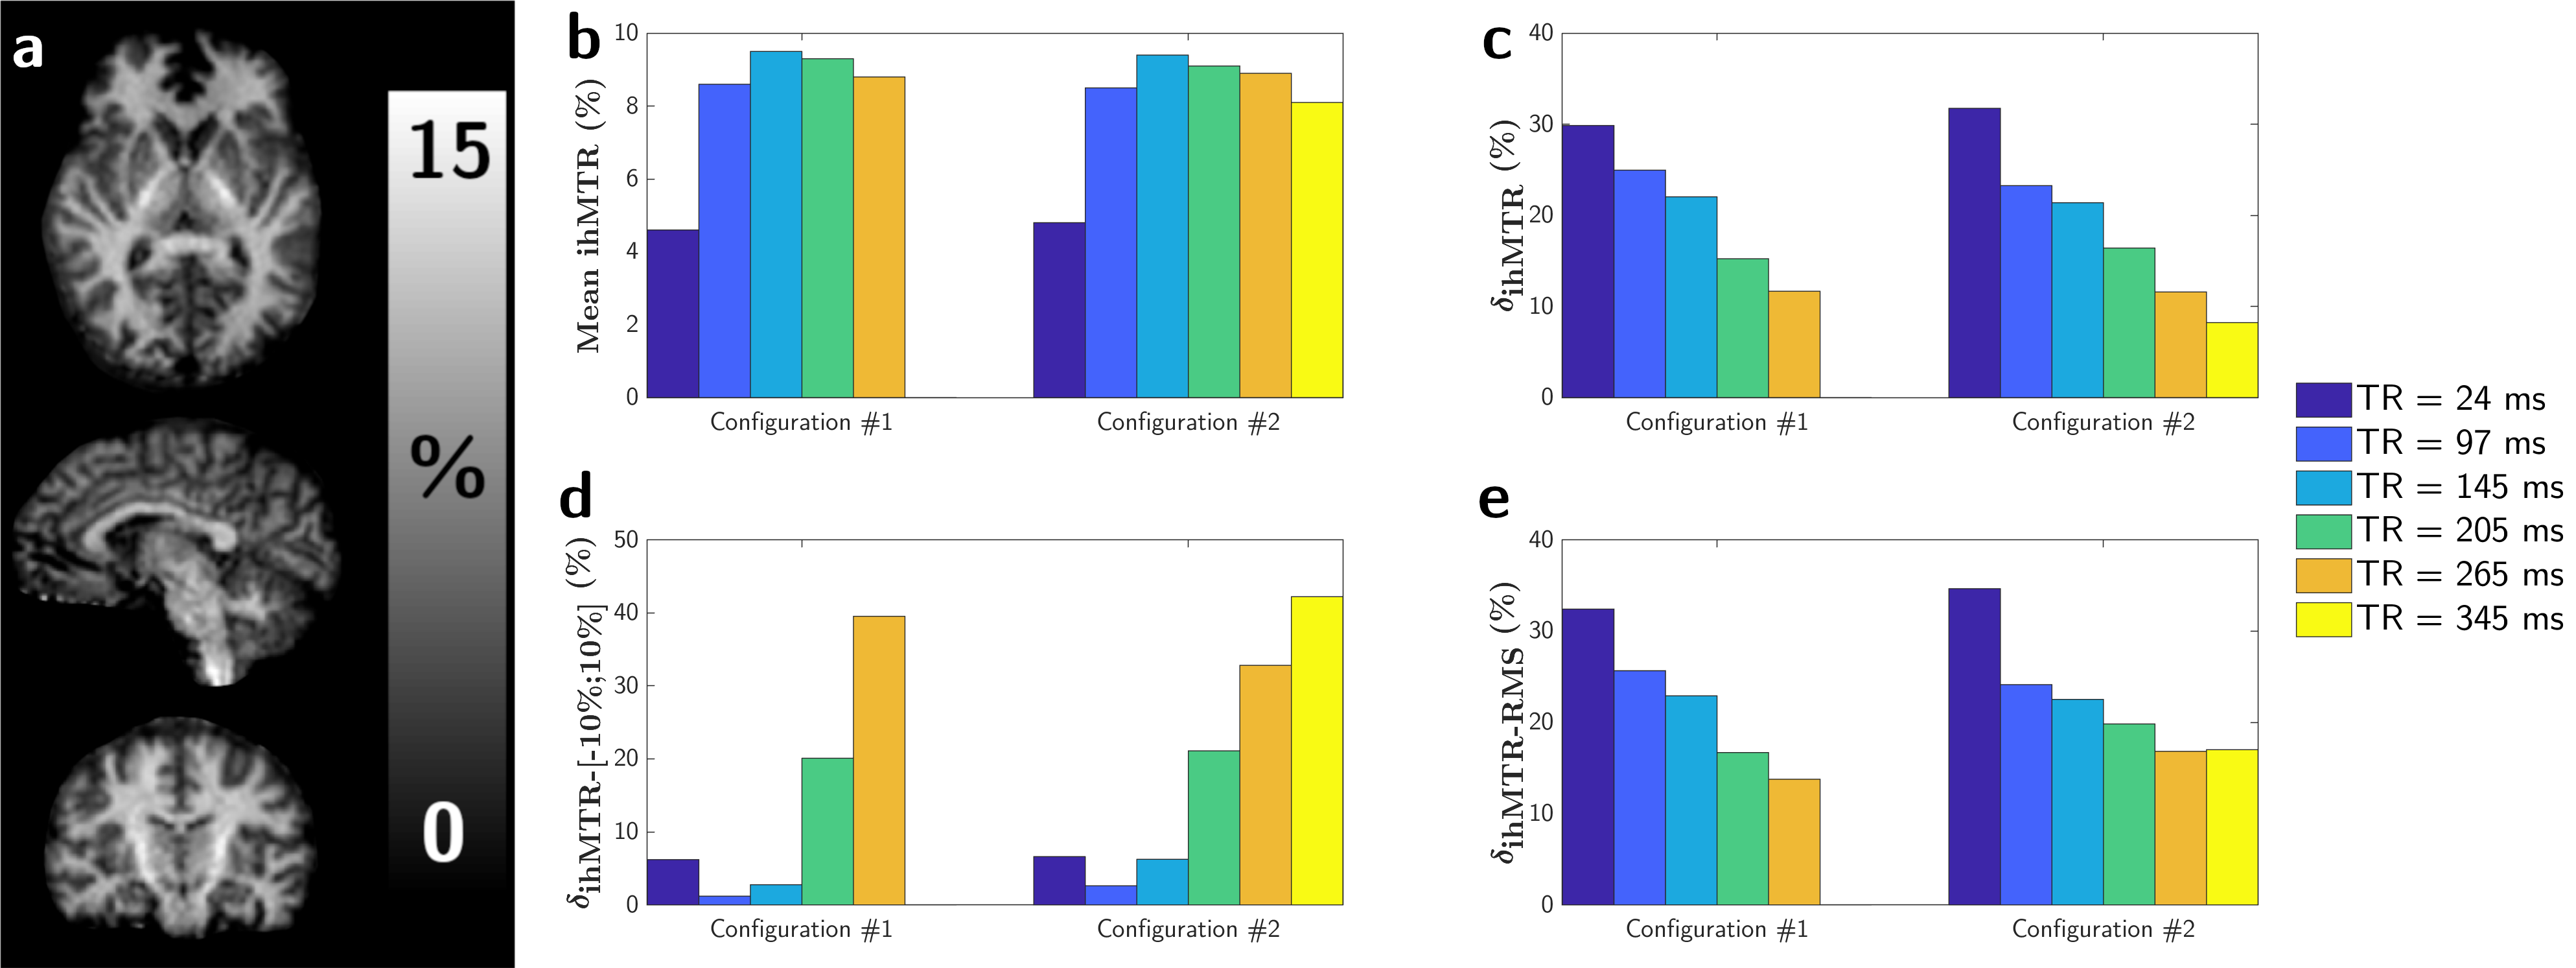
Experiments were performed on a 3T clinical scanner (Verio, Siemens Healthineers, Erlangen, Germany) with body coil transmission and a 32-channel receive head coil on healthy volunteers. Every protocol included a 3D anatomical sequence (MPRAGE) as well as a B1+ mapping sequence (pre-saturated turbo FLASH). Two sets of 3D ihMT-GRE sequences (referred hereafter to as Configuration #1 and #2 with parameters listed in Table 1) were acquired on three volunteers each, with a constant nominal B1,RMS of 2.7 µT. Both configurations mostly differ in their number of RF pulses per saturation burst3, with Configuration #2 allowing for stronger RF energy concentration (achieved with longer TR) considering the peak power limitations of the system. Each ihMT experiment was performed twice: 1) with a nominal B1+ adjustment, and 2) with a B1+ distribution deliberately attenuated by 20%, achieved by setting the transmitter reference voltage to 80% of its nominal value (respectively referred hereafter to as Vref and Vref,80%).Analyses were performed on the whole white matter area segmented from the MPRAGE using FreeSurfer5, and projected over ihMTR and resampled B1+ maps. All extracted voxels were pooled across the three subjects for each generated map. Resulting distributions were used for the computation of mean and standard deviation of ihMTR from the Vref datasets. Composite maps of voxel-wise ihMTR relative variation between Vref and Vref,80% (δihMTR) were used to compute the following statistics: i) mean and standard deviation of δihMTR; ii) voxel fraction with a relative variation within a 10% error margin: δihMTR-[-10%;10%]; iii) root-mean-square error with respect to the ideal case of a 0% ihMTR relative variation (perfect immunity to B1+ variations): δihMTR-RMS. Insight into the B1+ spatial distribution was further provided by investigating the same metrics in clusters of WM voxels with specific B1+ values ranging from 0.86 to 1.16 (1.00 referring to the nominal B1+ value), with a class size of 0.02.
Results
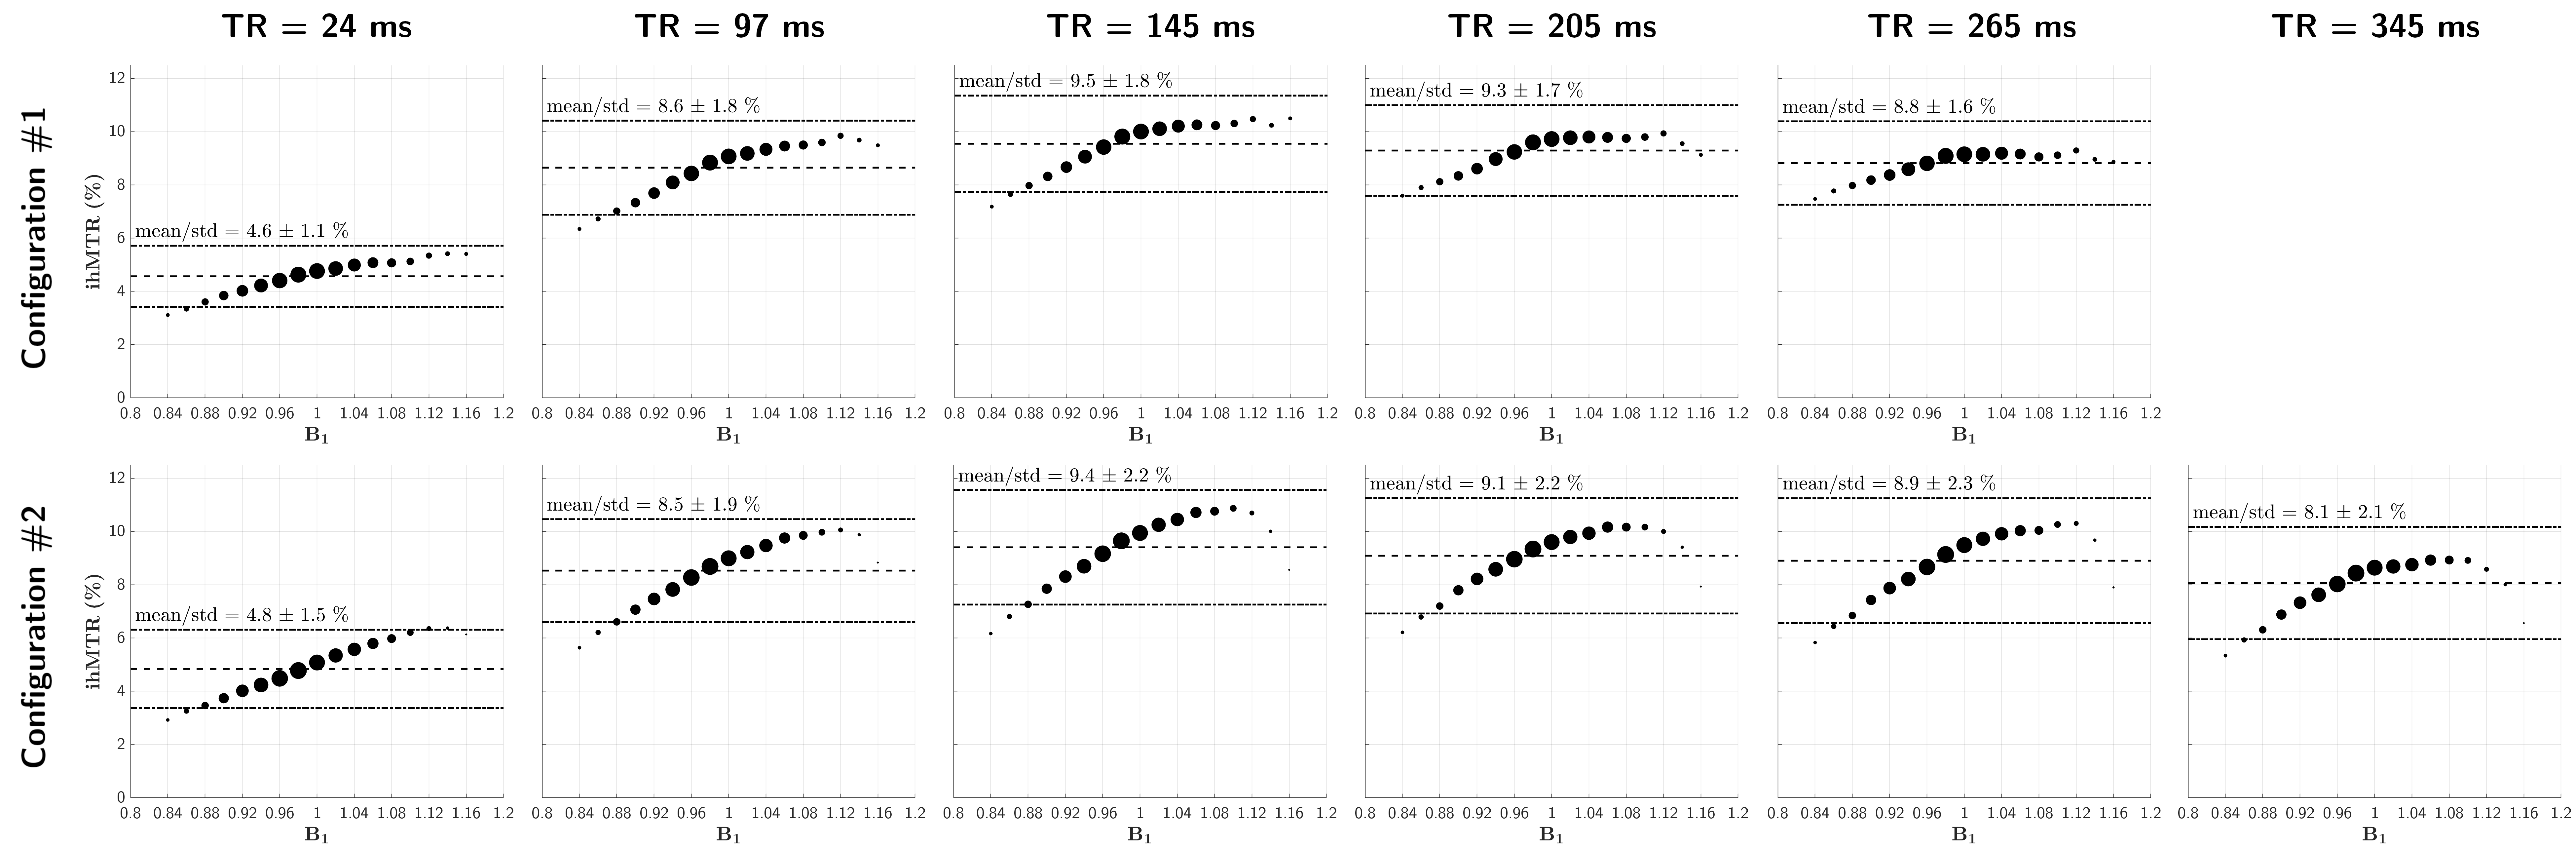
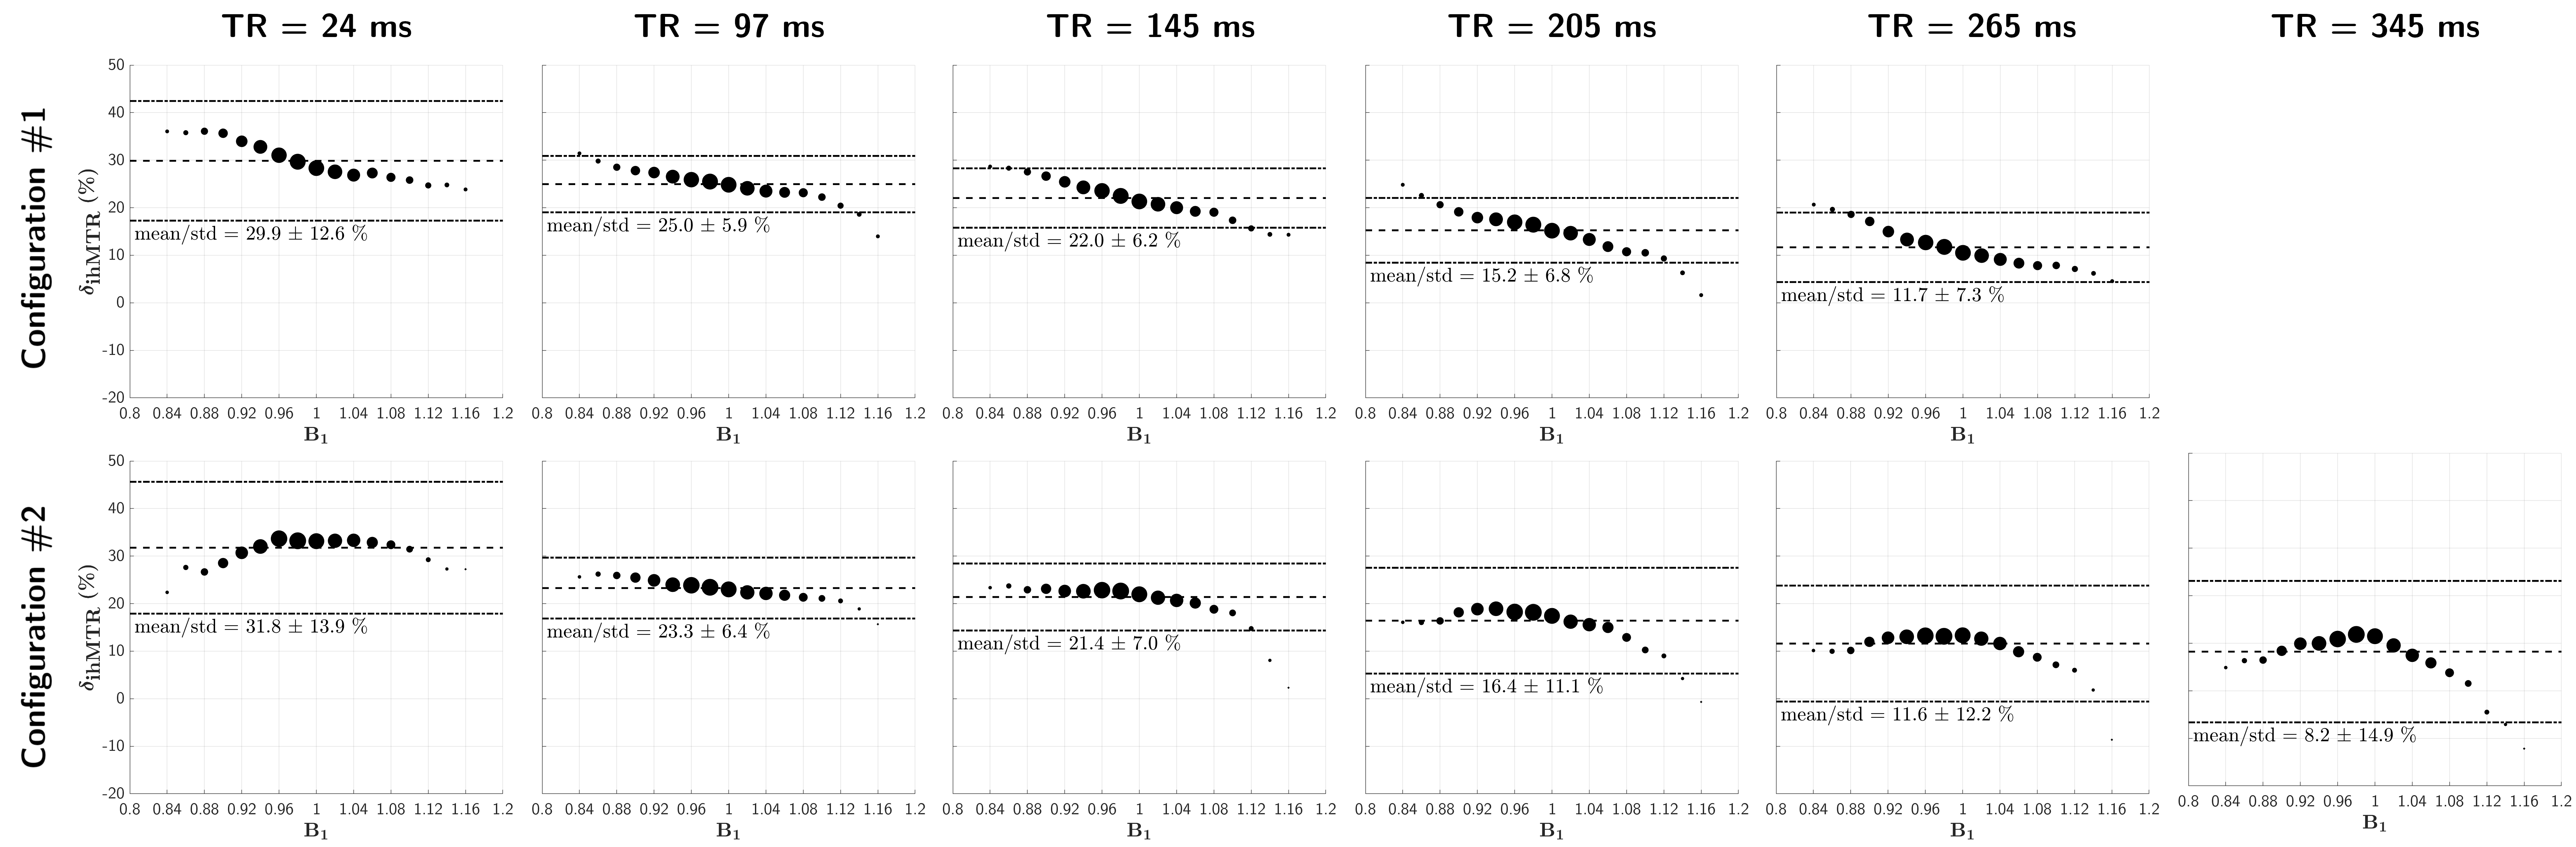
Representative images and metrics pertaining to the whole WM area are reported in Figure 2. Overall the highest average ihMTR were obtained in both configurations for an intermediate TR of 145 ms. Regarding immunity to B1+ variations the best scores (minimal bias: lowest δihMTR and δihMTR-RMS, highest δihMTR-[-10%;10%]) were unambiguously obtained at TR=265 ms for Configuration #1. For Configuration #2, the best settings lie in the range 265-ms ≤ TR ≤ 345-ms depending on the considered figure of merit. Of interest, the B1+-clustered data analysis, shown in Figure 3 for the absolute ihMTR measured at Vref and on Figure 4 for δihMTR, is generally consistent with the simulation behaviours from Figure 1: short TRs leading to quasi-linear increase of ihMTR with B1+ in the tested range, and associated with a high B1+-induced bias, and long TRs leading to a bell-shaped dependency of ihMTR with B1+, associated with minimal B1+-induced bias.Discussion and conclusion
Sensitivity of ihMTR with B1+ variations has been investigated experimentally and agrees well with theoretical expectations. From the simulations presented in Figure 1, it can indeed be qualitatively understood that RF energy concentration should reduce the sensitivity to B1+. Noteworthy the bell-shaped curve obtained in the more concentrated case explains that δihMTR may change sign (getting negative) in areas of strong B1+, consistent with the cluster analysis displayed in Figure 4 (Configuration #2).This study indicates that it is not possible to cancel the B1+ induced bias in all voxels simultaneously with the proposed approach, suggesting that the fraction of voxels within acceptable error margins or the mean root-mean-square error should be better indicators of the overall performance of ihMTR than the more usual mean ihMTR relative variation. Noteworthy, the settings the most robust to B1+ variations do not provide the highest average ihMTR values. A tradeoff is therefore to be made between high ihMTR and reduced sensitivity to B1+ inhomogeneities.
Acknowledgements
This work was supported by the SATT Sud-Est (France), the French Association pour la Recherche sur la Sclérose En Plaques (ARSEP), Roche Research Foundation (Switzerland) and French National Research Agency, ANR [ANR‐17‐CE18‐0030]. This work was performed by a laboratory member of France Life Imaging network (grant ANR-11-INBS-0006).References
1. Van Obberghen E, Mchinda S, le Troter A, et al. Evaluation of the Sensitivity of Inhomogeneous Magnetization Transfer (ihMT) MRI for Multiple Sclerosis. Am. J. Neuroradiol. 2018;39:634–641 doi: 10.3174/ajnr.A5563 SMASH.
2. Duhamel G, Prevost VH, Cayre M, et al. Validating the sensitivity of inhomogeneous magnetization transfer (ihMT) MRI to myelin with fluorescence microscopy. Neuroimage 2019;199:289–303 doi: 10.1016/j.neuroimage.2019.05.061 SMASH.
3. Mchinda S, Varma G, Prevost VH, et al. Whole brain inhomogeneous magnetization transfer (ihMT) imaging: Sensitivity enhancement within a steady-state gradient echo sequence. Magn. Reson. Med. 2018;79:2607–2619 doi: 10.1002/mrm.26907 SMASH.
4. Mchinda S, Varma G, Draveny R, et al. Whole brain inhomogeneous Magnetization Transfer (ihMT) imaging at 3T: concentrating RF power to mitigate RF inhomogeneities effects. In: Proceedings 26th Scientific Meeting, International Society for Magnetic Resonance in Medicine. ; 2018. p. 786.
5. Dale AM, Fischl B, Sereno MI. Cortical Surface-Based Analysis. Neuroimage 1999;9:179–194 doi: 10.1006/nimg.1998.0395 SMASH.
Figures