3166
Quality assurance of multiparametric mri protocol for multi-centre prostate cancer sequential imaging clinical trial1Institute of Medical Physics, The University of Sydney, Camperdown, Australia, 2Ingham Institute for Applied Medical Research, Liverpool, Australia, 3Liverpool and Macarthur Cancer Therapy Centre, Liverpool Hospital, Liverpool, Australia, 4Radiation Oncology Department, Calvary Mater Newcastle, Newcastle, Australia
Synopsis
Inter-/intra-scanner differences contribute to uncertainties in results from multi-centre longitudinal imaging studies. The Sequential Imaging Biofocussed Radiotherapy (SI-BiRT) trial is a multi-centre longitudinal imaging clinical trial that aims to develop imaging biomarkers using mpMRI to predict radiation therapy response in prostate cancer. Here we quantify the inter-/intra-scanner variabilities in the mpMRI protocol and scanners used in the SI-BiRT trial using commercial phantoms. ADC measurements were highly accurate while VFA T1 mapping overestimated reference values. ADC and T1 showed high intra-scanner reproducibility while R2* showed higher variability. The quantified uncertainties will be considered when interpreting results from the SI-BiRT trial.
Introduction
Quantitative imaging using multiparametric MRI (mpMRI) has shown potential for providing non-invasive biomarkers for diagnosis, post-treatment monitoring and response prediction for prostate cancer (PCa). Previous studies have shown that mpMRI results are variable and their performance difficult to compare across centres.1-4 Differences between scanners and drifts of parameters in the same scanner contribute to uncertainties in the quantitative data and must be addressed to ensure comparability of imaging data across scanners and different time points. The goal of this study was to investigate the accuracy, short-term intra-scanner repeatability, and inter-scanner reproducibility of a mpMRI protocol that is optimised for the Sequential Imaging – Biofocussed Radiotherapy (SI-BiRT) trial for post-radiotherapy response monitoring for prostate cancer.Methods
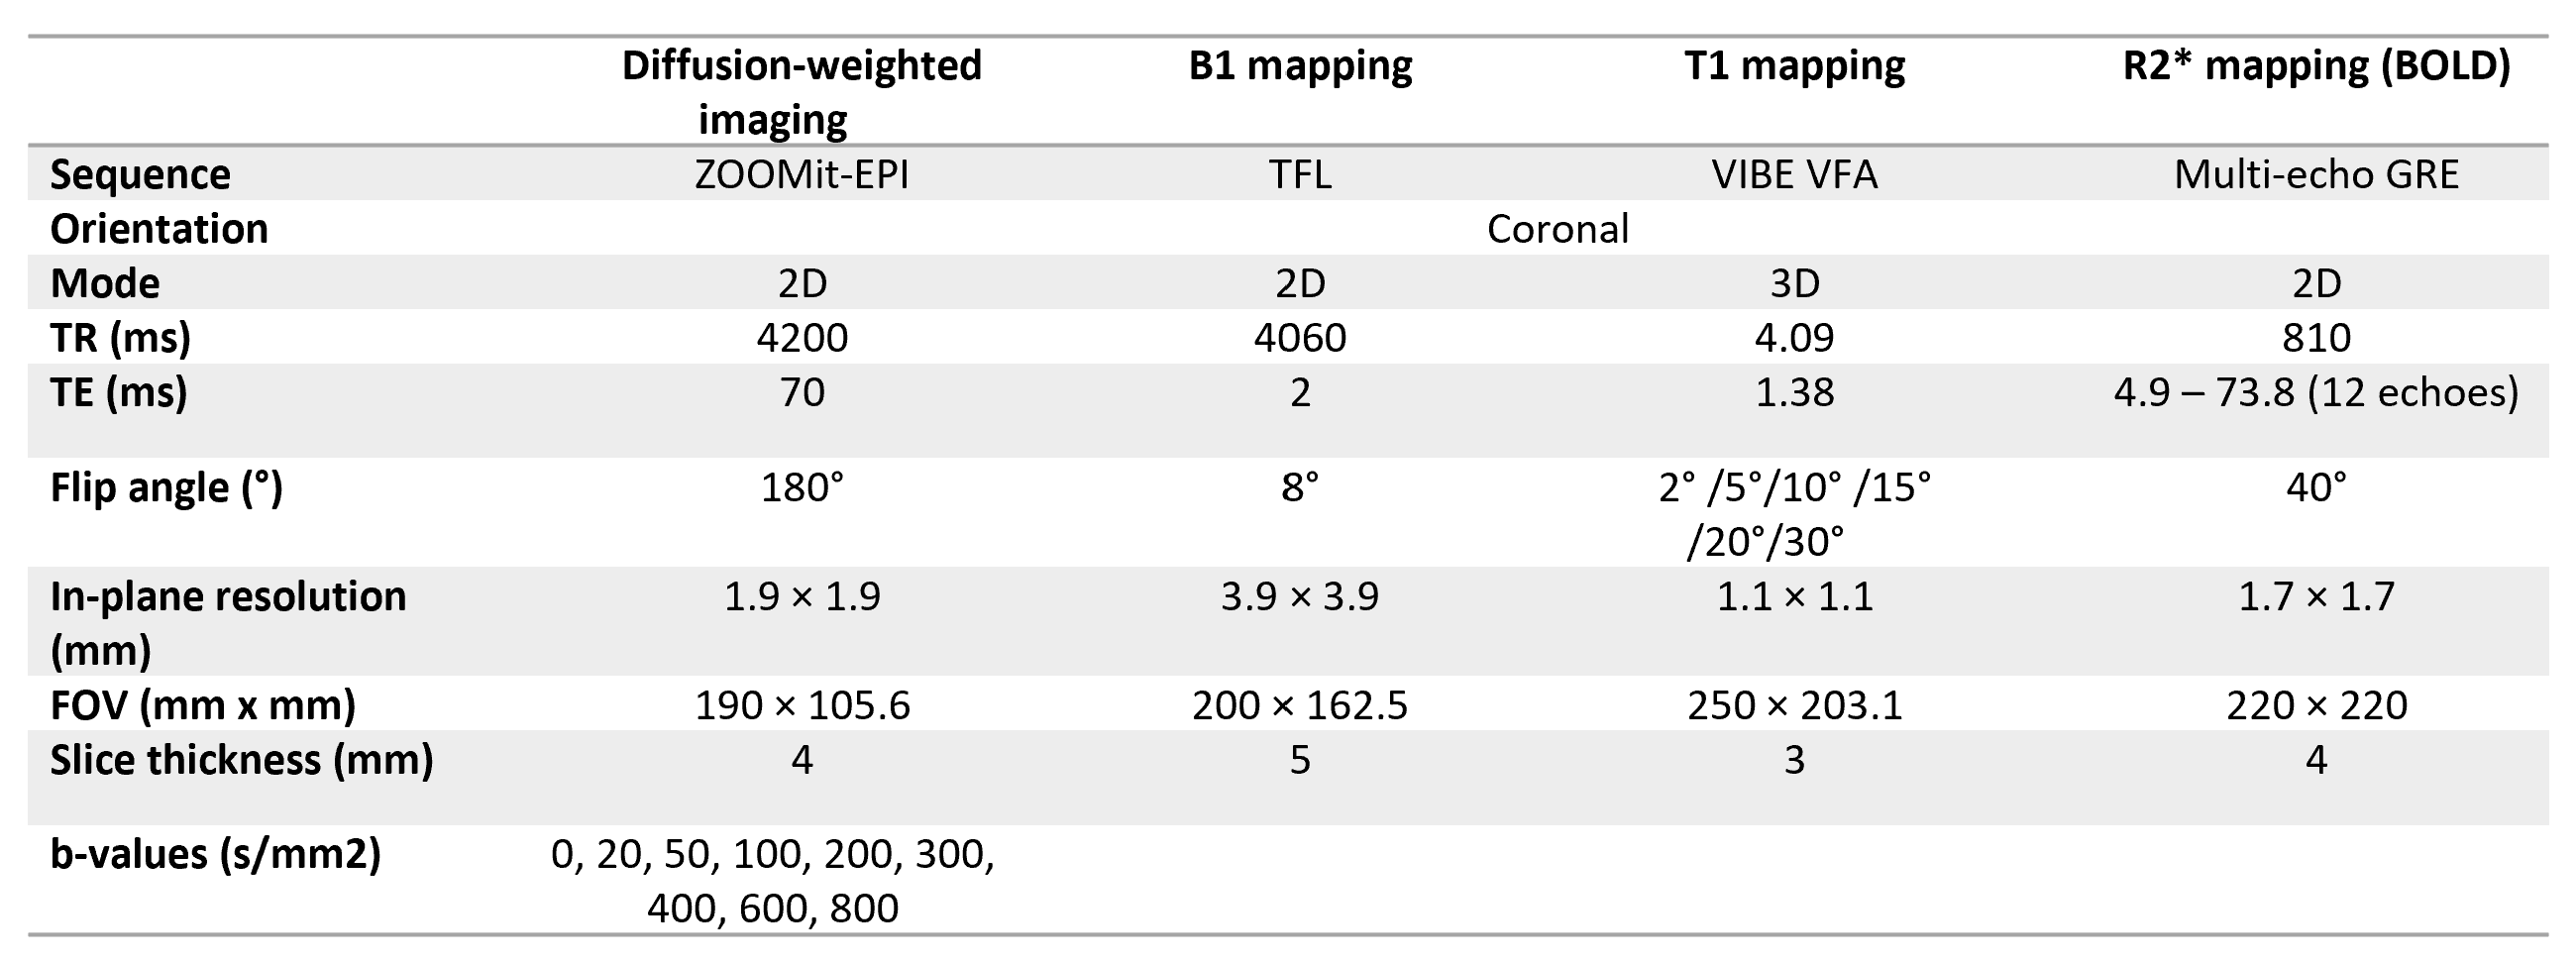
The mpMRI protocol consisted of diffusion weighted imaging, B1 mapping, T1 mapping and R2* mapping sequences. Imaging parameters are detailed in Table 1. mpMRI was performed on the Diffusion and System phantoms from the National Institute of Standards and Technology (NIST) in three 3T MR units (two MAGNETOM Skyra and one Prisma, Siemens, Erlangen, Germany). The sequences were repeated 5 times during each imaging session to evaluate short-term repeatability. The Systems phantom was placed at the centre of the scanner bore at least 8 hours prior to imaging to reach thermal equilibrium. The ice-water Diffusion phantom was prepared at least 8 hours prior to imaging and placed in the refrigerator to reach thermal equilibrium at 0oC. Parametric maps of ADC, T1 with and without B1 correction and R2* were calculated using the Syngo workstation (Siemens, Erlangen, Germany).Mean ADC were measured in samples in the inner ring of the Diffusion phantom with reference ADC values 403-1127 mm2/s. Mean T1 values were extracted from samples in the T1 array of the System phantom with reference values of 89-1989 ms and mean R2* values were obtained in all samples in the T2 array. Bland-Altman plots were used to compare measured values with known NIST reference values. Limits of agreement were calculated as the 95% CI on the mean difference.Errors in accuracy of the measurements was calculated as the percentage absolute deviation from the reference values. Accuracy of T1 values with and without B1 correction were compared using a paired t-test at 95% significance level.
Intra-session repeatability on each scanner and inter-scanner reproducibility were assessed using the coefficient of variation (COV) in the measurements as
$$ COV \left(\%\right)=\frac{Standard\,Deviation}{Mean}\times100$$
Reproducibility was also assessed using the intra-class correlation coefficient (ICC).
Results
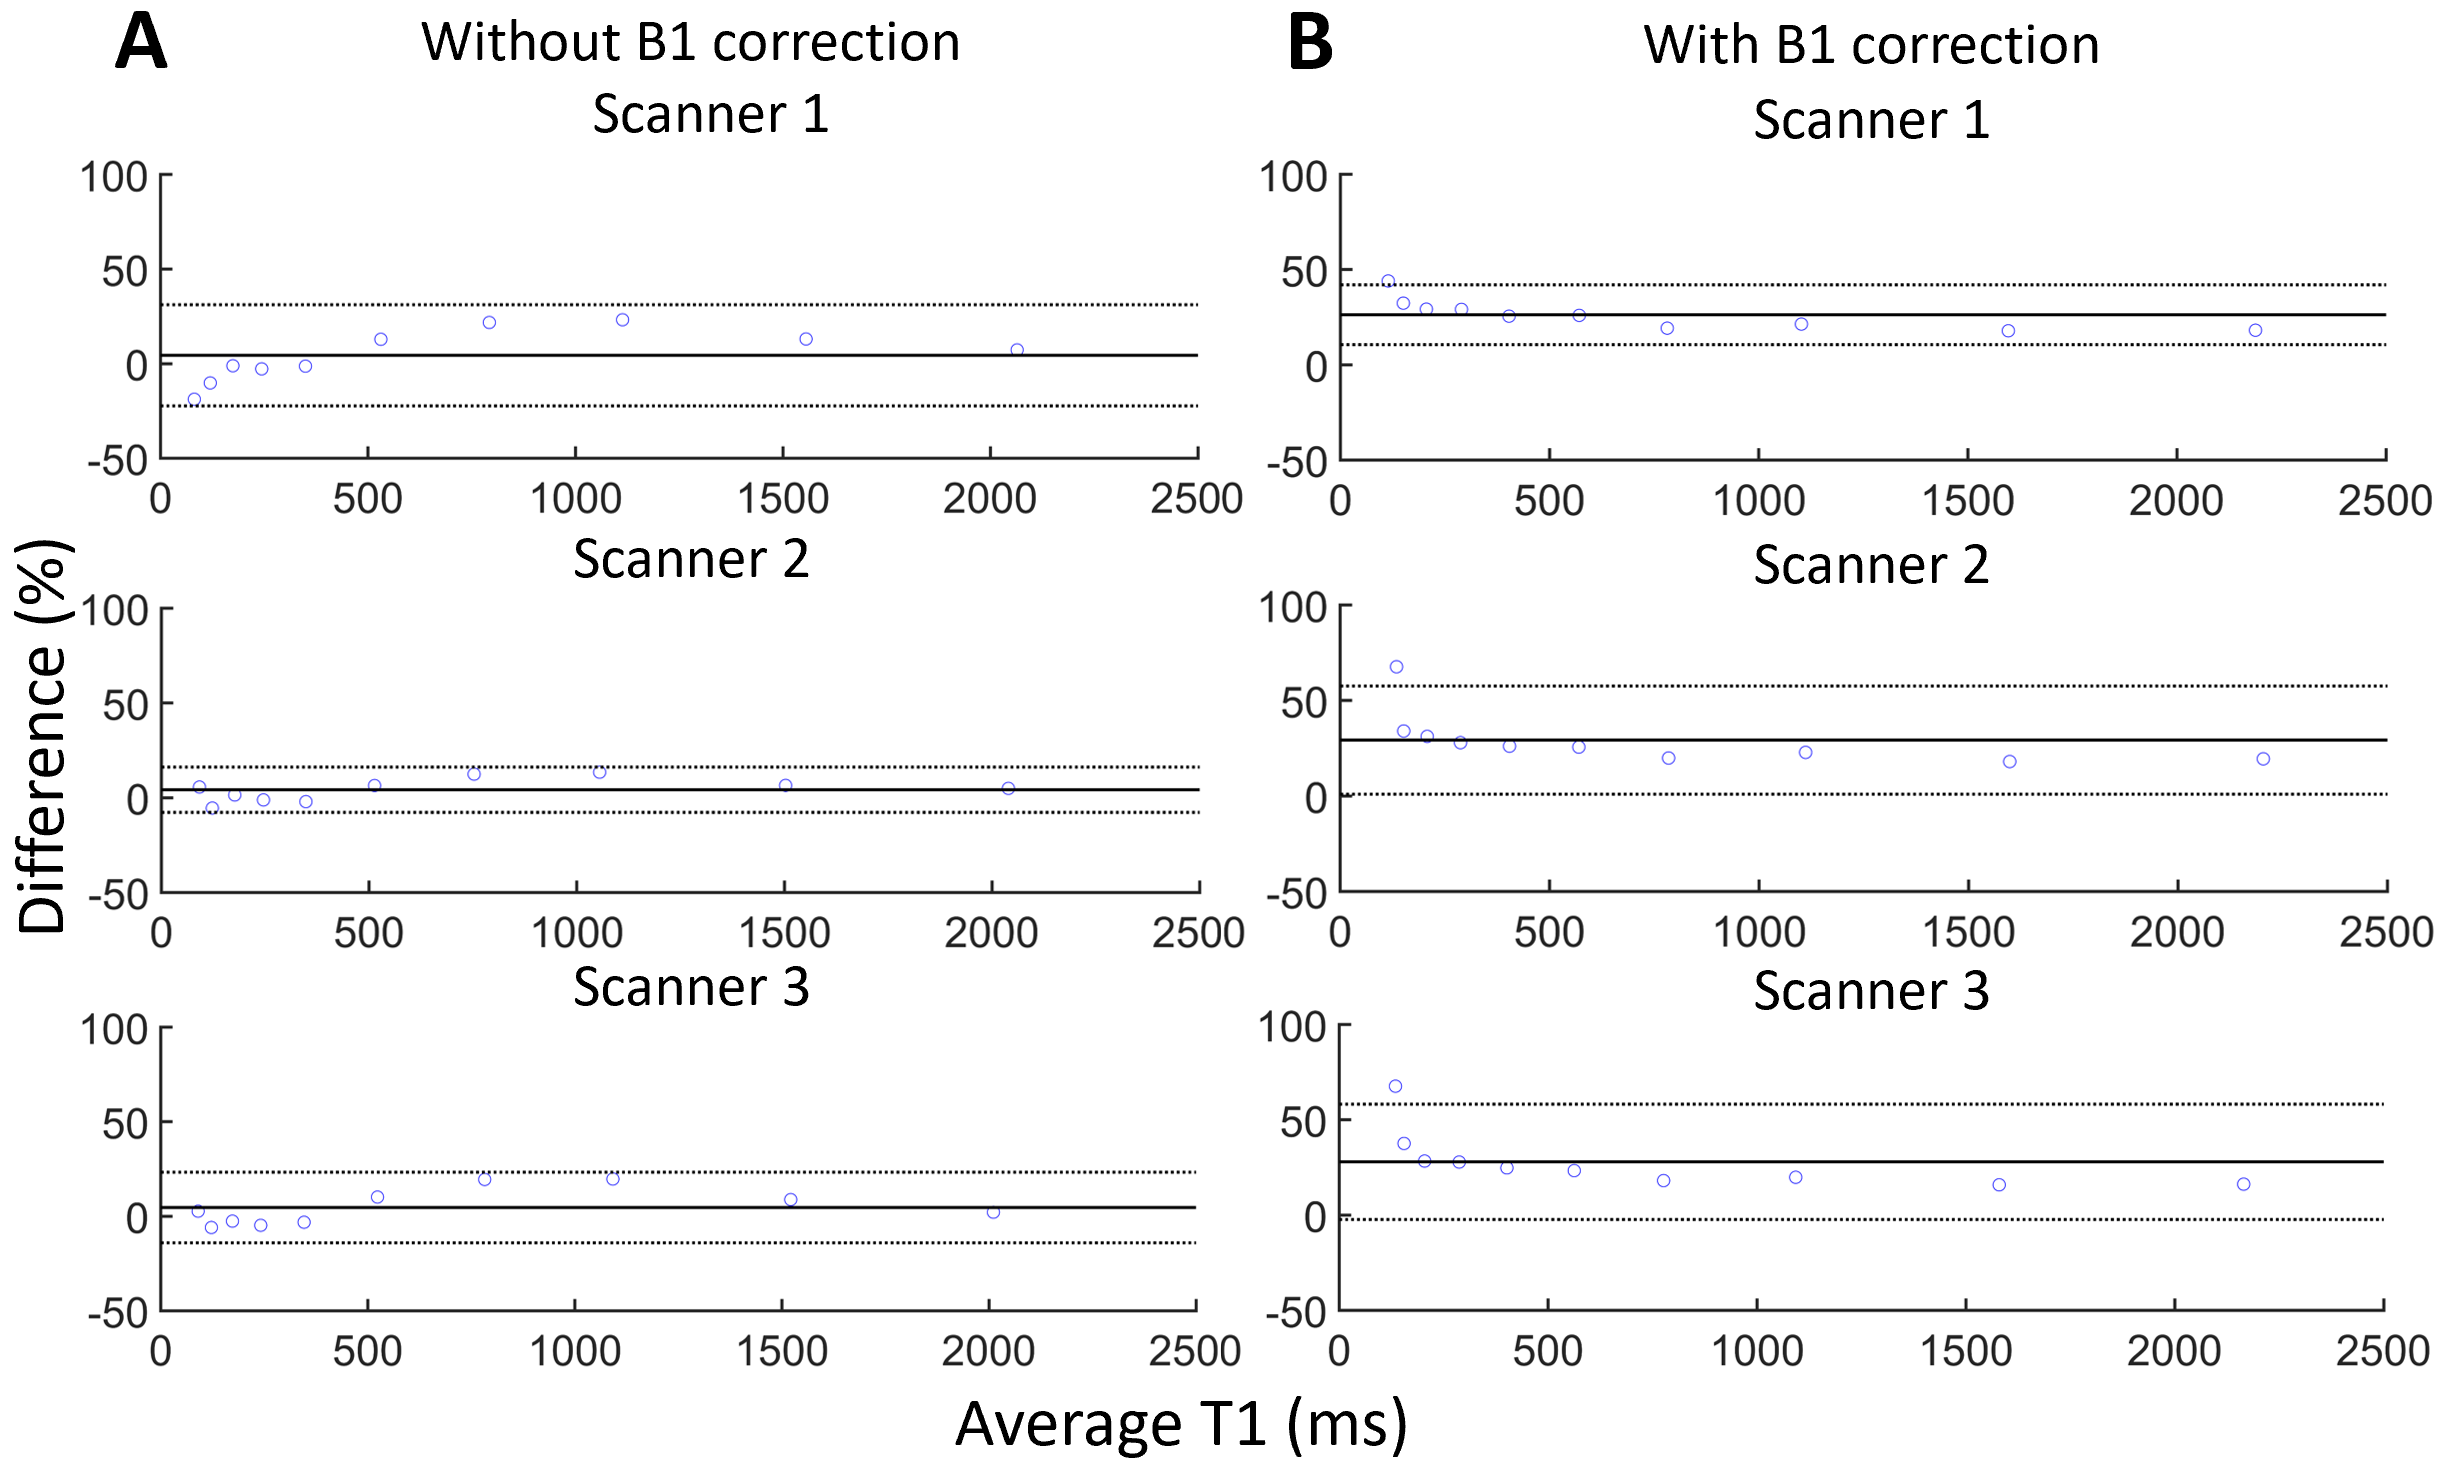
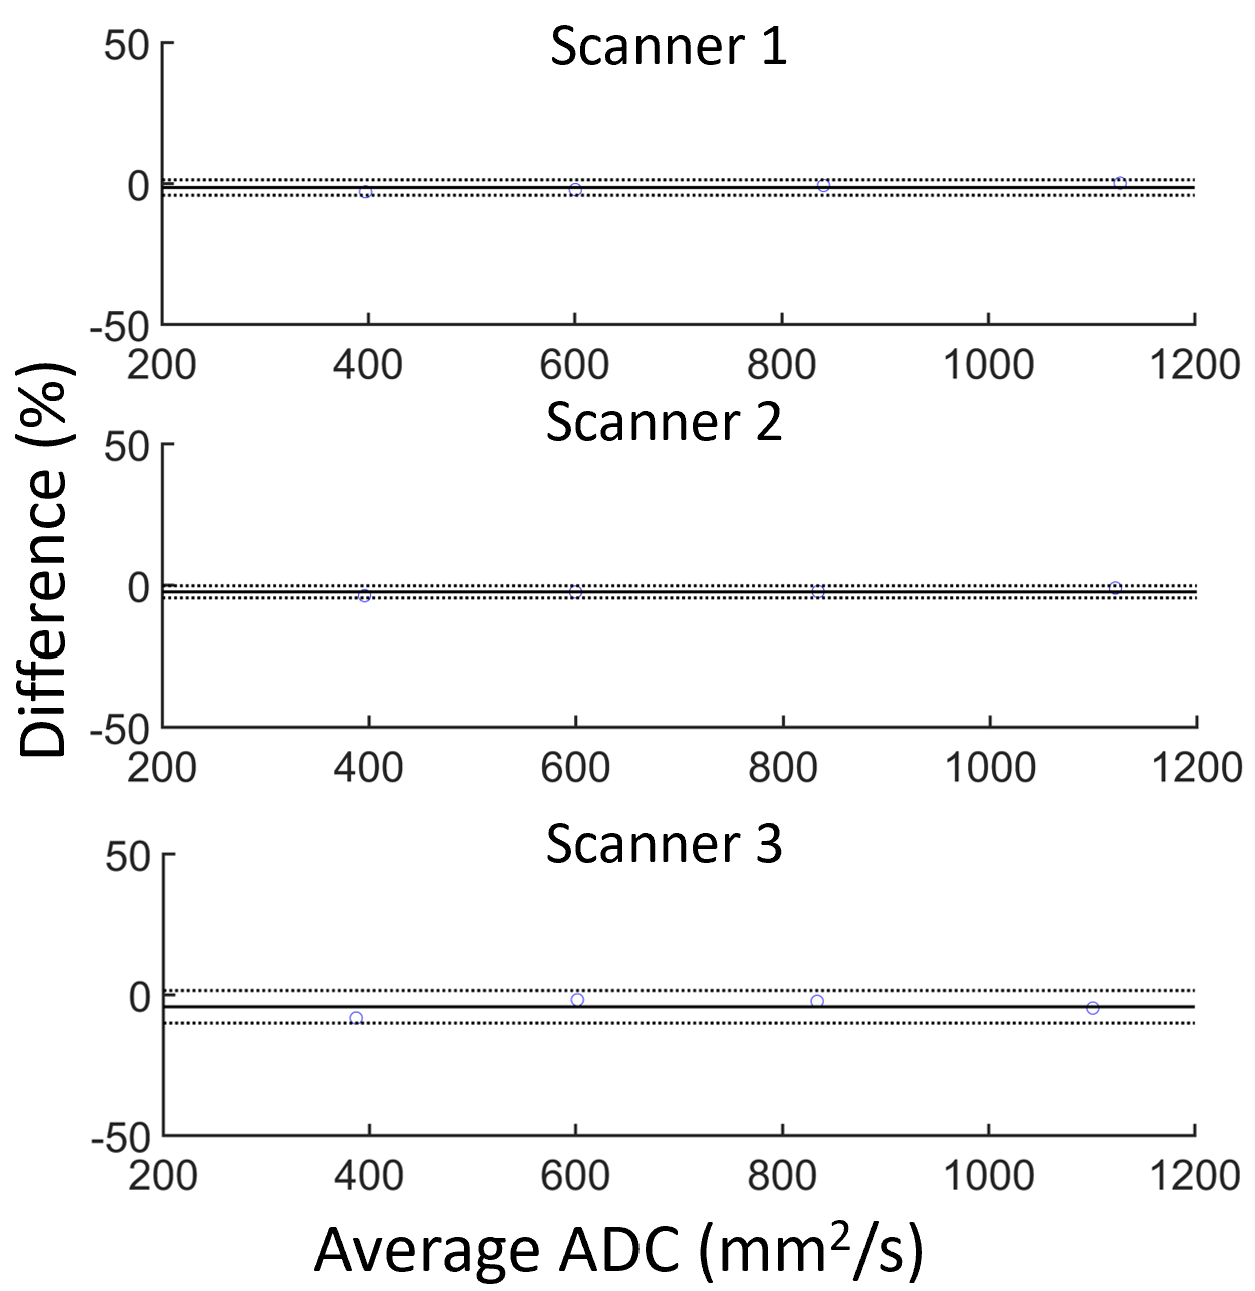
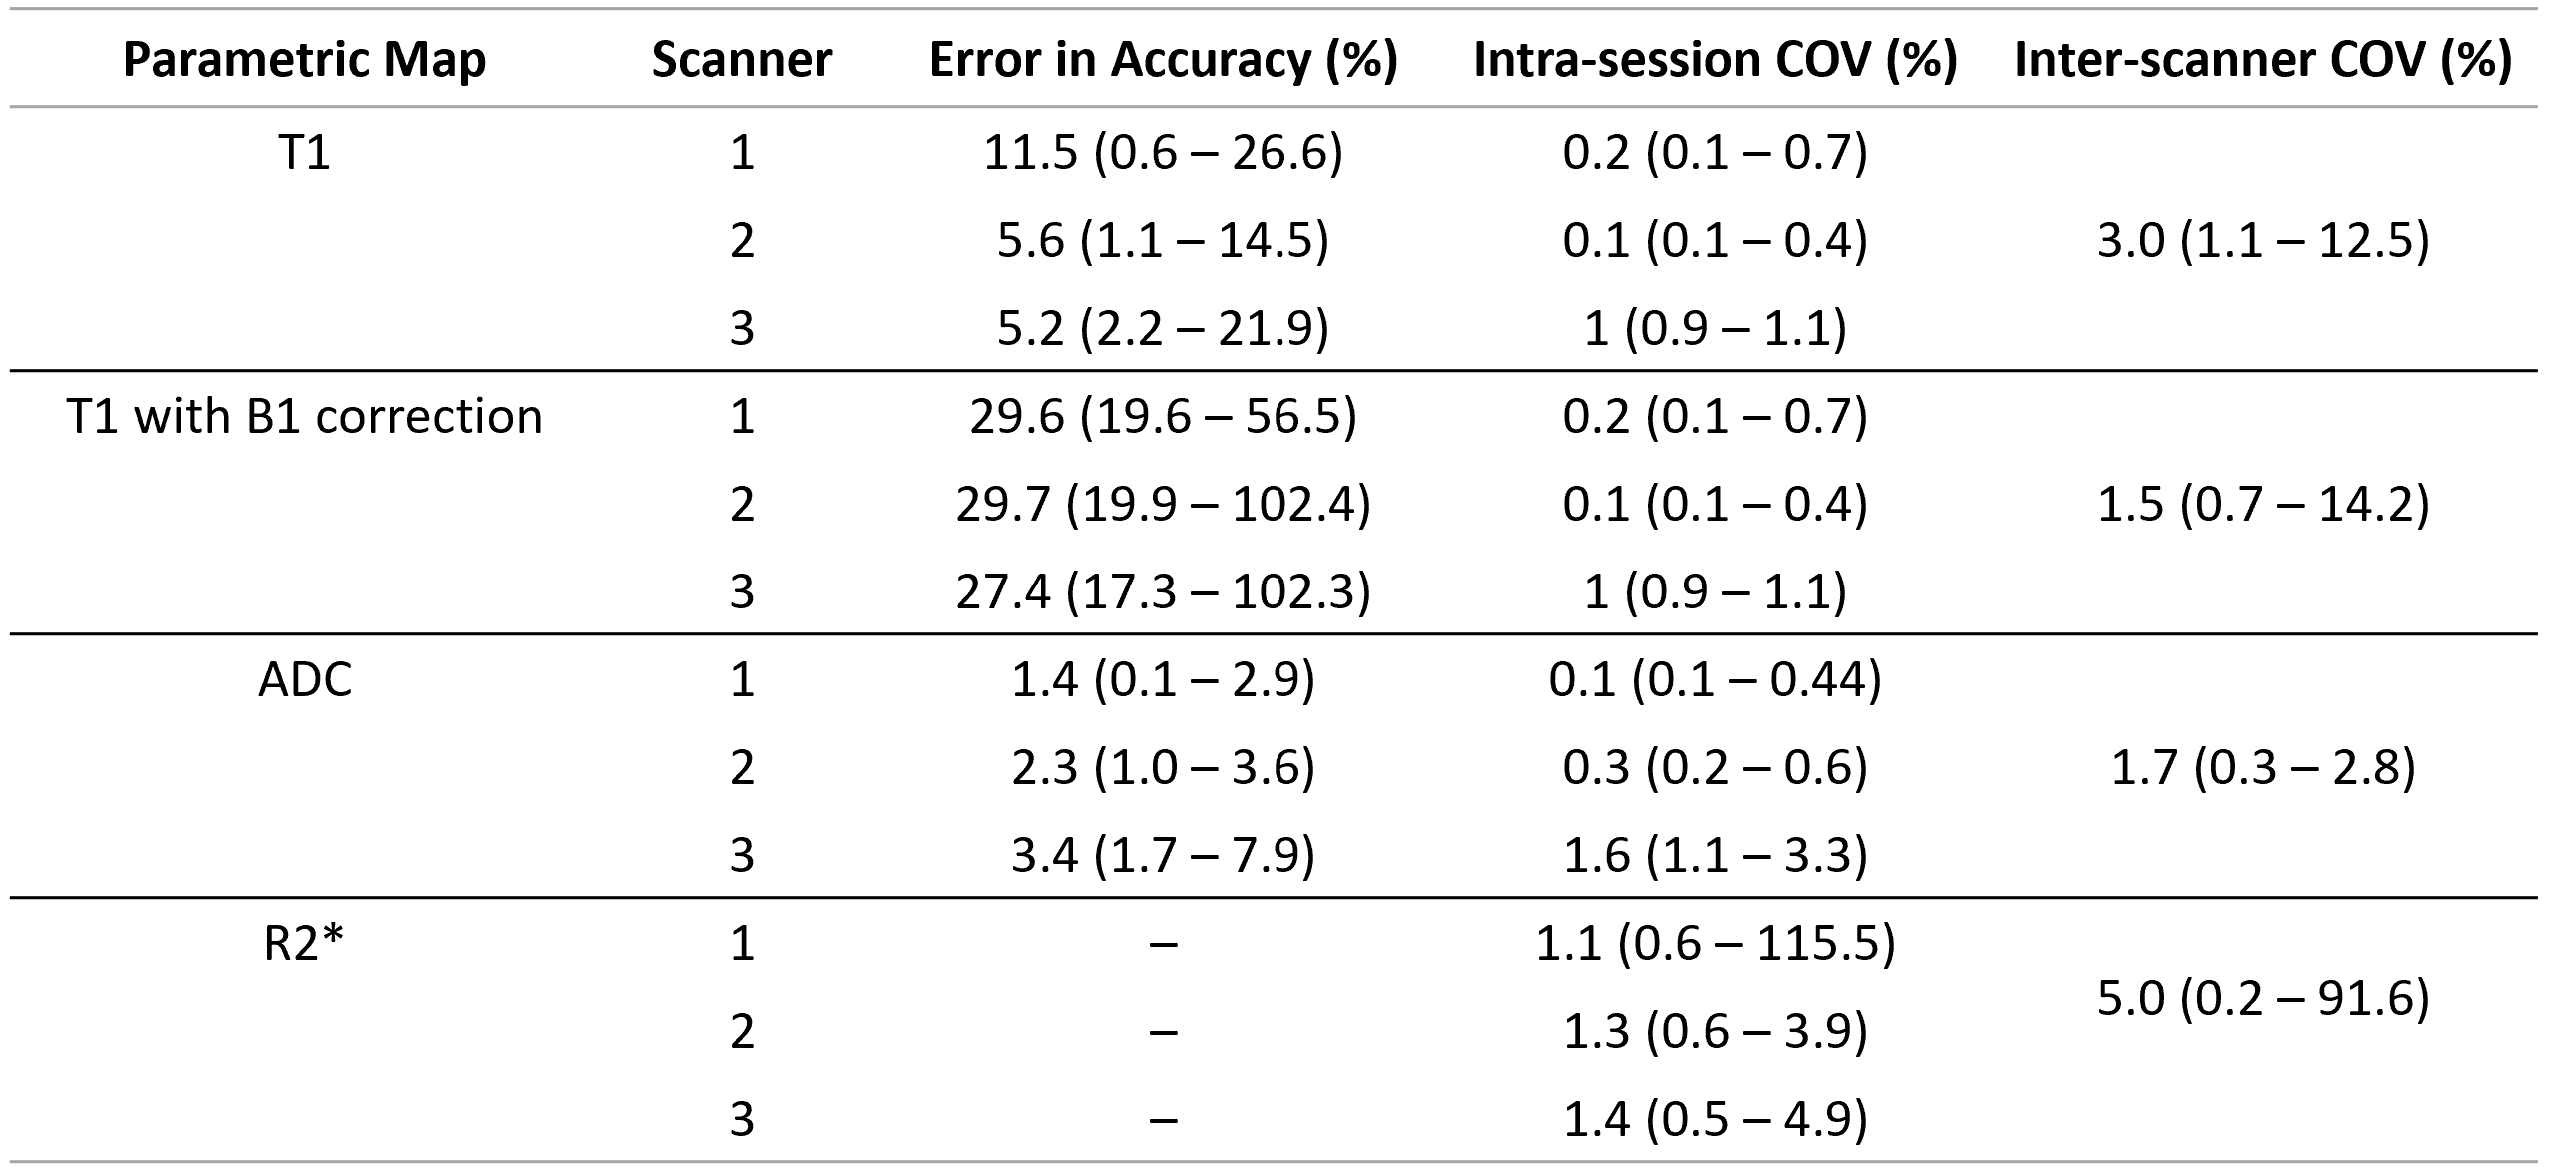
Figure 1 shows Bland-Altman plots comparing ADC, T1 with and without B1 correction and R2* values. Bias and the limits of agreement are indicated. Median and range of errors are given in Table 2. Errors in ADC and T1 measurements were within the limits of agreement for the measured samples on all scanners, except at the lowest B1-corrected T1. With B1 correction, there was also a broadening of the 95% CI and a significant increase (p<<0.025, one-sided) in % errors when compared to uncorrected values. However, B1 correction resulted in more uniform errors, independent of T1. As shown in Table 2, errors in T1 values are more consistent between scanners after B1 correction.Median and range of intra-session repeatability for each parameter on the three scanners are given in Table 2. All parameters showed high repeatability on all scanners, except for a single outlier in R2* measurements in the sample with the lowest expected value.
Median and range of inter-scanner reproducibility for each parameter are given in Table 2. ICC>0.99 for all parameters. ADC measurements showed highest inter-scanner reproducibility, while R2* measurements had highest variability. In both B1-corrected and uncorrected T1 measurements, the sample with lowest T1 had lowest reproducibility. B1-corrected T1 showed higher reproducibility compared to without B1 correction in all samples except the lowest T1.
Discussion
The mpMRI protocol optimised for the SI-BiRT clinical trial showed high intra-session repeatability and inter-scanner reproducibility. The ADC maps were highly accurate and reproducible across all scanners, which agrees with published literature findings.5 Overestimation of T1 values in both T1 maps with and without B1 correction was consistent with published literature,6 and is a known consequence of the variable flip angle method.7, 8 While there is an indication that B1 correction results in a slight increase in accuracy errors, it greatly improves the inter-scanner reproducibility in the measured T1 values as shown in Table 2. The use of B1 correction in multi-centre study may be beneficial as the higher inter-scanner reproducibility ensures the results can be compared across different sites. For applications where high accuracy of T1 maps are required, for example pharmacokinetic modelling of dynamic contrast enhanced imaging, a calibration curve could be used to correct for the overestimation of T1 values.Conclusion
An mpMRI protocol optimised for sequential prostate cancer imaging was evaluated on three scanners for accuracy, short-term intra-scanner repeatability, and inter-scanner reproducibility using two commercial phantoms with known ADC and T1 values. The quantified uncertainties will be used in the assessment of mpMRI signal changes in post-radiotherapy PCa in the SI-BiRT trial. Future work will focus on assessing the long-term repeatability and reproducibility of the mpMRI protocol to monitor and assess treatment response for PCa.Acknowledgements
This work was supported by funding from the National Health and Medical Research Council (NHMRC Project Grant 1126955). The T1 mapping prototype sequence, Improved VIBE, was provided by Siemens, Erlangen, Germany. The NIST phantoms were kindly provided by the Calvary Mater Newcastle.References
1. Bane O, Hectors SJ, Wagner M, Arlinghaus LL, Aryal MP, Cao Y, et al. Accuracy, repeatability, and interplatform reproducibility of T1 quantification methods used for DCE-MRI: Results from a multicenter phantom study. Magnetic resonance in medicine. 2018;79(5):2564-75.
2. Alonzi R, Taylor NJ, Stirling JJ, d'Arcy JA, Collins DJ, Saunders MI, et al. Reproducibility and correlation between quantitative and semiquantitative dynamic and intrinsic susceptibility-weighted MRI parameters in the benign and malignant human prostate. Journal of Magnetic Resonance Imaging. 2010;32(1):155-64.
3. Spick C, Bickel H, Pinker K, Bernathova M, Kapetas P, Woitek R, et al. Diffusion‐weighted MRI of breast lesions: a prospective clinical investigation of the quantitative imaging biomarker characteristics of reproducibility, repeatability, and diagnostic accuracy. NMR in Biomedicine. 2016;29(10):1445-53.
4. Deng J, Wang Y. Quantitative magnetic resonance imaging biomarkers in oncological clinical trials: Current techniques and standardization challenges. Chronic Diseases and Translational Medicine. 2017;3(1):8-20.
5. Grech‐Sollars M, Hales PW, Miyazaki K, Raschke F, Rodriguez D, Wilson M, et al. Multi‐centre reproducibility of diffusion MRI parameters for clinical sequences in the brain. NMR in Biomedicine. 2015;28(4):468-85.
6. Chang LC, Koay CG, Basser PJ, Pierpaoli C. Linear least‐squares method for unbiased estimation of T1 from SPGR signals. Magnetic resonance in medicine. 2008;60(2):496-501.
7. Ou X, Gochberg DF. MT effects and T1 quantification in single‐slice spoiled gradient echo imaging. Magnetic resonance in medicine. 2008;59(4):835-45.
8. Stikov N, Boudreau M, Levesque IR, Tardif CL, Barral JK, Pike GB. On the accuracy of T1 mapping: Searching for common ground. Magnetic resonance in medicine. 2015;73(2):514-22.
Figures