3165
A stability study of breath-hold and free-breathing liver fat and R2* quantification at 1.5T and 3T1Department of Radiological Sciences, David Geffen School of Medicine, University of California, Los Angeles, CA, United States, 2Physics and Biology in Medicine Inter-departmental Graduate Program, David Geffen School of Medicine, University of California, Los Angeles, CA, United States, 3MR R&D Collaborations, Siemens Healthcare, Los Angeles, CA, United States, 4MR Training, Siemens Healthcare, Cary, NC, United States, 5MR Application Development, Siemens Healthcare GmbH, Erlangen, Germany, 6MR R&D Collaborations, Siemens Healthcare, Austin, TX, United States
Synopsis
Accurate quantification of proton-density fat fraction (PDFF) and R2* requires appropriate compensation of various confounding factors. A stability study was performed to investigate the impacts of different protocols and imaging parameters using both breath-hold Cartesian and free breathing radial sequences on a standardized phantom and a group of 5 same normal subjects at both 1.5T and 3T. This study revealed that flip angle, TE mode and coil usage were important protocol parameters to investigate further in larger patient population.
INTRODUCTION
Accurate proton-density fat fraction (PDFF) and R2* quantification typically requires simultaneous measurement of these two biomarkers and appropriate compensation of various confounding factors.1-5 Liver PDFF and R2* quantification is commonly based on breath-hold multi-echo gradient-echo acquisitions with the Cartesian sampling. Recently, the stack-of-radial sampling was demonstrated to be more robust to motion6 and validated for free-breathing fat quantification7 and R2* quantification.8,9 Moreover, standardized phantoms became commercially available for fat and R2* quantification.10In this work, we performed a preliminary study to evaluate the stability of fat and R2* quantification using both breath-hold Cartesian and free-breathing stack-of-radial sequences on a standardized phantom and a group of the same normal subjects at both 1.5T and 3T.
METHODS
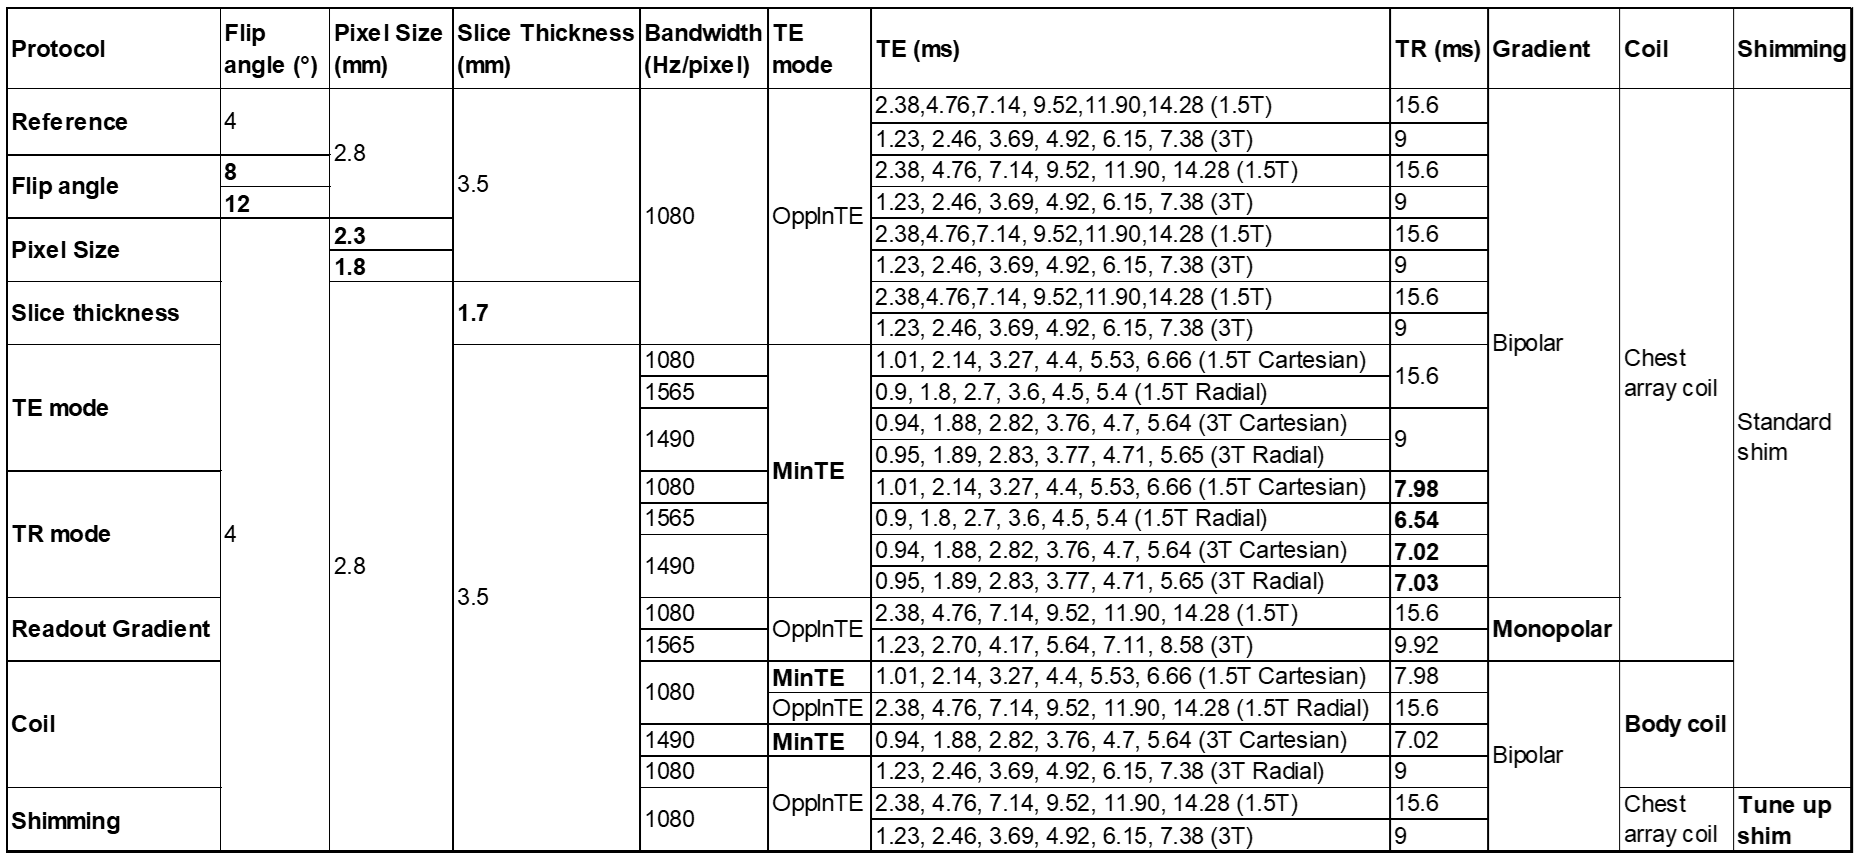
Imaging Sequences and ProtocolsA free-breathing multi-echo stack-of-radial prototype sequence with gradient delay correction and self-gating motion compensation was utilized.8,9 A breath-hold Cartesian prototype sequence was performed as a reference standard.11 Imaging protocols and parameters are shown in Table 1. Raw data of all acquisitions were saved and reconstructed offline using the prototype reconstruction program of these sequences.8,9,11
Phantom Validation
A standardized PDFF/R2* phantom (Calimetrix, Madison, Wisconsin, USA) was scanned on a 1.5T and a 3T scanner (MAGNETOM AvantoFit and Prisma, respectively, Siemens Healthcare, Erlangen, Germany) at the scanner room temperature with the anterior 18‐channel flexible array and the table‐mounted spine array. The phantom consists of 7 cylindrical glass vials and the other 8 vials presenting varying ranges of R2* and PDFF values, respectively.
PDFF and R2* were fitted using a fat spectrum modeling adjusted according to the manufacturer suggestion.10 For regions with very high iron concentrations (>500 s-1), R2* was calculated using an automatic algorithm of mono-exponential fitting without considering fat. PDFF or R2* values were measured as mean ± standard deviation (SD) within the circular regions of interest (ROIs) placed inside the vials.
In-vivo Validation
In vivo study was approved by the Institutional Review Board with written informed consent obtained from each subject. A group of the same 5 normal subjects were scanned using the same 1.5T and 3T scanners and coils as in the phantom experiment.
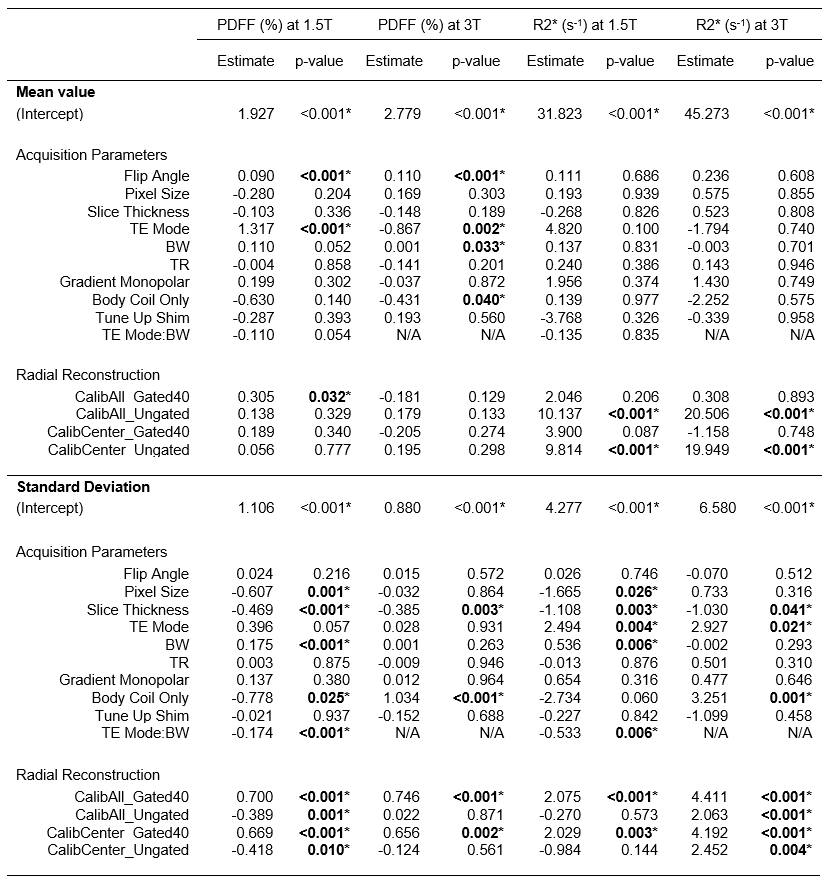
The mean and SD of PDFF and R2* were measured by placing one ROI on one mid-liver slice and avoiding large hepatic vessels and severe imaging artifacts. Linear mixed-effects modeling was performed using R 3.5.112 and the lme4 package13 for statistical analysis. Data were grouped by field strength. Clustering effects were addressed by treating the volunteer as a random effect. The fixed effects included all variables in Table 1 as main effects, and an interaction between bandwidth and TE mode. The dependent variables were PDFF mean, PDFF SD, R2* mean and R2* SD.
RESULTS AND DISCUSSION
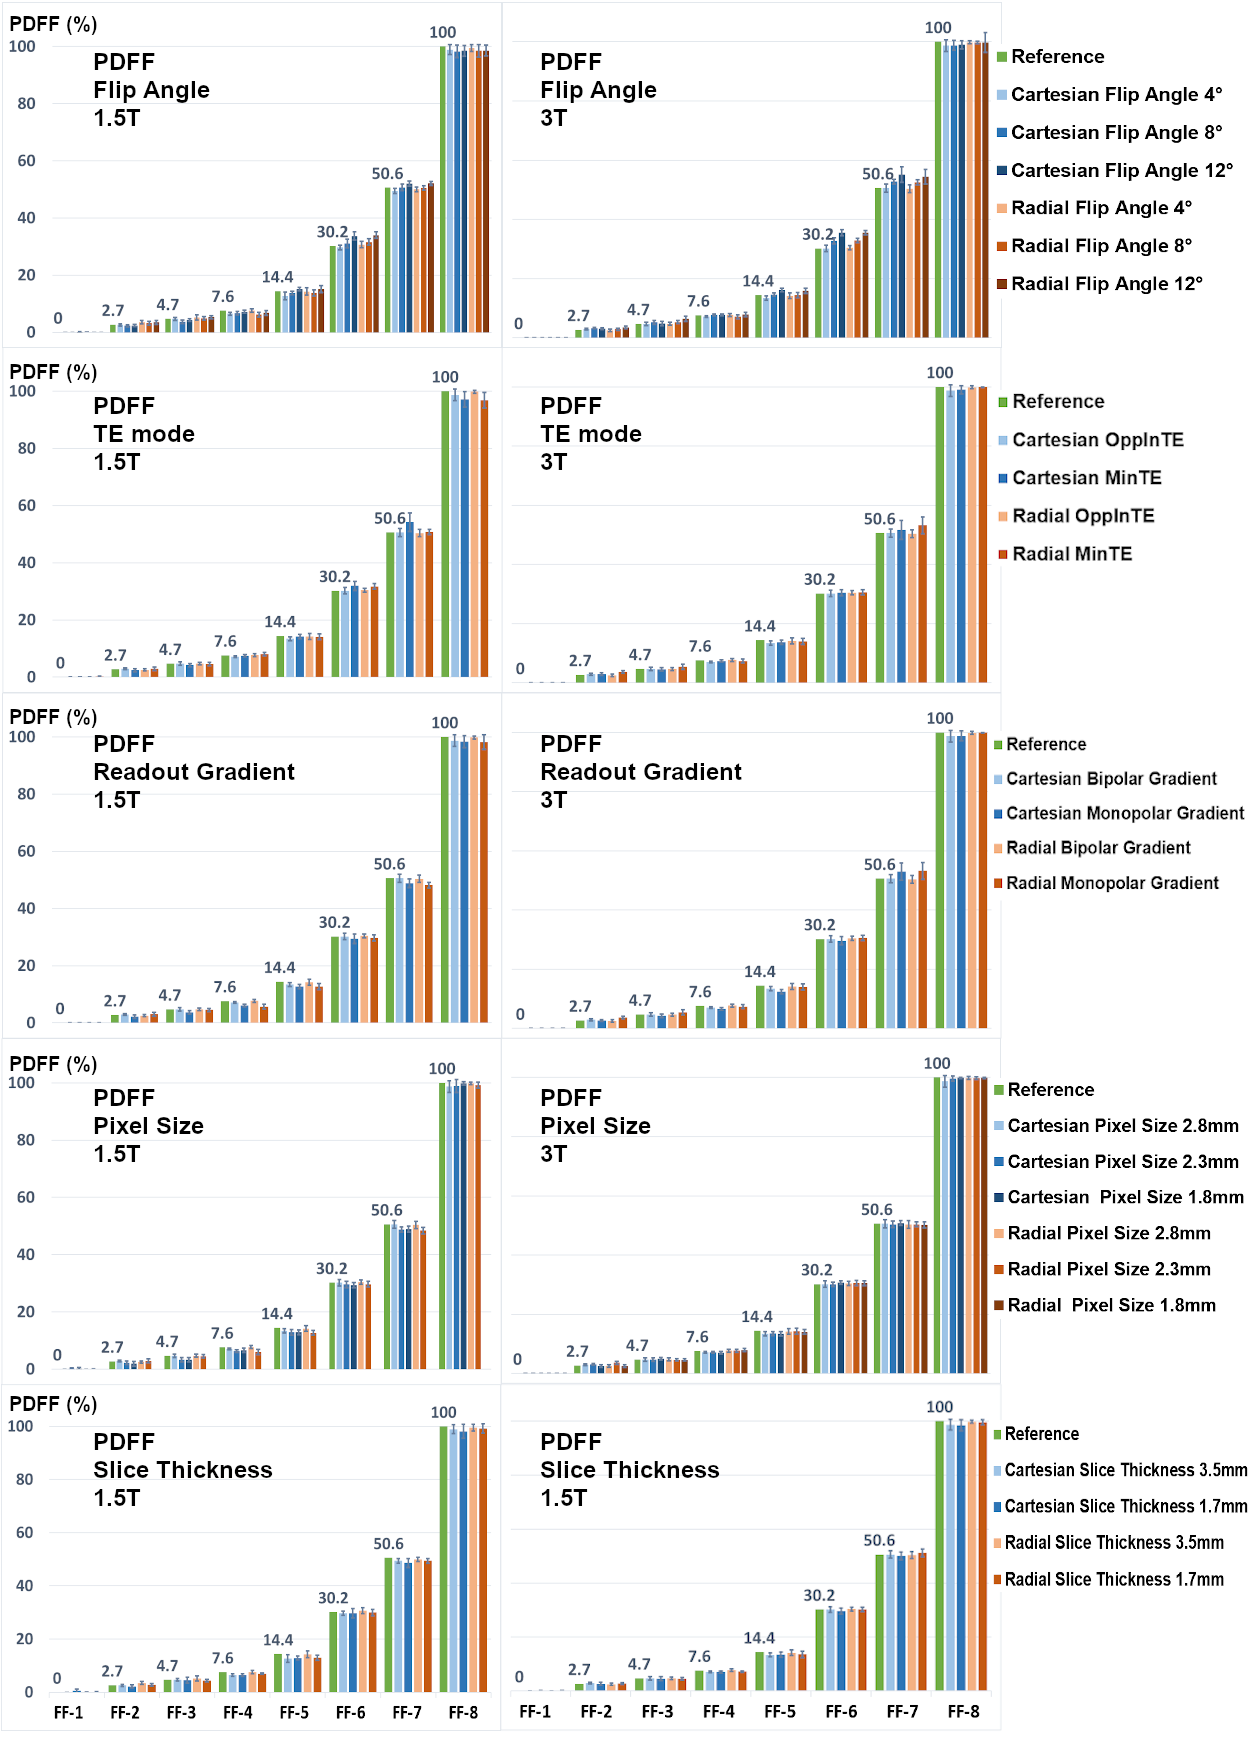
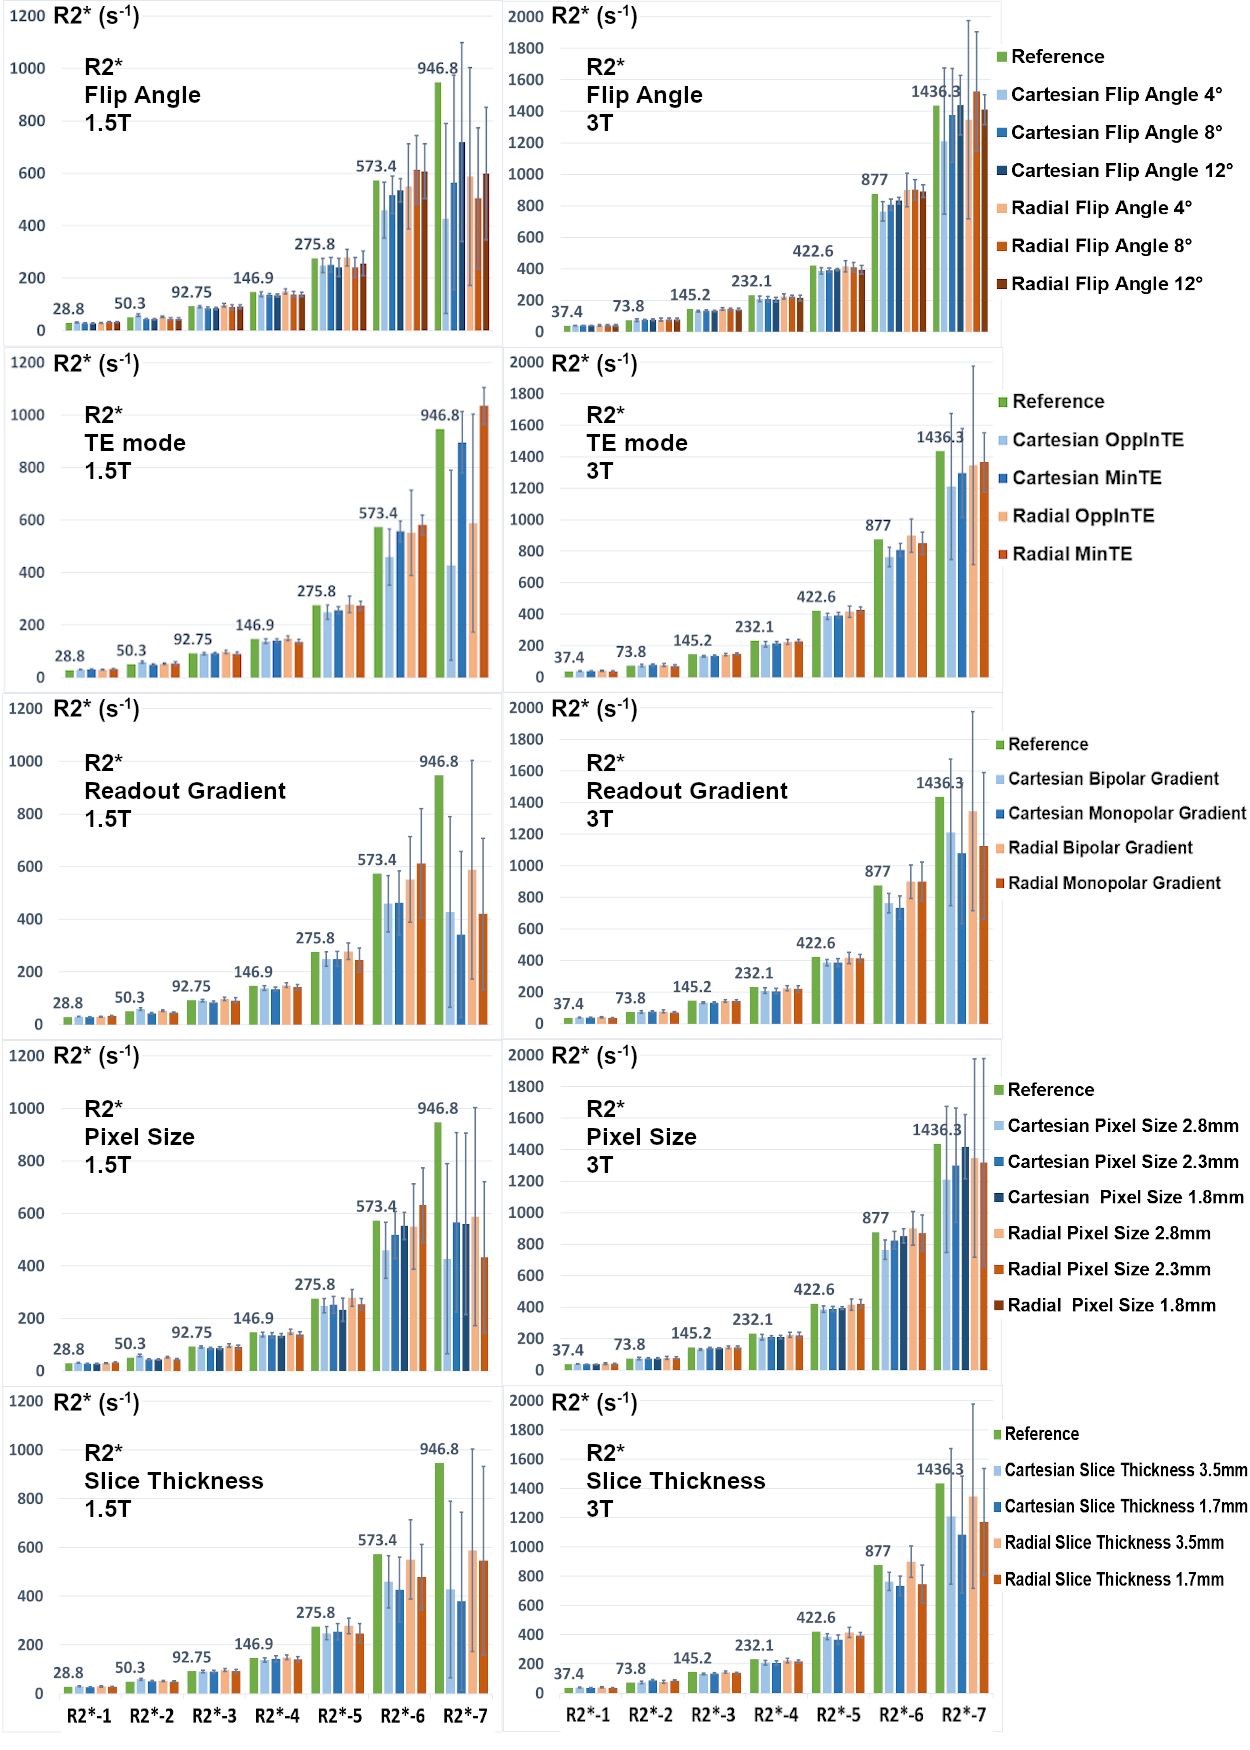
Figures 1 and 2 show PDFF and R2* results of the phantom, respectively. Measured PDFF values of all different conditions were consistent with the reference values. Measured R2* values were also consistent with the reference, except some underestimated values of the vials with high iron concentrations. The R2* values of MinTE protocols tended to match the reference values more closely, mostly due to the SNR.Statistical analysis of the in-vivo results is shown in Table 2. Flip angle did not impact R2*, but introduced T1 biases into PDFF results, consistent with previous findings.14 Pixel size and slice thickness did not affect PDFF or R2* mean; however, larger voxels were associated with lower SD, mostly attributed to SNR. Using MinTE instead of OppInTE showed biases in PDFF mean and R2* SD. Bandwidth had minimal impact on PDFF or R2* mean, but showed influences on PDFF and R2* SDs at 1.5 T. Gradient mode exhibited no obvious impacts, nor did shimming, likely because the quantification methods in this study had more magnitude-fitting characteristics.8,9,11 Using only the body coil reduced PDFF mean at 3T with a low significance, but increased R2* SD particularly at 3T. The acquisition and reconstruction modes had little impact on PDFF, but had strong impacts on R2*. Specifically, Ungated radial reconstruction introduced positive biases (relative to Cartesian) in R2* mean at both field strengths, and Gated40 radial reconstruction corrected those biases. All radial sequences and reconstructions tended to impact PDFF and R2* SDs, likely due to noise or streaking artifacts. Generally, it is recommended to use either a breath-hold Cartesian or a gated free-breathing radial acquisition with the OppInTE mode.
One limitation of this study is the relatively small PDFF and R2* ranges of the in-vivo subjects. Due to the scan time limit, the protocol of this study cannot be directly applied on clinical patients. However, this preliminary study revealed factors which pose significant influences on PDFF and R2* quantification, such as the TE mode and the flip angle, to be investigated in patient populations with wide PDFF and R2* ranges. The reduction of the factors to investigate is critical for the extension of this work in patients.
CONCLUSION
This study investigated the stability of breath-hold and free-breathing liver fat and R2* quantification on a standardized phantom and a group of normal subjects at 1.5T and 3T. This study revealed that flip angle, TE mode and coil usage were important protocol parameters to investigate further in larger patient population.Acknowledgements
No acknowledgement found.References
1. Liu CY, McKenzie CA, Yu H, Brittain JH, Reeder SB. Fat quantification with IDEAL gradient echo imaging: correction of bias from T1 and noise. Magnetic Resonance in Medicine: An Official Journal of the International Society for Magnetic Resonance in Medicine. 2007 Aug;58(2):354-64.
2. Bydder M, Yokoo T, Hamilton G, et al. Relaxation effects in the quantification of fat using gradient echo imaging. Magnetic resonance imaging. 2008 Apr 1;26(3):347-59.
3. Yu H, Shimakawa A, McKenzie CA, Brodsky E, Brittain JH, Reeder SB. Multiecho water‐fat separation and simultaneous R estimation with multifrequency fat spectrum modeling. Magnetic Resonance in Medicine: An Official Journal of the International Society for Magnetic Resonance in Medicine. 2008 Nov;60(5):1122-34.
4. Yu H, Shimakawa A, Hines CD, et al. Combination of complex‐based and magnitude‐based multiecho water‐fat separation for accurate quantification of fat‐fraction. Magnetic resonance in medicine. 2011 Jul;66(1):199-206.
5. Hernando D, Sharma SD, Kramer H, Reeder SB. On the confounding effect of temperature on chemical shift‐encoded fat quantification. Magnetic resonance in medicine. 2014 Aug;72(2):464-70.
6. Block KT, Chandarana H, Milla S, et al. Towards routine clinical use of radial stack-of-stars 3D gradient-echo sequences for reducing motion sensitivity. Journal of the Korean Society of Magnetic Resonance in Medicine. 2014 Jun 1;18(2):87-106.
7. Armstrong T, Dregely I, Stemmer A, et al. Free‐breathing liver fat quantification using a multiecho 3 D stack‐of‐radial technique. Magnetic resonance in medicine. 2018 Jan;79(1):370-82.
8. Zhong X, Armstrong T, Nickel MD, et al. Free breathing R2* mapping using three‐dimensional self‐gating motion‐compensated stack‐of‐radial MRI. In Proceedings of the 27th Annual Meeting of ISMRM, Montréal, Québec, Canada, 2019.
9. Zhong X, Armstrong T, Nickel MD, et al. Effect of respiratory motion on free‐breathing 3D stack‐of‐radial liver R2* relaxometry and improved quantification accuracy using self-gating. Magnetic resonance in medicine. 2019. In press.
10. Hu H, et al, and the RSNA QIBA PDFF Committee. Multi-Site, Multi-Vendor, and Multi-Platform Reproducibility and Accuracy of Quantitative Proton-Density Fat Fraction (PDFF) at 1.5 and 3 Tesla with a Standardized Spherical Phantom: Preliminary Results from a Study by the RSNA QIBA PDFF Committee. In Proceedings of the 27th Annual Meeting of ISMRM, Montréal, Québec, Canada, 2019.
11. Zhong X, Nickel MD, Kannengiesser SA, Dale BM, Kiefer B, Bashir MR. Liver fat quantification using a multi‐step adaptive fitting approach with multi‐echo GRE imaging. Magnetic resonance in medicine. 2014 Nov;72(5):1353-65.
12. R Core Team (2018). R: A language and environment for statistical computing. R Foundation for Statistical Computing, Vienna, Austria. URL https://www.R-project.org/.
13. Bates D, Mächler M, Bolker B, Walker S. Fitting linear mixed-effects models using lme4. Journal of Statistical Software. 2015 Oct:67(1):1-48.
14. Kühn JP, Jahn C, Hernando D, et al. T1 bias in chemical shift‐encoded liver fat‐fraction: role of the flip angle. Journal of Magnetic Resonance Imaging. 2014 Oct;40(4):875-83.
Figures