3164
The effect of noise on myelin assessment by multi-exponential fitting for varying white matter fibre geometries
Tonima S Ali1, Vaibhavi S Itkyal1,2, Kiran Thapaliya1,3, and Markus Barth1,2,3
1University of Queensland, Brisbane, Australia, 2Indian Institute of Technology, Madras, India, 3Griffith University, Gold Coast, Australia
1University of Queensland, Brisbane, Australia, 2Indian Institute of Technology, Madras, India, 3Griffith University, Gold Coast, Australia
Synopsis
The use of multi-echo gradient echo (mGRE) with signal compartment modelling is an increasingly popular choice for myelin assessment by measuring myelin T2* (T2*My), myelin water fraction (MWF) and g-ratio. In this simulation study, we show the effects of varying white matter microstructure and noise levels on GRE and the efficiency of commonly used fitting algorithms for predicting the true T2*My, MWF and g-ratio.
Introduction
Signal compartment modelling is a widely used method for studying the water compartments of white matter and demyelination using spin echo (SE) sequences1,2. The use of multi-echo gradient echo (mGRE) with signal compartment modelling has been a popular choice in recent years for myelin quantification by measuring T2*, water fraction and g-ratio for the myelin, axonal and extra-cellular water compartments. Several in vivo studies have implemented signal compartment model to estimate water fractions and relaxation time in white matter tissue3–6, however, the quantitative measurements of water fractions and relaxation time were inconsistent across different studies3–6. Several simulation studies have attempted to identify the reason for these variations by using different white matter architecture and by varying fibre orientations that suggested the white matter microstructure may have substantial influence on the nature of GRE. In this study we explore the effects of varying axon diameters, inter-axonal gaps and different noise levels on the signal generated by GRE and the ability of three commonly used fitting algorithms to estimate the correct tissue parameters.Methods
Simulations: white matter fibre microstructure was simulated by using open source Axon Packing software7 that allows the simulation of the optimum arrangement of axons in white matter. Myelin volume fraction (MVF), axonal volume fraction (AVF) and g-ratio8 were obtained from Axon Packing software varying different simulation parameters as shown in Table 1. Five iterations of simulation were performed for each combination of parameters and the mean results were reported, the result of one iteration is shown in Fig 1. Volume fractions were converted to water fraction as described by Miller et al9. The simulated microstructure scenarios were then used to calculate the GRE signal [implemented in Matlab (Math Works, Natick, MA), parameters used for simulation are presented in Table 1]. The T2* used of myelin (T2*My), axonal (T2*Ax) and extracellular (T2*Ex) water compartments were taken from literature for 7T field strength6. 1%, 2% and 3% noise was added to the simulated signal, which were then fitted to the three compartment model:S(t) = AMy exp(-t/T2*My) + AAx exp(-t/T2*Ax) + AEx exp(-t/T2*Ex) + C (1)
where AMy, AAx and AEx are water fractions for the myelin, axonal, and extracellular water compartments (MWF, AWF and extracellular volume fraction (EWF), respectively). Three independent methods were used for fitting in Matlab. Method 1 employed a nonlinear curve fitting method (lsqnonlin)3, method 2 a trust region algorithm (fit)10 and method 3 a constraint free CVNNLS algorithm from open-source AnalyzeNNLS11 software for non-negative-least-square fitting. The boundary conditions and initial estimates used for fitting methods are presented in Table 1. In addition, g-ratio was also estimated using the MWF and AWF computed by the fitting methods6,8. The performance of fitting was assessed by computing % error.
Results
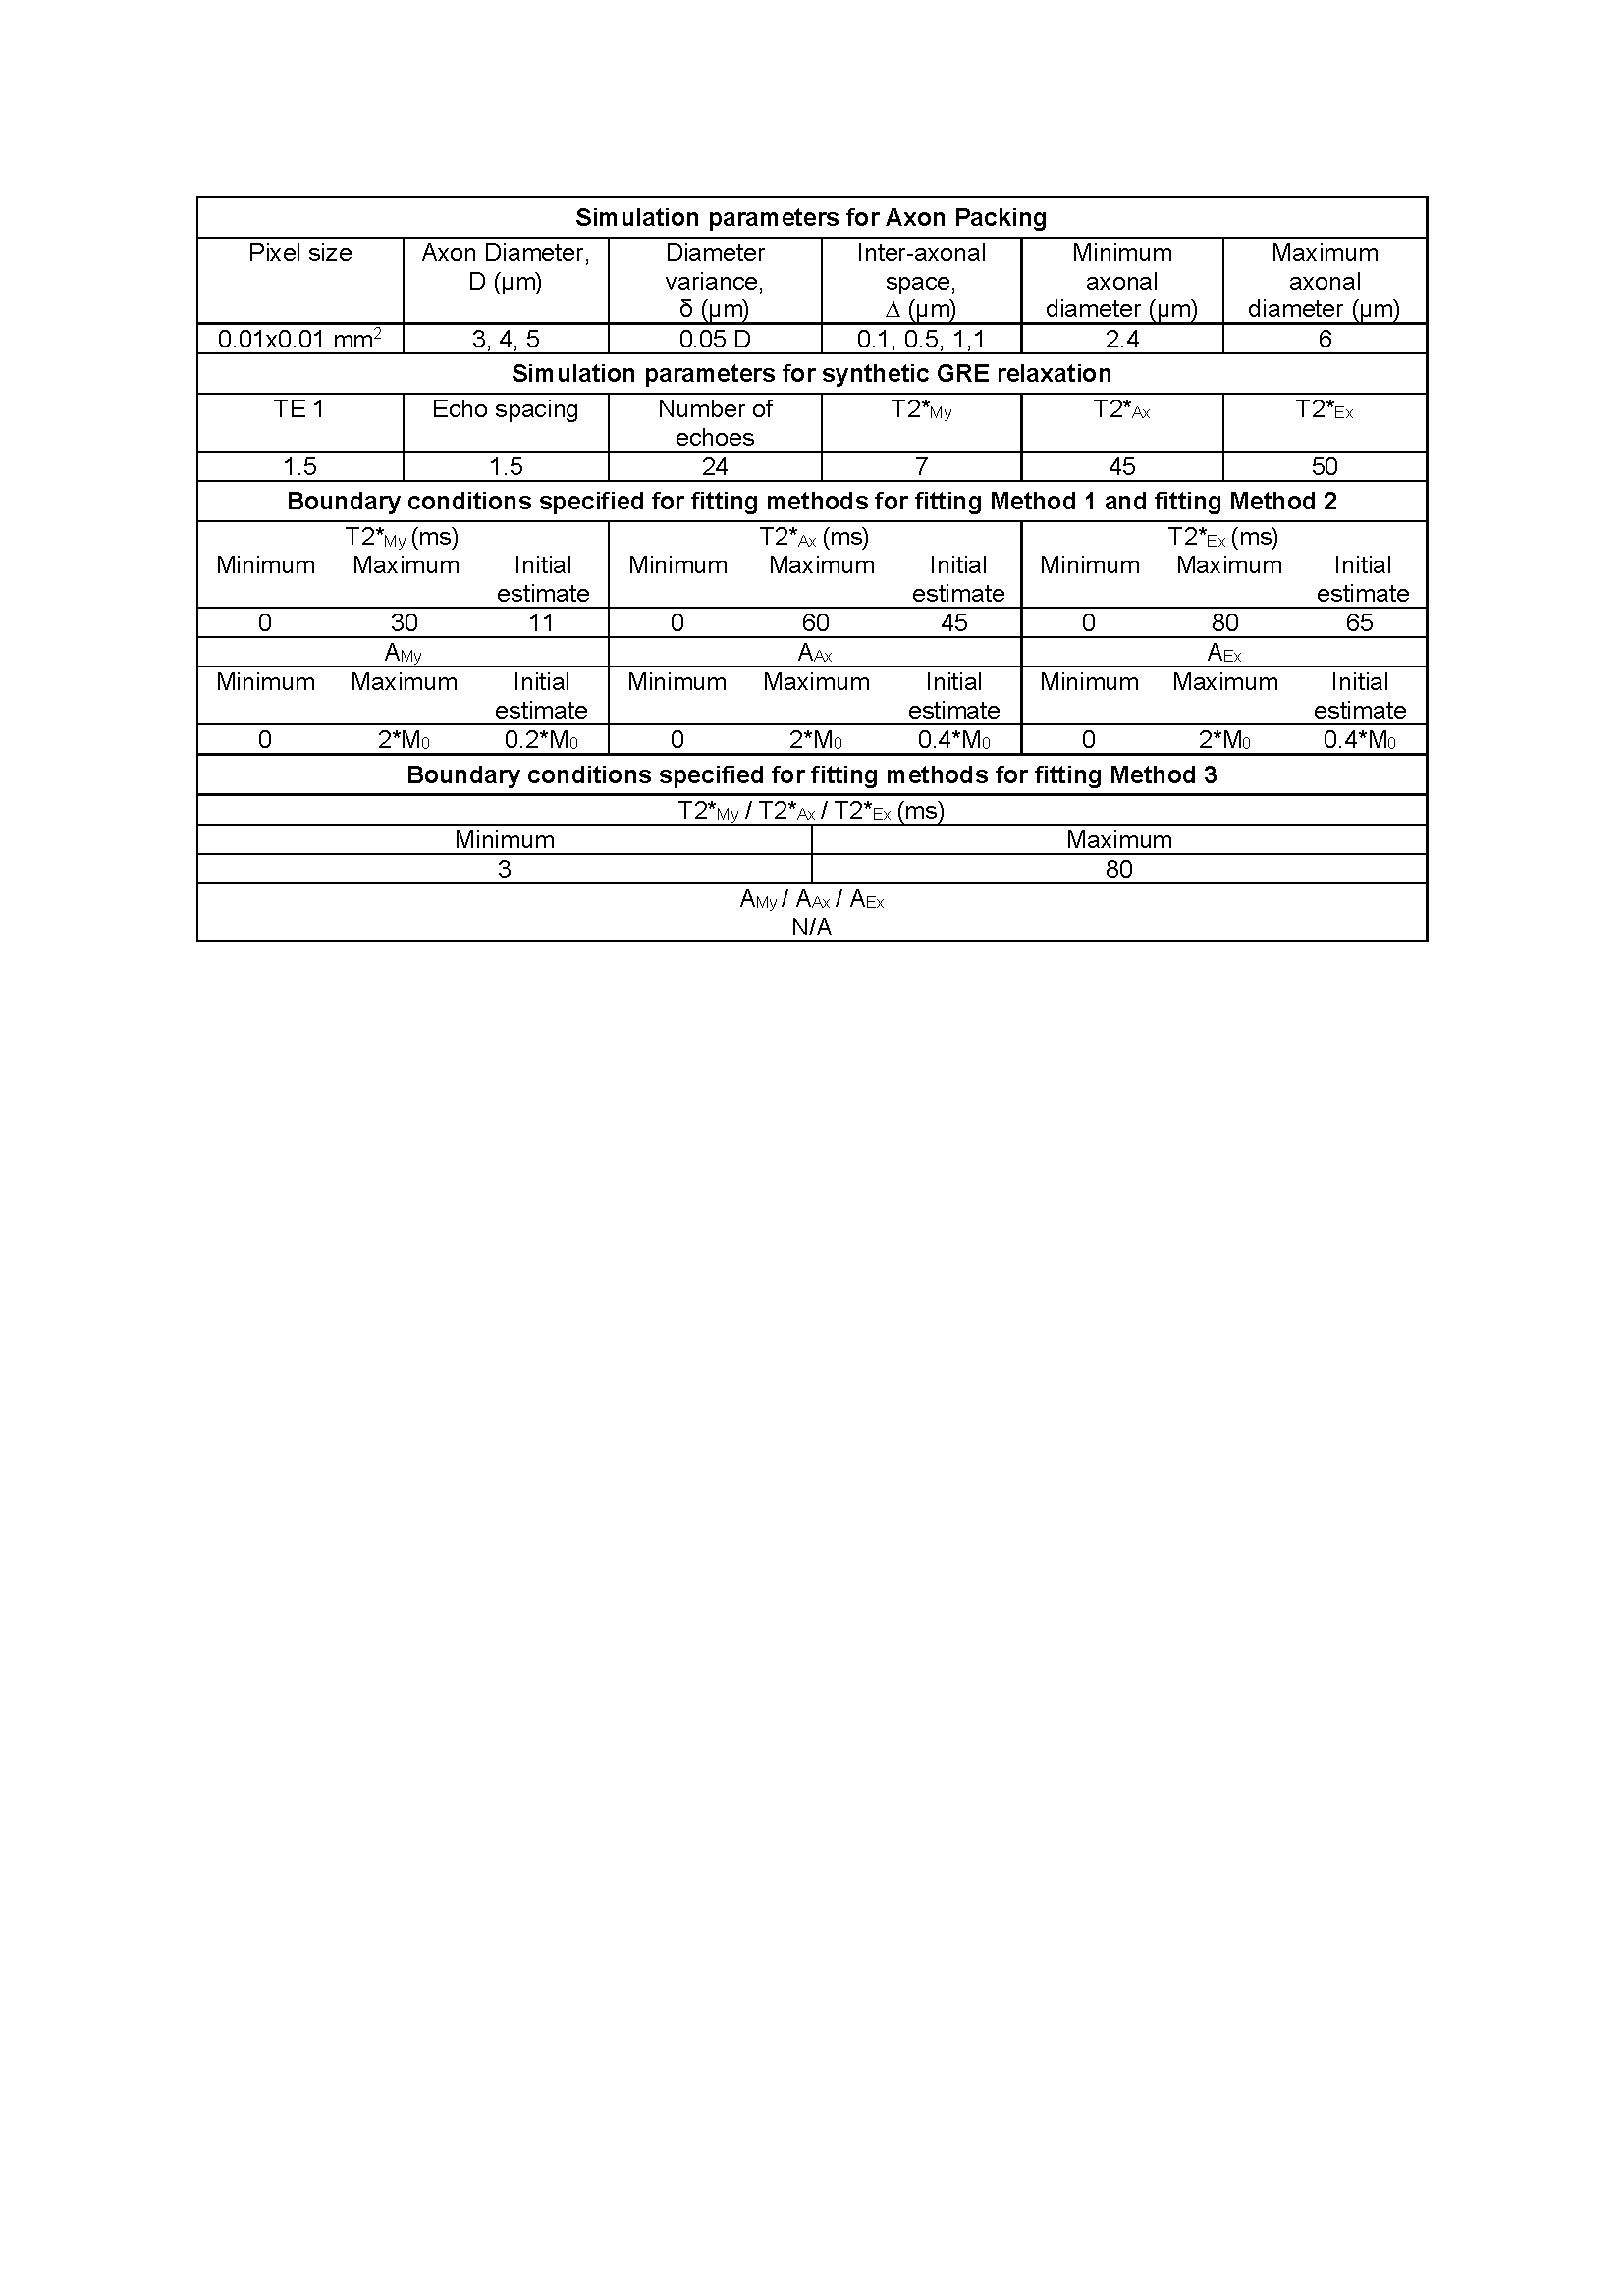
Table 2 demonstrate the T2*My relaxation times estimated using methods 1, 2 and 3. We observed that method 3 was most accurate in estimating the T2*My, MWF and g-ration irrespective of tissue microstructure input parameters and showed the smallest error level in most scenarios, and performed similar to method 2 in the lower noise level regime. Method 1 had a high percentage of error when noise is present in a signal. Table 3-4 shows myelin water fraction (MWF) and g-ratio estimated using different methods. MWF estimated by method 2 in lower noise level (0% and 1%) has less percentage of error whereas at higher noise level (2% and 3%), method 3 outperforms method 2. The percentage of error while estimating g-ratio was similar for method 2 and 3. We found that method 1 has higher percentage of error in all noise level. We also observed that varying intra-axonal gap in the input, led to a variation in the estimated water fraction and relaxation time, but there was little influence on the estimation of water fraction and relaxation time when varying the axonal diameter (see Table 1-4). Therefore, results were reported only for two of the diameters used in simulation.Discussion and Conclusion
We showed that fitting methods, axonal gap and noise levels affect the estimation of GRE signal derived parameters used for myelin assessment. We showed that myelin water fraction is affected by fitting methods that is similar to the simulation study perform at 3T and 7T12. We also showed that intra-axonal gap affects MWF and relaxation time, potentially due to the effect of packing geometry of axons13. Therefore, careful consideration should be taken in fitting methods choices. According to our results, the constraint-free method 3 is less sensitive to noise as well as to the changes in white matter microstructure. This method does not require any prior assumption on the T2* or WF values, which makes it particularly suitable for investigating white matter structures that are unpredictable such as in pathologies. We also observed that the estimation of the g-ratio seems to be the most robust parameter in terms of error, at least for method 2 and 3. These findings will help inform the estimation of white matter microstructure in in-vivo data sets.Acknowledgements
* T.S.A. and V.S.I. have contributed equally and indicates joint first authorship.References
1 C. Laule, I. M. Vavasour, G. R. W. Moore, J. Oger, D. K. B. Li, D. W. Paty and A. L. MacKay, J. Neurol., 2004, 251, 284–293. 2 K. P. Whittall, A. L. MacKay, D. A. Graeb, R. A. Nugent, D. K. B. Li and D. W. Paty, Magn. Reson. Med., 1997, 37, 34–43. 3 D. Hwang, D. H. Kim and Y. P. Du, Neuroimage, 2010, 52, 198–204. 4 Y. Nam, J. Lee, D. Hwang and D. H. Kim, Neuroimage, 2015, 116, 214–221. 5 P. Sati, P. van Gelderen, A. C. Silva, D. S. Reich, H. Merkle, J. A. De Zwart and J. H. Duyn, Neuroimage, 2013, 77, 268–278. 6 K. Thapaliya, V. Vegh, S. Bollmann and M. Barth, Neuroimage, 2018, 182, 407–416. 7 T. Mingasson, T. Duval, N. Stikov and J. Cohen-Adad, Front. Neuroinform., 2017, 11, 1–12. 8 N. Stikov, J. S. W. Campbell, T. Stroh, M. Lavelée, S. Frey, J. Novek, S. Nuara, M. K. Ho, B. J. Bedell, R. F. Dougherty, I. R. Leppert, M. Boudreau, S. Narayanan, T. Duval, J. Cohen-Adad, P. A. Picard, A. Gasecka, D. Côté and G. B. Pike, Neuroimage, 2015, 118, 397–405. 9 T. Xu, S. Foxley, M. Kleinnijenhuis, W. C. Chen and K. L. Miller, Magn. Reson. Med., 2018, 79, 489–500. 10 T. S. Ali, I. Prasadam, Y. Xiao and K. I. Momot, Sci. Rep., 2018, 8, 1–15. 11 T. A. Bjarnason and J. R. Mitchell, J. Magn. Reson., 2010, 206, 200–204. 12 E. Alonso-Ortiz, I. R. Levesque and G. B. Pike, Magn. Reson. Med., 2015, 73, 70–81. 13 W. C. Chen, S. Foxley and K. L. Miller, Neuroimage, 2013, 70, 1–9.Figures
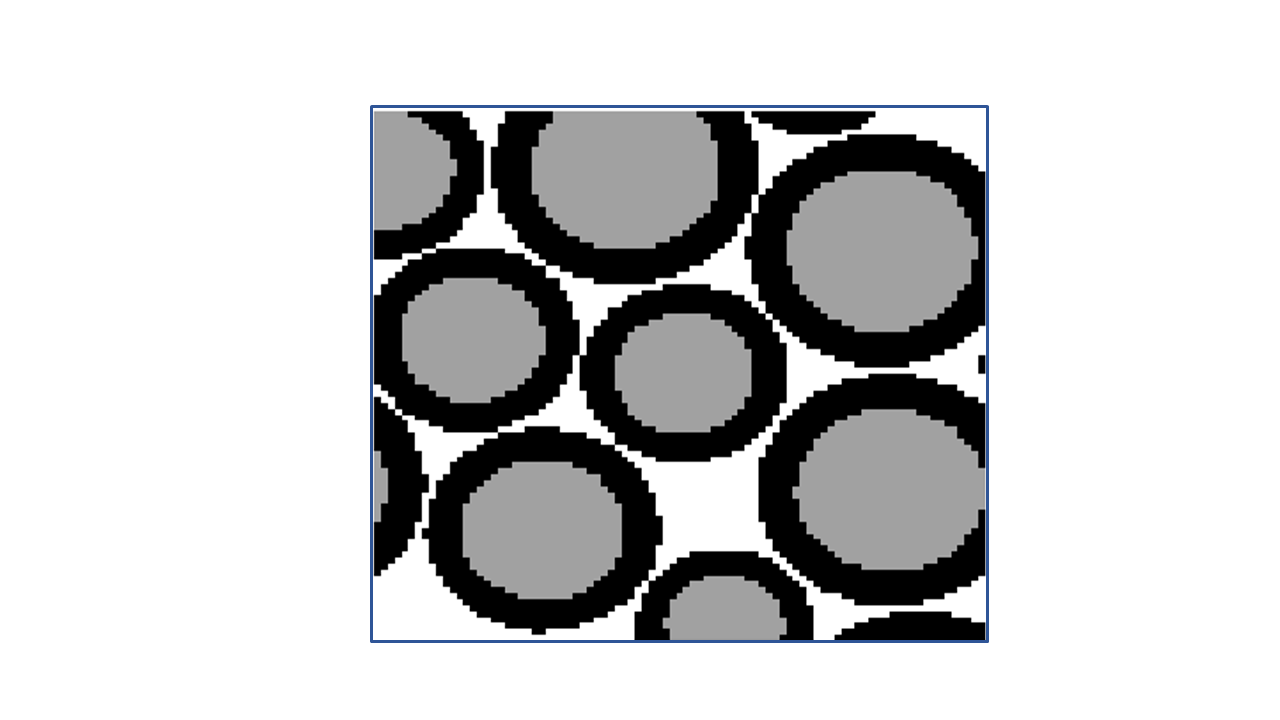
Figure 1: A representation of the results from Axon packing software for
0.01mmx0,01mm2 pixel size, mean axonal diameter, D = 3 µm, variance
of diameter, δ = 0.6 µm, inter-axonal space, = 0.1 µm, Dminimum = 2.4 µm
and Dmaximum = 6 µm and 35,000 iterations. Axonal volume is shown in
grey, myelin volume shown in black and inter-axonal space shown in white.
Table
1: Parameters used for simulation of axon packing and GRE relaxation signal and
the boundary conditioned used for fitting of the simulated signal to model
defined by equation 1. M0 is the magnitude of signal at time = 0.
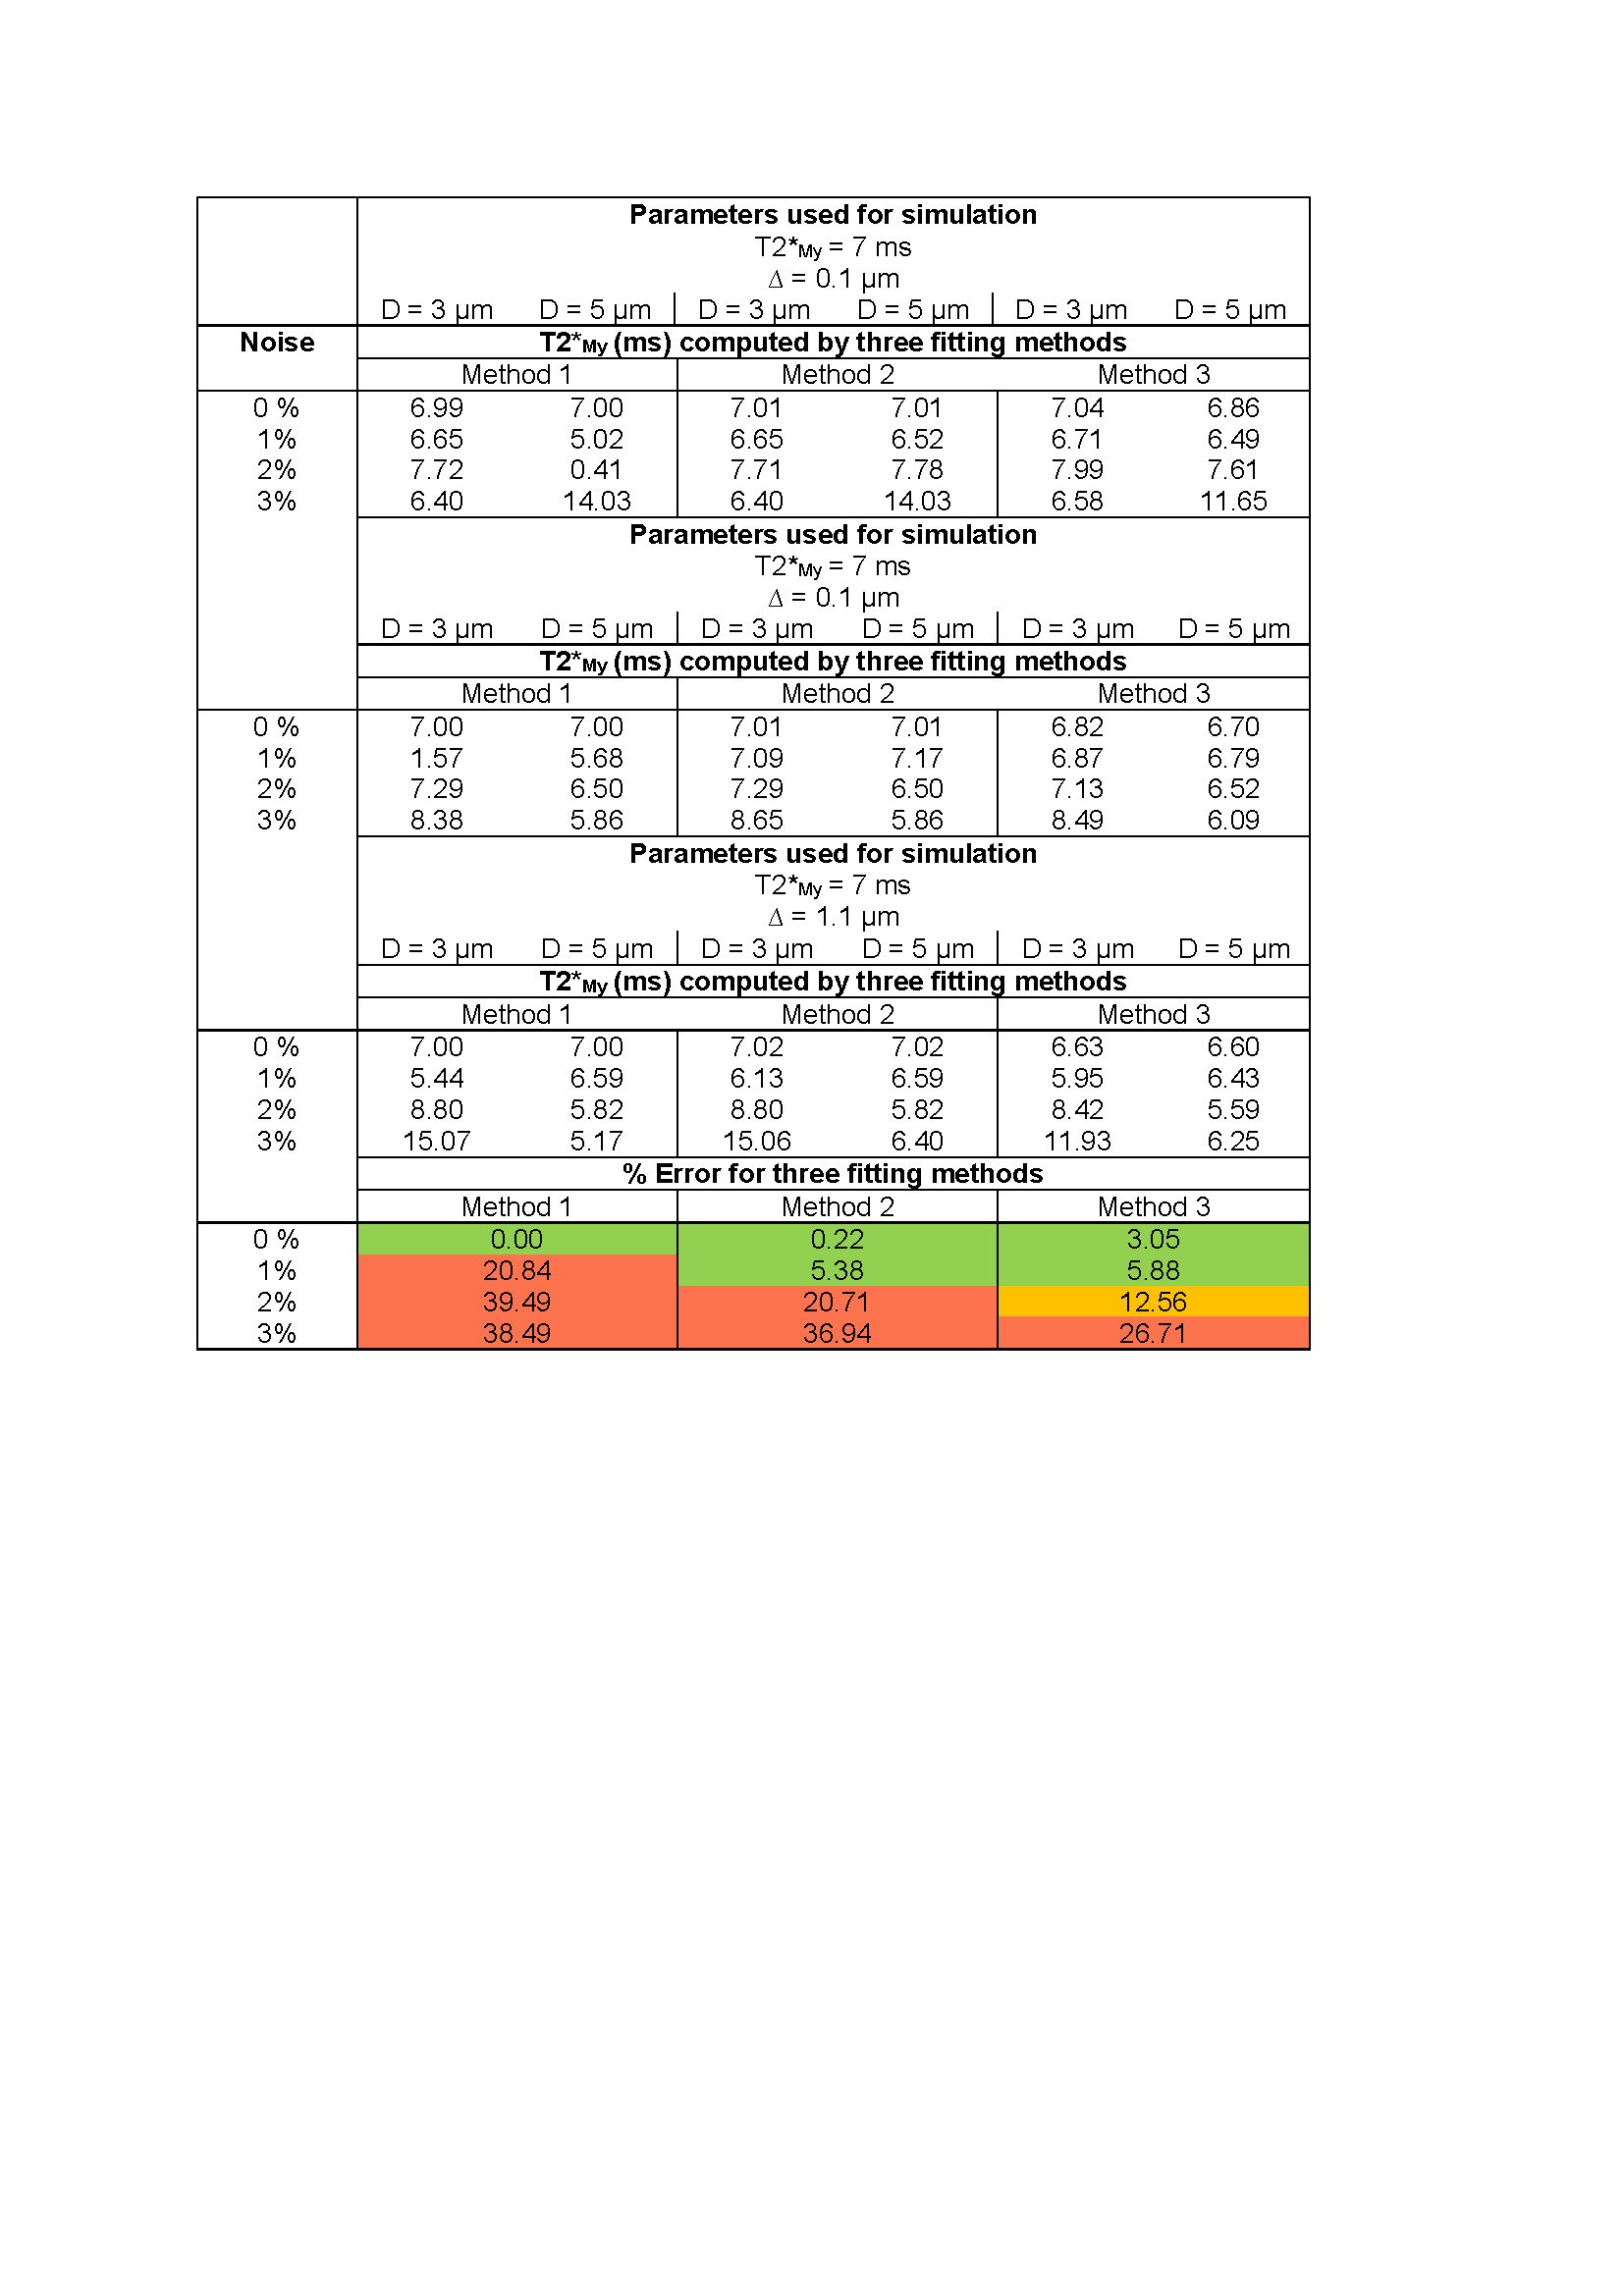
Table 2: The T2*My computed by three fitting methods for
variable axon packing parameters. For all values of D and ∆ reported here, the
% error for each method is calculated by: ((computed value – value from simulation)/value from simulation)*100% . Error < 10%
colored green, 10 % < error < 20%
colored orange and error > 20% colored red.
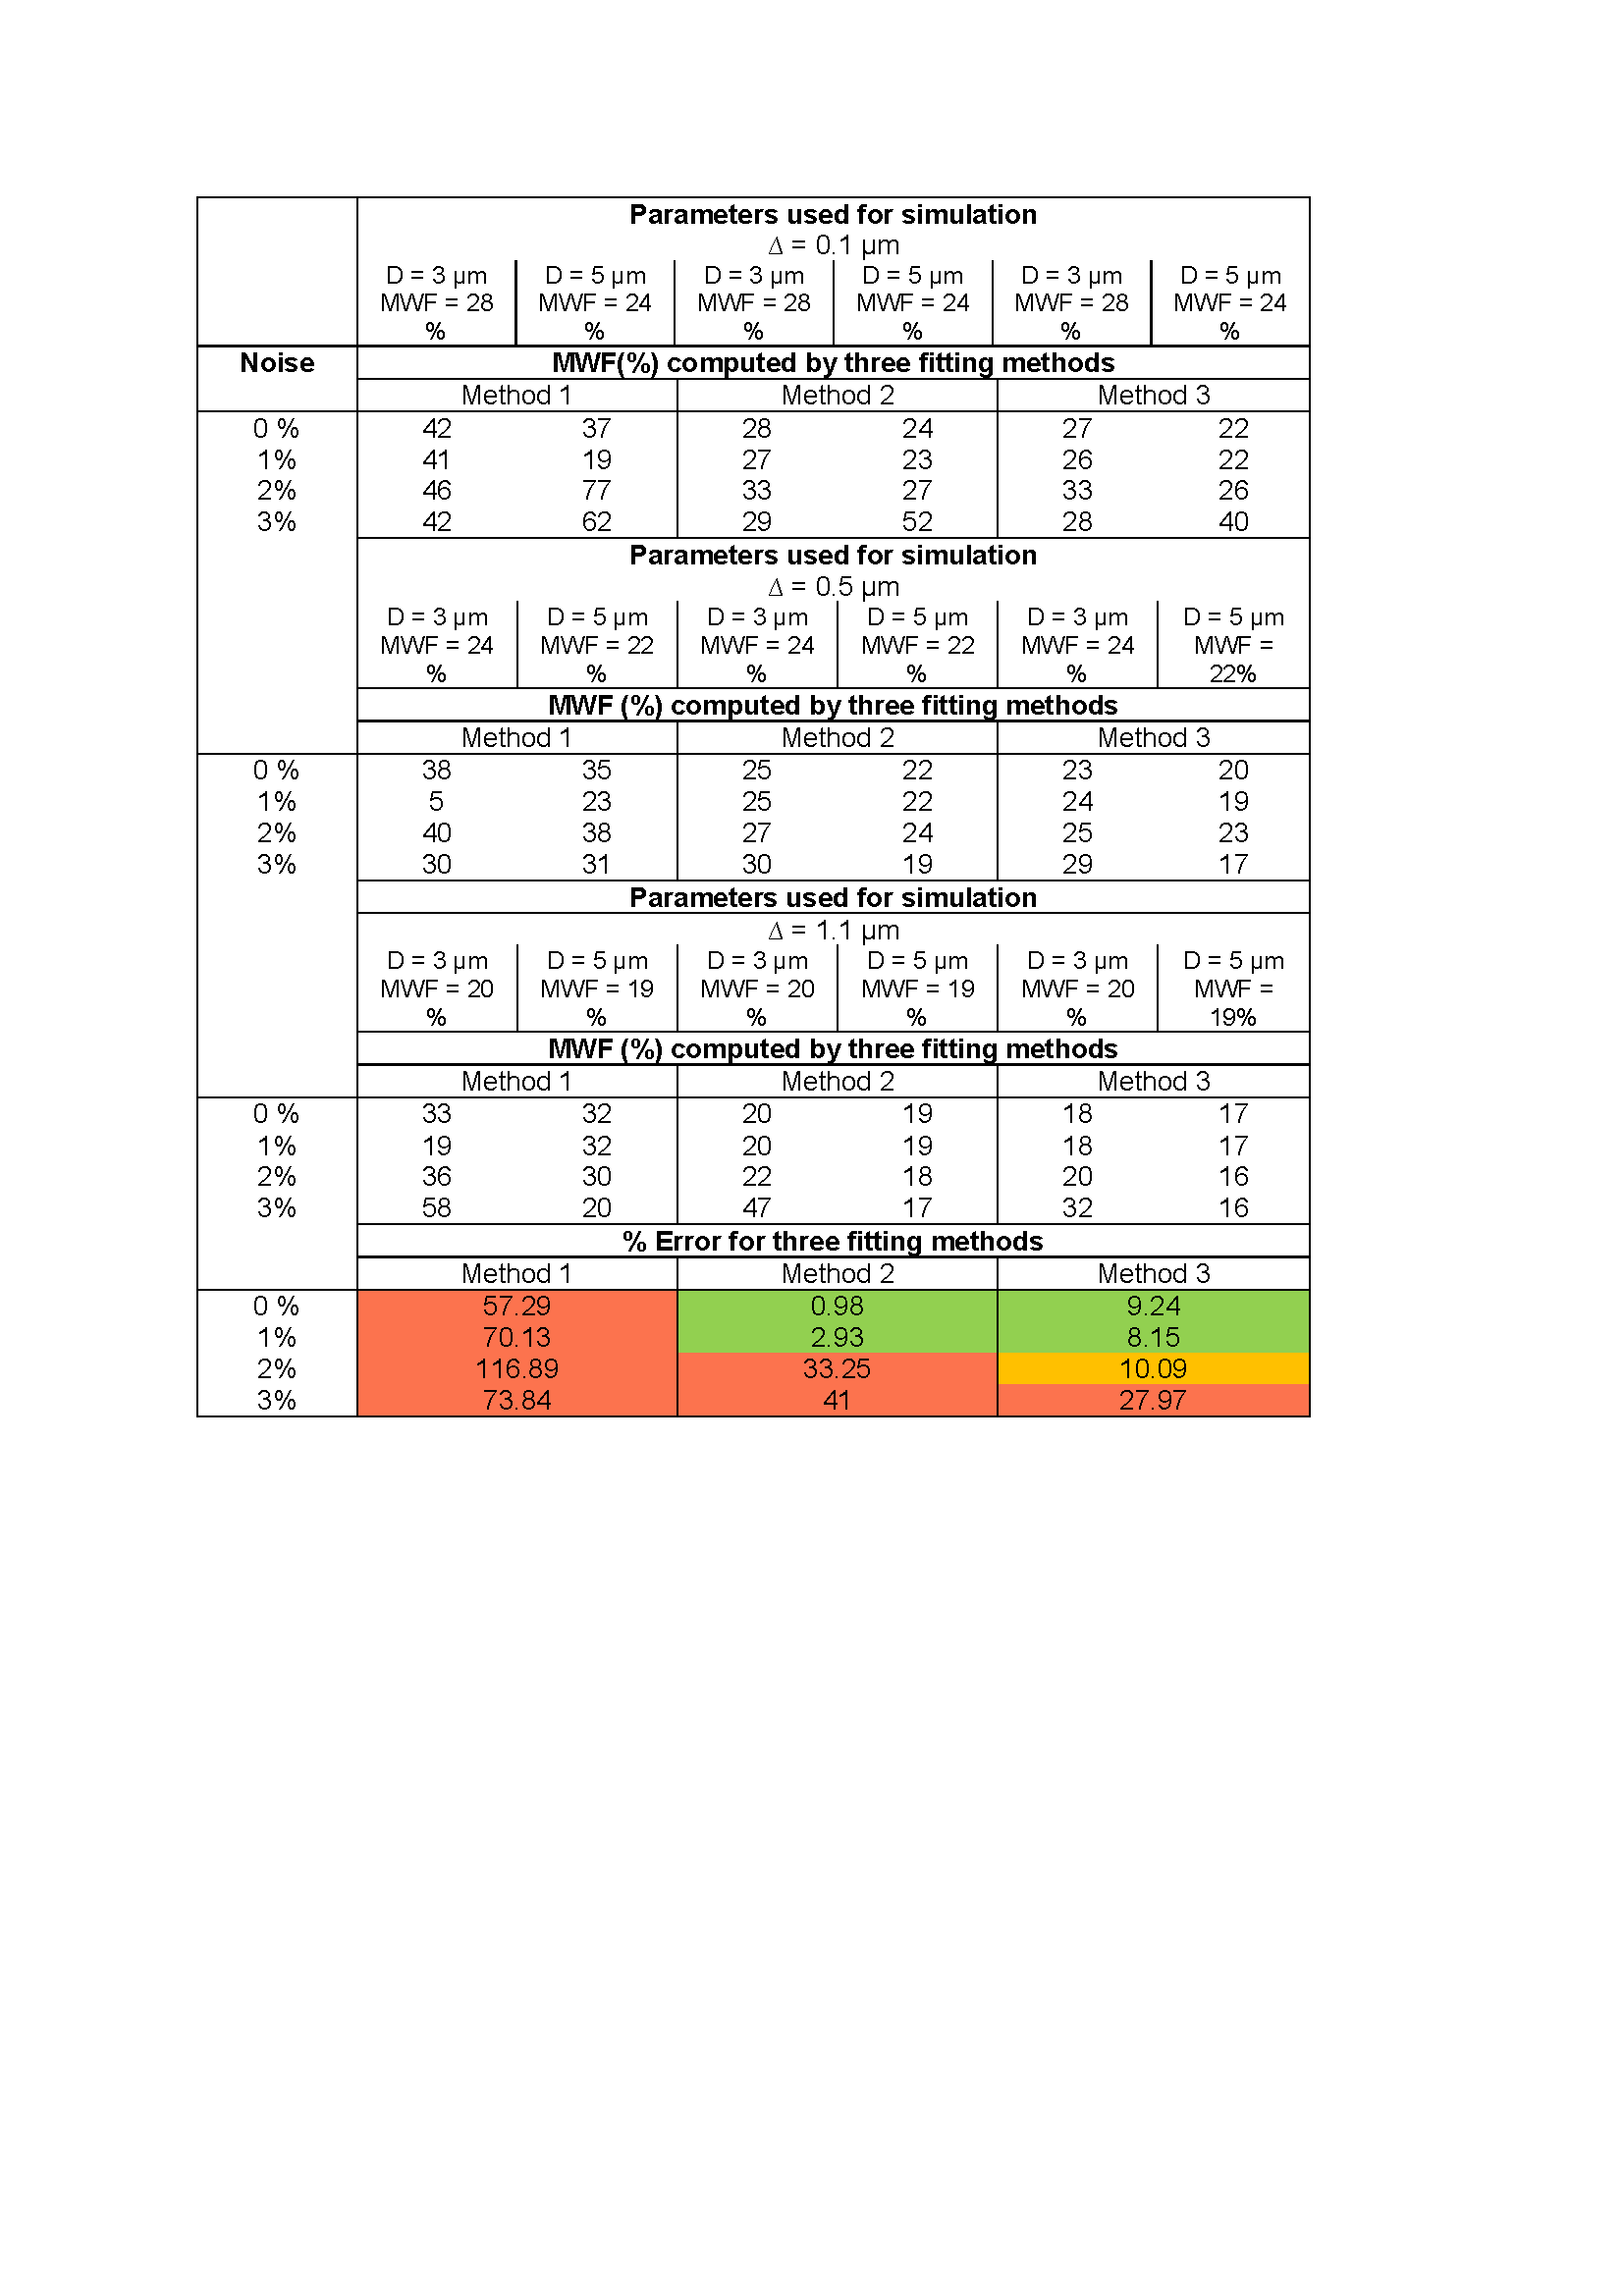
Table 3: The Myelin water fraction (MWF) computed by three fitting
methods for variable axon packing parameters. For all values of D and ∆ reported here, the % error
for each method is calculated by ((computed value – value from simulation)/value
from simulation)*100%. Error < 10% colored green, 10 % < error < 20% colored orange and error >
20% colored red.
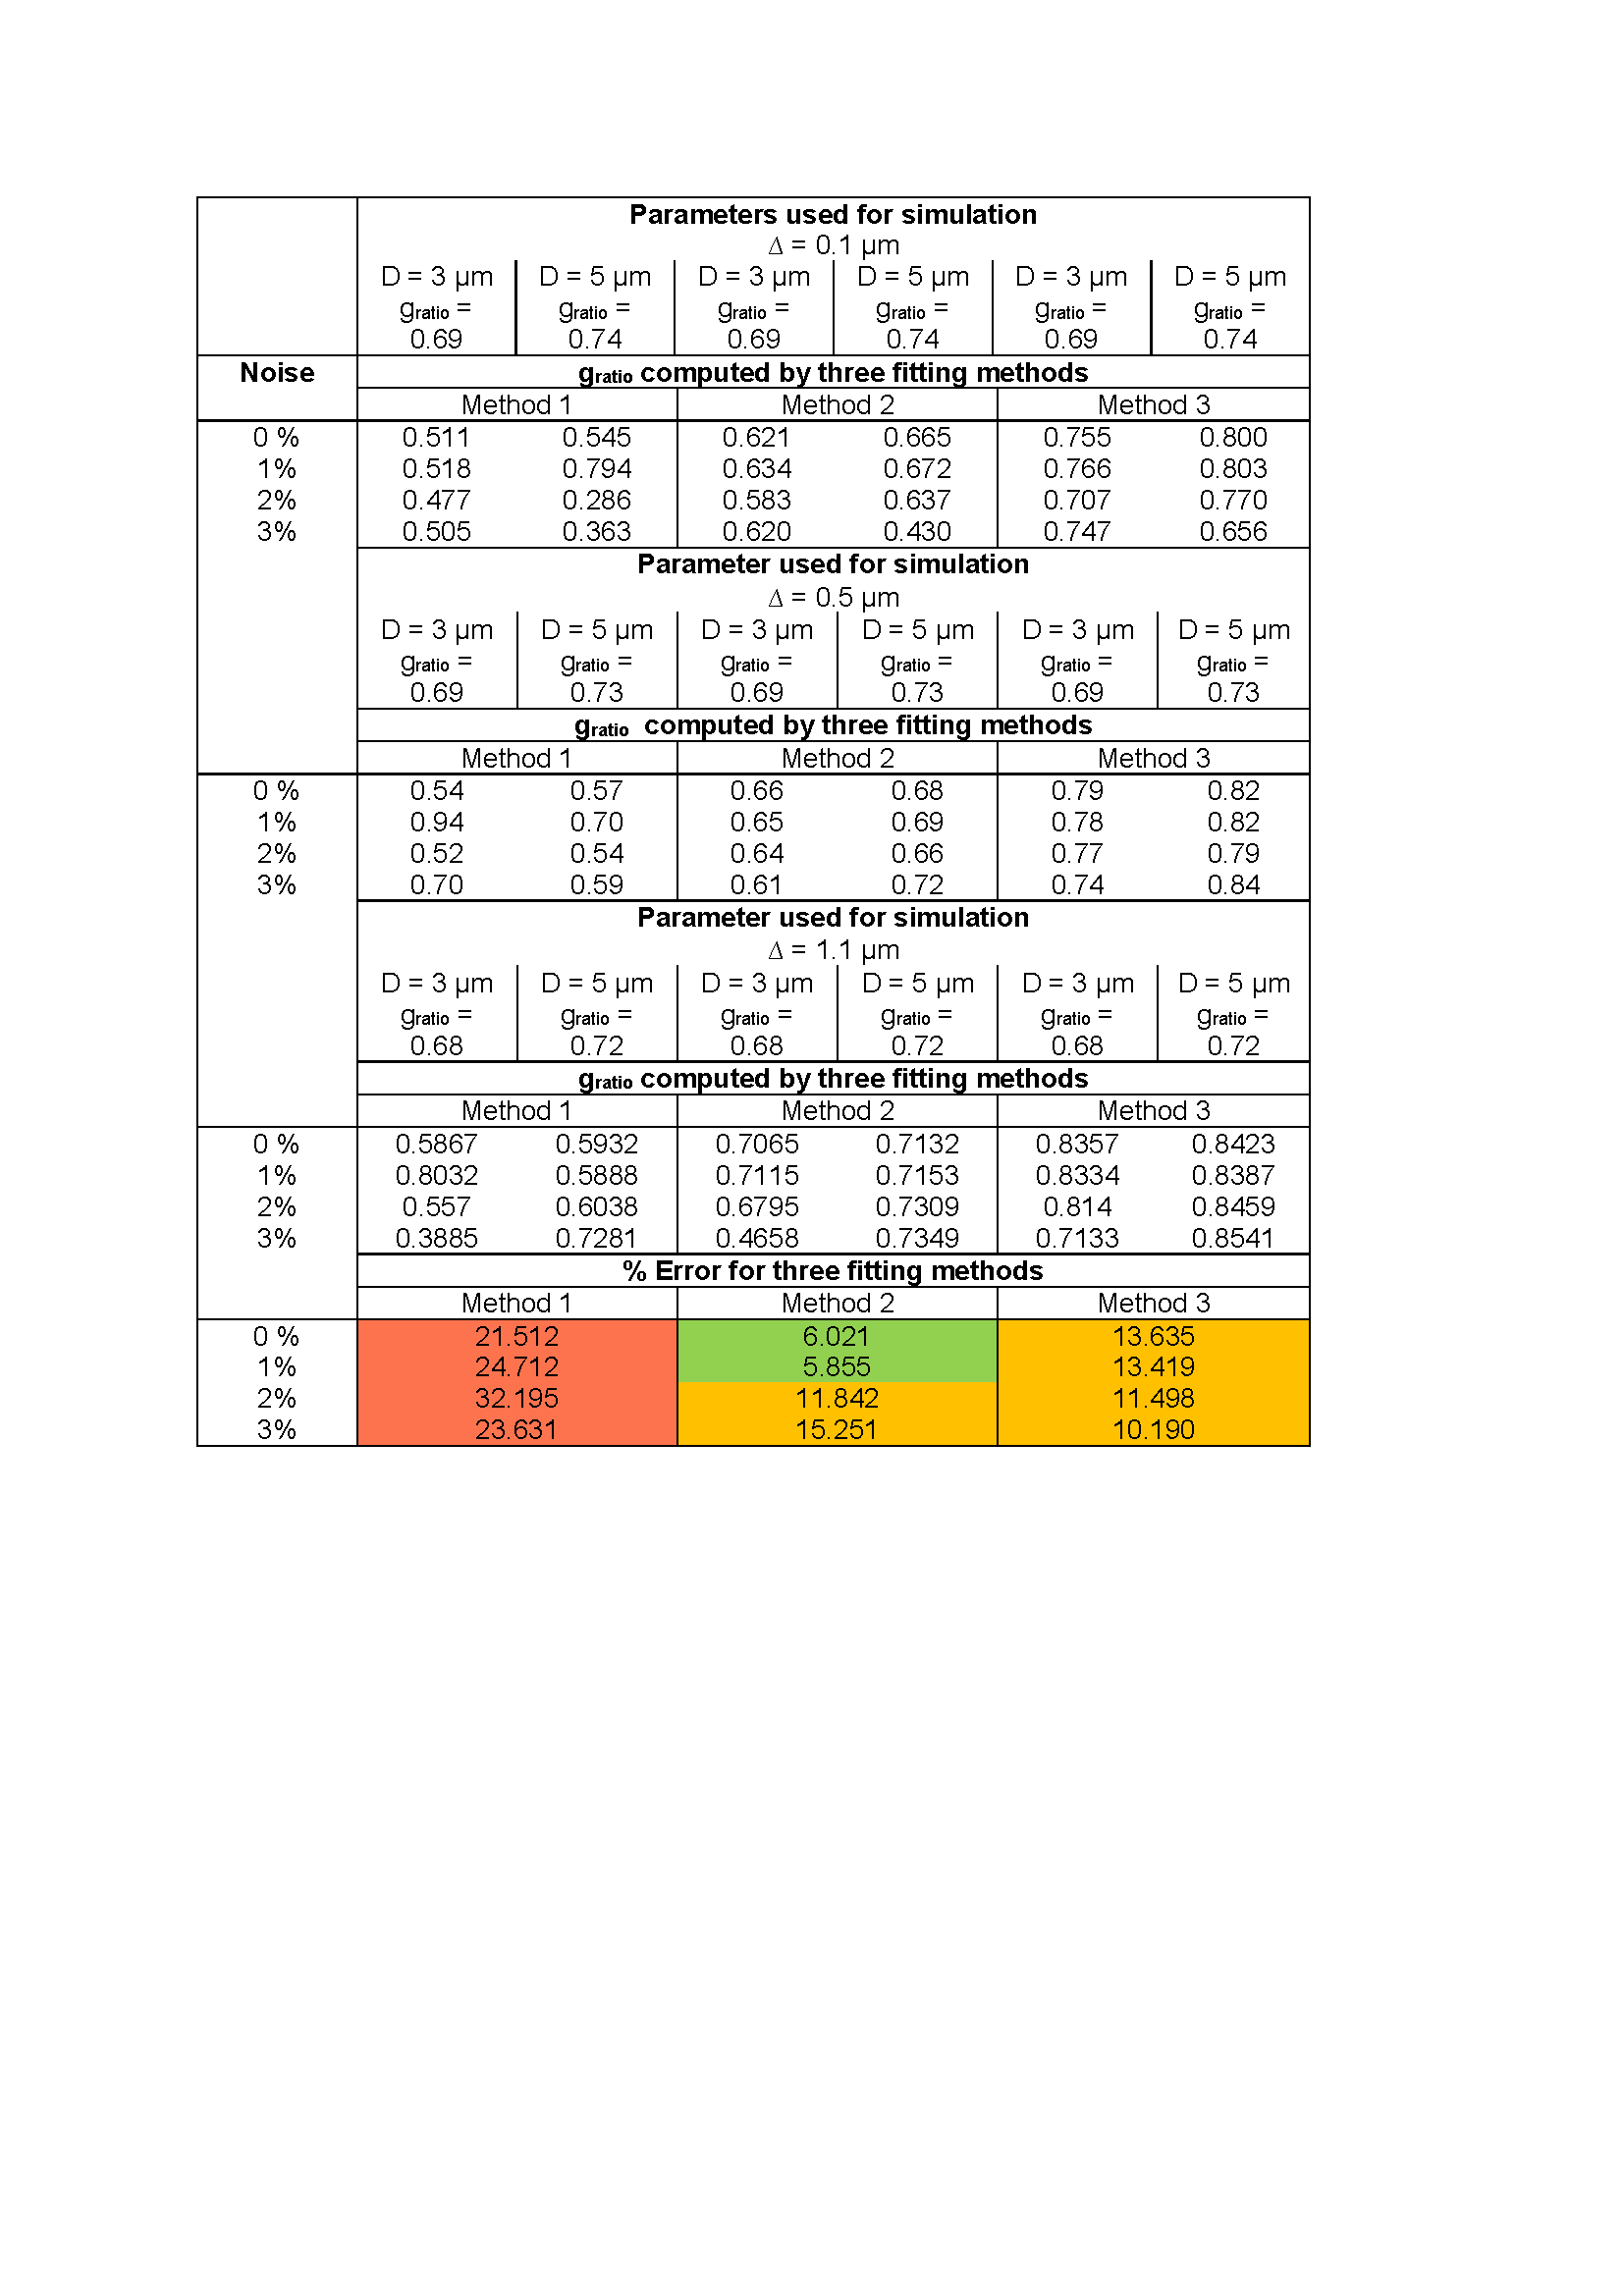
Table 4: The g-ratio computed by three fitting methods for variable axon
packing parameters. For all values of D and ∆ reported here, the % error for each method is calculated
by ((computed value – value from simulation)/value from simulation)*100%. Error
< 10% colored green, 10 % < error
< 20% colored orange and error > 20% colored red.