3162
Quantification of tissue shrinkage due to formalin fixation of entire post-mortem human brain1Institute for Systems Neuroscience, University Medical Center Hamburg-Eppendorf, Hamburg, Germany, 2Institute of Legal Medicine, University Medical Center Hamburg-Eppendorf, Hamburg, Germany
Synopsis
This work investigates tissue shrinkage during fixation and how it is related to associated changes in three quantitative MRI parameters (longitudinal relaxation $$$R_1$$$ and effective transverse relaxation $$$R_2^*$$$ rates, and magnetization transfer saturation rate MT). We proposed a new model to estimate tissue shrinkage from brain volume changes and found that shrinkage was $$$7.7\%$$$. No apparent relation between changes in MT and tissue shrinkage were found, whereas it was remarkable for $$$R_1$$$ and $$$R_2^*$$$, indicating that mostly the extra-axonal space is reduced during fixation.
Introduction
One prominent marker for myelin volume fraction (MVF) is the magnetization transfer saturation rate (MT)1,2 as acquired, e.g. with the Multi-parameter mapping (MPM) protocol3. A typical approach to validate this marker, would be comparing ex vivo MRI and histology of the same fixed human brain tissue sample. However, potential changes in volume between the in vivo and fixed ex vivo situation due to the fixation process4 must be considered for a proper validation. Previous experiments performed in mice brains showed that tissue shrinkage due to fixation4,5 is between 4% and 10% of the total volume. However, the temporal change of tissue shrinkage and how it is related to the observed changes in quantitative MPM parameters (longitudinal relaxation $$$R_1$$$ and effective transverse relaxation $$$R_2^*$$$ rates, and MT) is unknown. In this work, we model the temporal evolution of the tissue shrinkage during fixation for the whole human brain. To estimate the extend of tissue shrinkage and investigate how it affects qMRI parameters, we longitudinally analyzed two human brains, firstly measured in situ (inside the skull) and later in ex vivo, immersed in 4% paraformaldehyde (PFA) using the MPM protocol.Methods
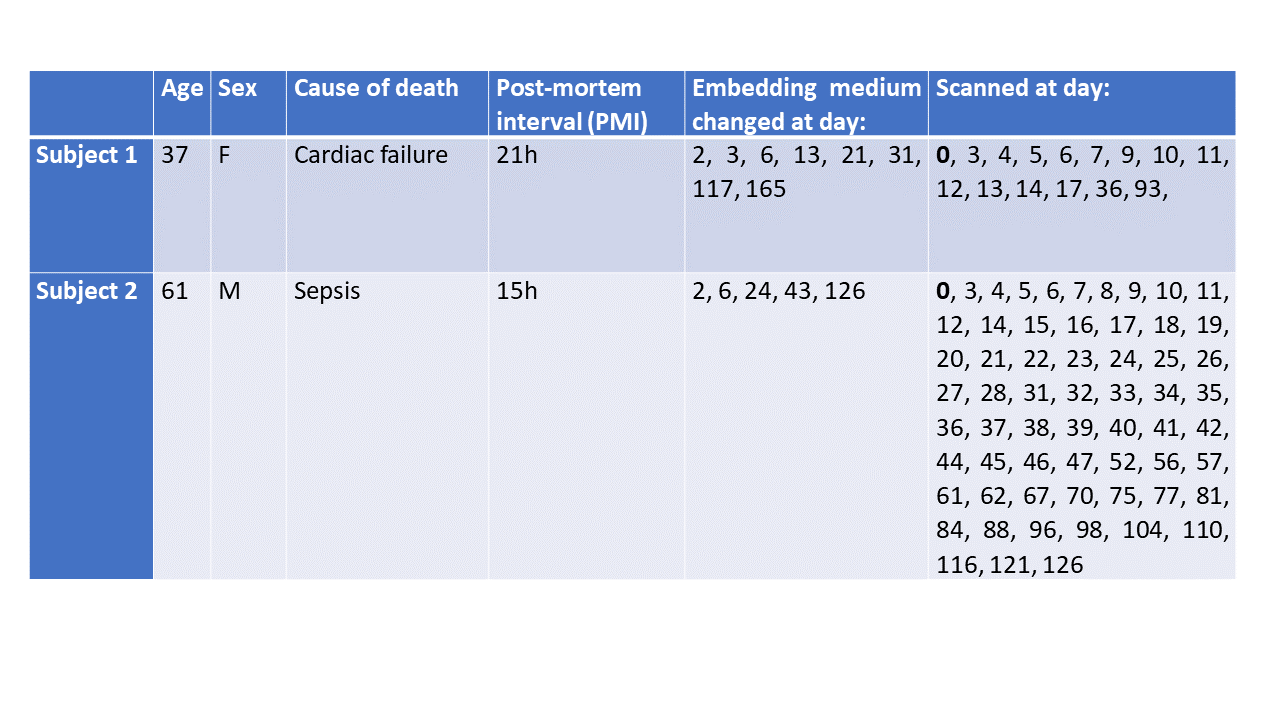
Subjects: Two human post-mortem brains dissected at autopsy with prior informed consent (WF-74/16), as described in table 1, were fixed with 4% paraformaldehyde (PFA) in aqueous solution, as commonly used for ex vivo histology6–8.MRI: Measurements were performed on a 3T PRISMA fit MRI (Siemens Healthcare, Erlangen, Germany), using the Siemens 32-channel receiver (Rx) head-coil. To ensure reproducibility in brain positioning, a custom-made sample holder was used. Whole brain MR images were acquired using the MPM3 protocol, based on calibration9 and spoiled multi-echo fast-low-angle-shot (FLASH10) sequences, including three different weightings (MT-, PD- and T1-weighting). The following sequence parameters were used: isotropic resolution of (0.8 mm)³, flip angle of 6° (MT- and PD-weighted) and 21° (T1-weighted), 8 echoes (2.34 to 18.44 ms, in steps of 2.30 ms), readout bandwidth of 488 Hz/pixel, and repetition time of 25.00 ms.
Analysis: In order to estimate the relative tissue shrinkage ($$$r\Delta V$$$) during the fixation process, we created a brain mask from the gray matter (GM) and white matter (WM) tissue probability maps, generated from the MT and R1 maps acquired at each time-point using SPM1211. For improved segmentation, the MT map from each time point was registered to the in situ brain using a rigid-body co-registration. To quantify the relative change $$$r\Delta V(d_k)$$$ at time-point $$$d_k$$$, we compared the volumes (represented by the total number of voxels $$$N(d_k)$$$) at $$$d_k$$$ with the volume of the in-situ time point $$$d_0$$$.$$(1)r\Delta V(d_k)=\frac{N(d_0)-N(d_k)}{N(d_0)}\times100$$
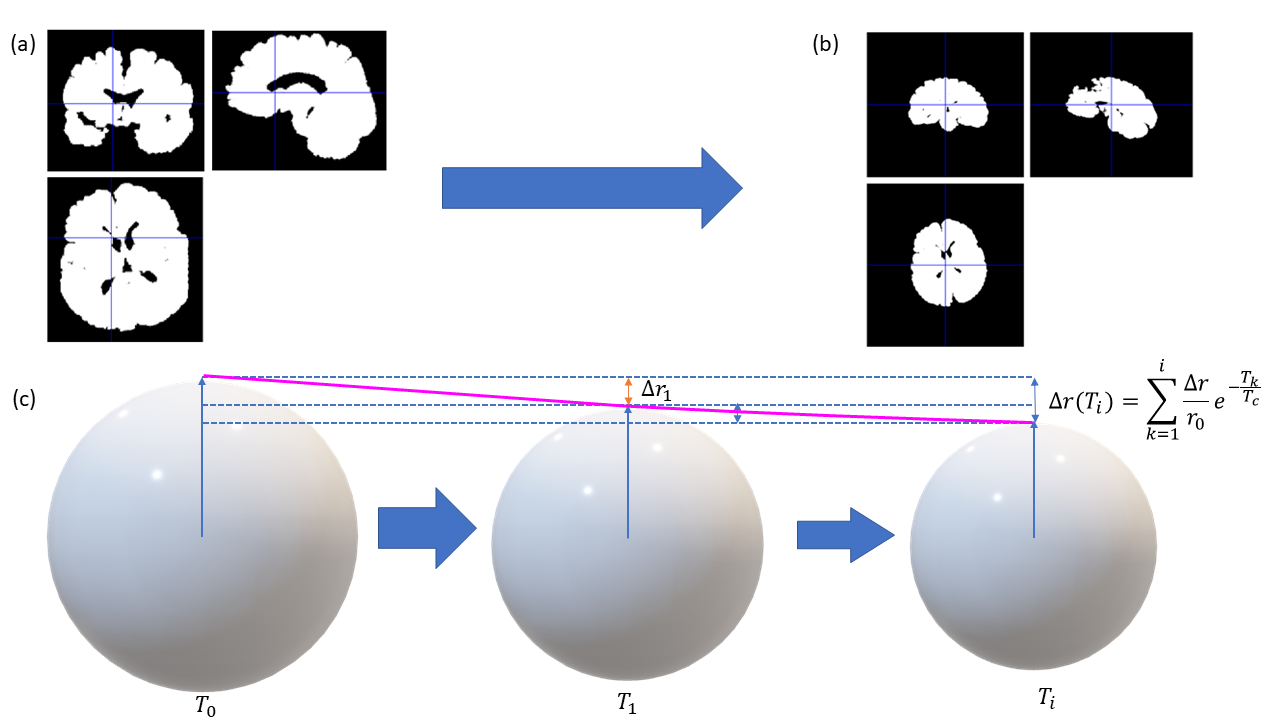
A spherical model for the tissue shrinkage: We assumed that the continuous reduction of the brain volume due to fixation can be approximated by the relative volume change of a sphere (Fig.2). The relative change of the sphere as a function of time is as follows:$$(2)rV(T_i)=\frac{V(T_0)-V(T_i)}{V(T_0)}=1-\frac{V(T_i)}{V(T_0)}$$, with $$$\frac{V(T_i)}{V(T_0)}=\frac{\left( r_0-\sum_{k=1}^i\Delta r(T_k)\right)^3}{r_0^3}=\left(1- \sum_{k=1}^i\frac{\Delta r(T_k)}{r_0}\right)^3$$$.
Here, we heuristically assumed that the relative decrement of the radius as a function of time can be described by an exponential: $$(3)\frac{\Delta r(T_K)}{r_0}=\delta\exp^{\left(\frac{T_k}{T_c}\right)}$$ with $$$\delta$$$ being a heuristic dimensionless decrement and $$$T_c$$$ being time at which 65% of the relative change took place. Consequently, we fitted the following function, depending on two parameters (\delta,T_c) to the measured relative volume change of the brain:$$(4)rV(T_i)=1-\left(1-\sum_{k=1}^i\delta\exp^{\left(\frac{T_k}{T_c}\right)}\right)^3$$
Results
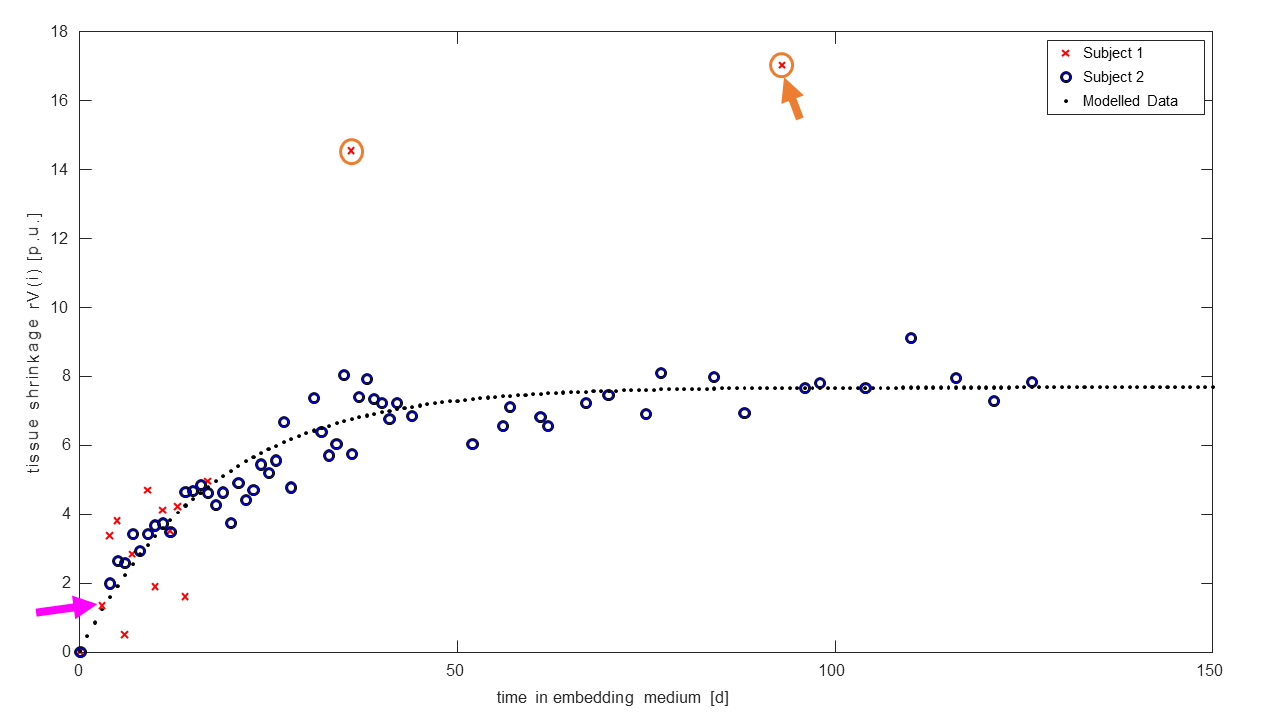
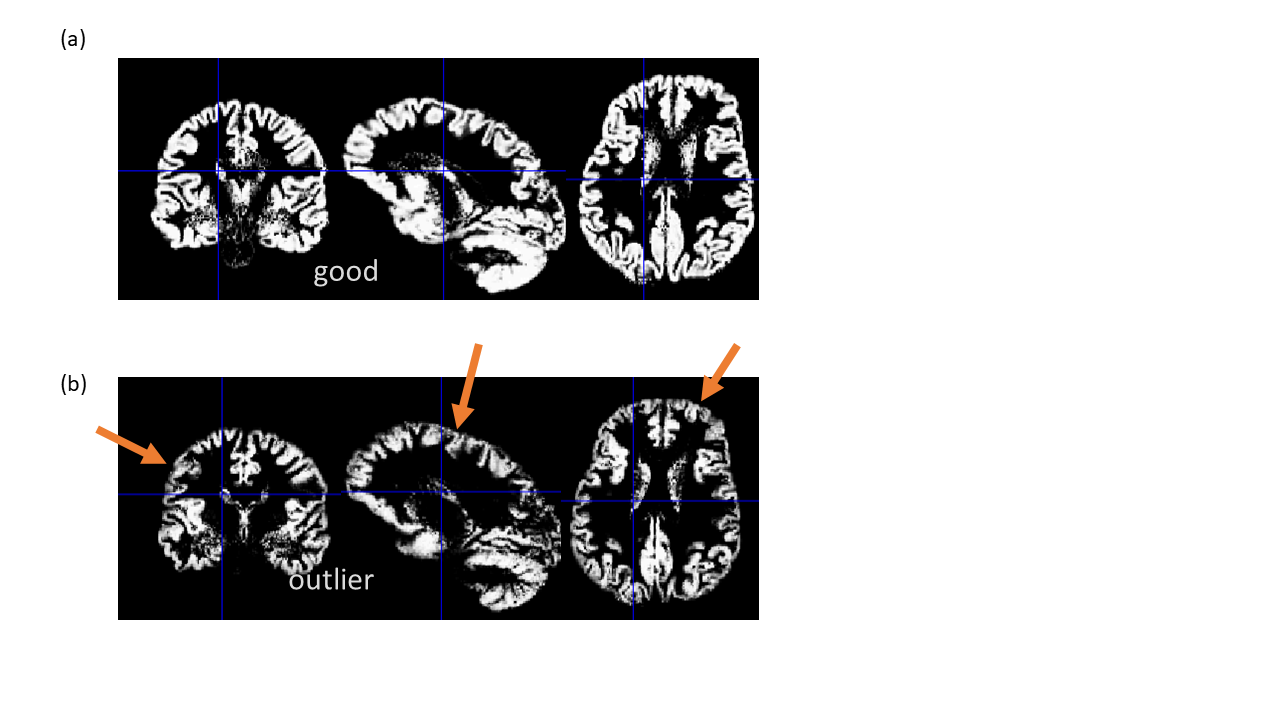
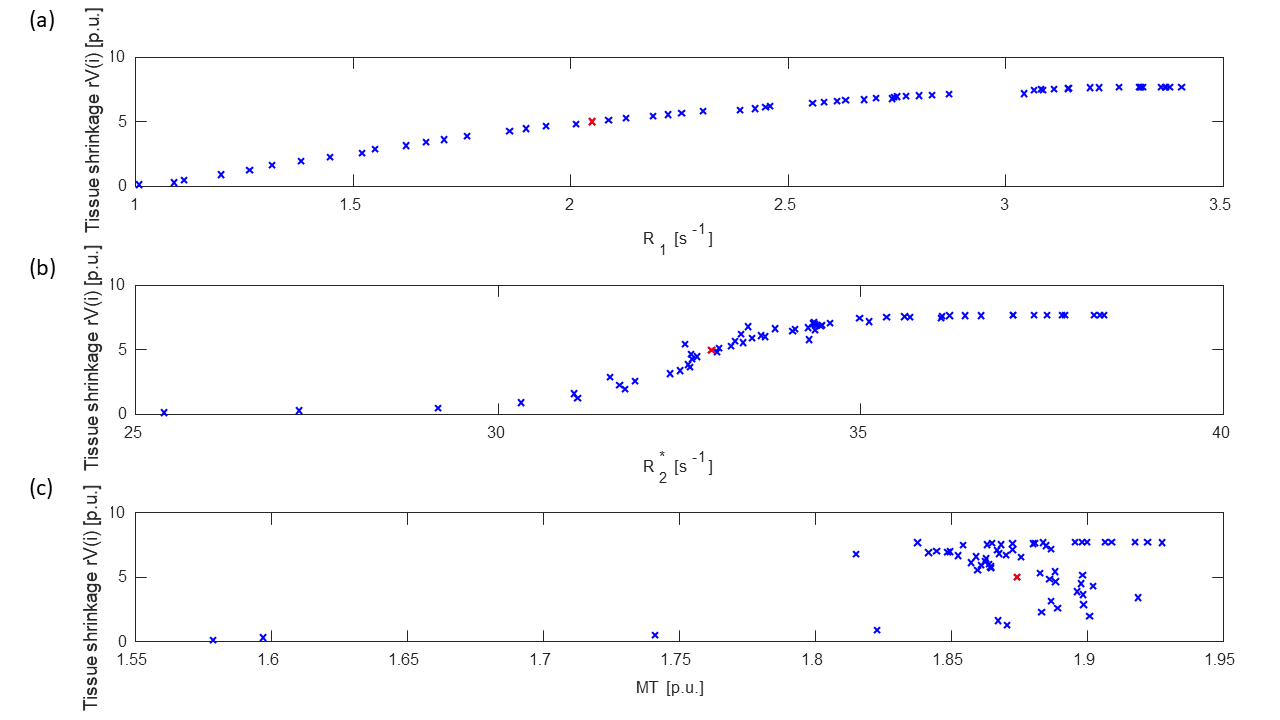
We determined volume of the in-situ brains and compared it to literature for in vivo human brains12. Subject 1 had a small brain (0.8l), the brain size of subject 2 (1.2l) was comparable to typical in vivo brains (1-1.5l). From our model, we estimated the relative tissue shrinkage ($$$7.7\pm 2\%$$$ at time point 126), the critical day ($$$T_c = 18$$$) and the radius decrement ($$$\delta=0.15\%$$$). The high tissue shrinkage values for the first brain on later time points (orange circles in Fig.3) have been identified as outliers (Fig.4). Figure 5 depicts the scatter plot of the temporal evolution of the quantitative MPMs against the estimated curve of relative tissue shrinkage. No apparent relation between MT and tissue shrinkage was observed, whereas $$$R_1$$$ and $$$R_2^*$$$ showed a continuous dependency on tissue shrinkage which saturated after the critical time $$$T_c = 18$$$ rapidely for $$$R_2^*$$$ and slowly for $$$R_1$$$.Discussion and Conclusion
In this work, two questions were answered: (1) What is the tissue shrinkage in human brains during fixation? (2) What is the relation between tissue shrinkage and changes in $$$R_1, R_2^*$$$, MT? To estimate tissue shrinkage due to fixation, we introduced a forward model for this phenomenon and found that shrinkage was $$$7.7\%$$$ of total brain volume. No apparent relation between changes in MT and tissue shrinkage were found, whereas it was remarkable for $$$R_1$$$ and $$$R_2^*$$$. One might speculate that the observed volume changes due to fixation occurred mainly in the extra-axonal space, because the shrinkage-sensitive $$$R_1$$$ and $$$R_2^*$$$ parameters would be sensitive to changes in the extra-cellular space while MT is more sensitive to the macromolecular space. To generalize our observations the tissue shrinkage of more brains need to be investigated.Acknowledgements
This project was funded by the ERA-NET NEURON (hMRI- ofSCI) and the Bundesministerium für Bildung und Forschung (BMBF; 01EW1711A and B) and the Deutsche Forschungsgemeinschaft (grant MO 2397/4-1) and the Forschungszentrums Medizintechnik Hamburg (fmthh; grant 01fmthh2017).References
1.
Mohammadi S, Carey D, Dick F, et al. Whole-Brain In-vivo Measurements of the
Axonal G-Ratio in a Group of 37 Healthy Volunteers. Front Neurosci 2015;9:441
doi: 10.3389/fnins.2015.00441.
2. Campbell JSW, Leppert IR, Narayanan S, et al.
Promise and pitfalls of g-ratio estimation with MRI. NeuroImage 2018;182:80–96
doi: 10.1016/j.neuroimage.2017.08.038.
3. Weiskopf N, Suckling J, Williams G, et al.
Quantitative multi-parameter mapping of R1, PD*, MT and R2* at 3T: a
multi-center validation. Front. Neurosci. 2013;7:95 doi:
10.3389/fnins.2013.00095.
4. Holmes HE, Powell NM, Ma D, et al. Comparison
of In Vivo and Ex Vivo MRI for the Detection of Structural Abnormalities in a
Mouse Model of Tauopathy. Frontiers in Neuroinformatics 2017;11 doi:
10.3389/fninf.2017.00020.
5. de Guzman AE, Wong MD, Gleave JA, Nieman BJ.
Variations in post-perfusion immersion fixation and storage alter MRI
measurements of mouse brain morphometry. Neuroimage 2016;142:687–695 doi:
10.1016/j.neuroimage.2016.06.028.
6. Thavarajah R, Mudimbaimannar V, Rao U,
Ranganathan K, Elizabeth J. Chemical and physical basics of routine
formaldehyde fixation. Journal of Oral and Maxillofacial Pathology 2012;16:400
doi: 10.4103/0973-029X.102496.
7. Fox CH, Johnson FB, Whiting J, Roller PP.
Formaldehyde fixation. J. Histochem. Cytochem. 1985;33:845–853 doi:
10.1177/33.8.3894502.
8. Birkl C, Langkammer C, Golob-Schwarzl N, et
al. Effects of formalin fixation and temperature on MR relaxation times in the
human brain: Formalin fixation MR relaxation mechanisms. NMR in Biomedicine
2016;29:458–465 doi: 10.1002/nbm.3477.
9. Lutti A, Stadler J, Josephs O, et al. Robust
and fast whole brain mapping of the RF transmit field B1 at 7T. PLoS ONE 2012;7:e32379
doi: 10.1371/journal.pone.0032379.
10. Frahm J, Haase A, Matthaei D. Rapid
three-dimensional MR imaging using the FLASH technique. J Comput Assist Tomogr
1986;10:363–368.
11. Friston KarlJ, Ashburner J, Frith CD, Poline
J-B, Heather JD, Frackowiak RSJ. Spatial registration and normalization of
images. Human Brain Mapping 1995;3:165–189 doi: 10.1002/hbm.460030303.
12. Lüders E, Steinmetz H, Jäncke L. Brain size
and grey matter volume in the healthy human brain. Neuroreport
2002;13:2371–2374 doi: 10.1097/01.wnr.0000049603.85580.da.
Figures