3161
Multi-compartment T1 relaxometry with inversion recovery sequence: a fat-water phantom study1Shenzhen Institutes of Advanced Technology,Chinese Academy of Sciences, Shenzhen, China
Synopsis
T1 relaxation time has been a valuable biomarker with emerging applications in cardiac diseases and liver function. Traditional inversion-recovery T1 quantification method is frequently applied as the reference for various T1 quantification methods. When applied in targets where fat and water signals co-exists, the single component fitting model would be in a dilemma. Combining the inversion-recovery T1 quantification with existing fat-water quantification methods, this work presented a solution for multi-component T1 quantification. Proposed method has been tested on fat-water phantoms and showed good consistency over a wide range of fat fractions.
Introduction
T1 relaxometry has been an important quantitative tool for tumor detection[1] and fibrosis stating[2]. However, when applied to the tissues with steatosis, the unwanted fat signal would hinder the measurement of tissue T1. In this work, the conventional inversion-recovery T1 measurement was combined with fat-water quantification methods[4] to remove the bias from short T1 fat signals and simultaneously evaluate the T1 relaxation time for fat and water components. Proposed method was validated in fat-water phantoms and showed good consistency under different fat-water ratios.Theory
$$$T_{1}$$$ relaxometry based on inversion recovery method with multiple inversion time can be formulated as:$$$S_{n}=|M_{0}(1-\alpha \cdot e^{-\tau_{n}/T_{1}}+e^{-TR/T_{1}})| (1)$$$
where Sn is the signal acquired at different inversion time τn; M0 is the initial magnetization; α stands for the actual inversion efficiency considering the imperfection of inversion pulse; T1 is the unknown longitudinal relaxation time; TR is the repetition time. When applied to organs such as liver or myocardium with fat infiltration, only an apparent T1 relaxation time could be derived through the original single component fitting model. To simultaneously estimate the longitudinal relaxation time for both fat and water component, the fitted model should be adjusted as follows:
$$$S_{n}=|M_{w}(1-\alpha_{w} \cdot e^{-\tau/T_{1,w}}+e^{-TR/T_{1,w}})+M_{f}(1-\alpha_{f} \cdot e^{-\tau/T_{1,f}}+e^{-TR/T_{1,f}})| (2)$$$
Mw and Mf was was the signal intensities contributed from water and fat component respectively; T1,w and T1,f were the longitudinal relaxation times for water and fat components; αw and αf was the inversion efficiency considering the imperfections of the 180° RF pulse for water and fat components respectively. Fat and water ratio could be evaluated by the existing proton density fat fraction (FF) quantification method prior to inversion-recovery scans, Eq.(2) can be converted to:
$$$S_{n}=M_{0}|(1-FF)\cdot(1-\alpha_{w} \cdot e^{-\tau/T_{1,w}}+e^{-TR/T_{1,w}})+FF\cdot(1-\alpha_{f} \cdot e^{-\tau/T_{1,f}}+e^{-TR/T_{1,f}})| (3)$$$
Materials and methods
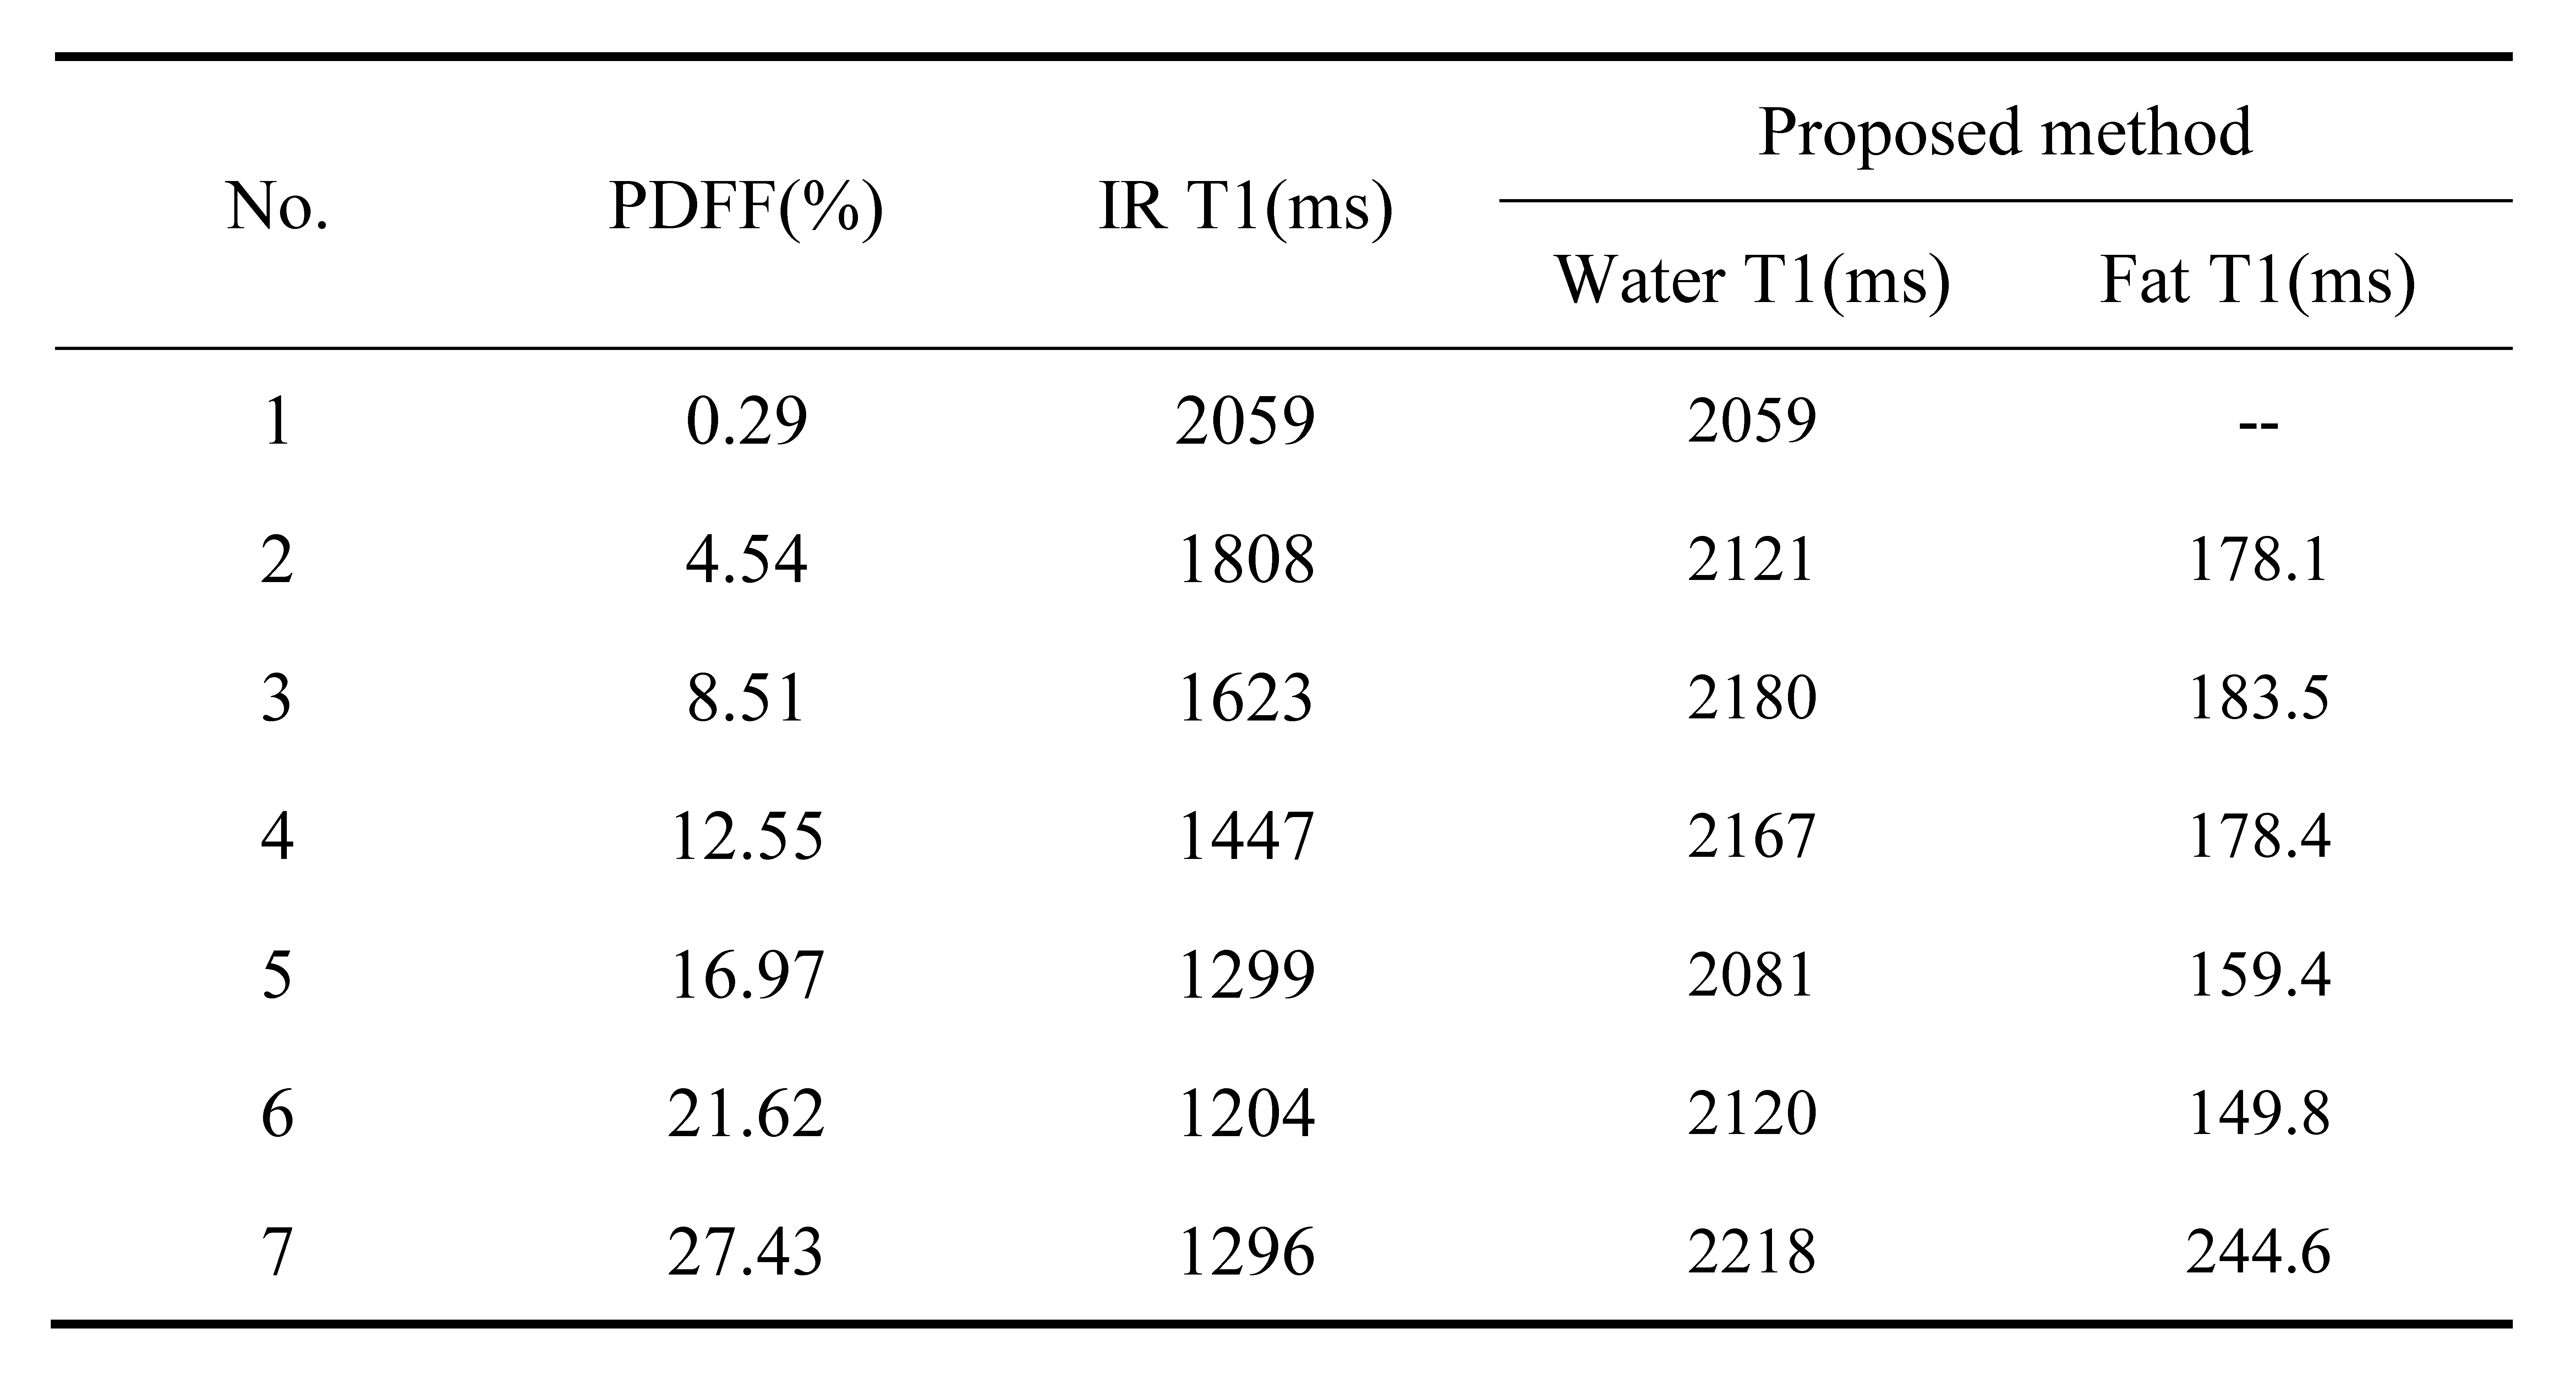
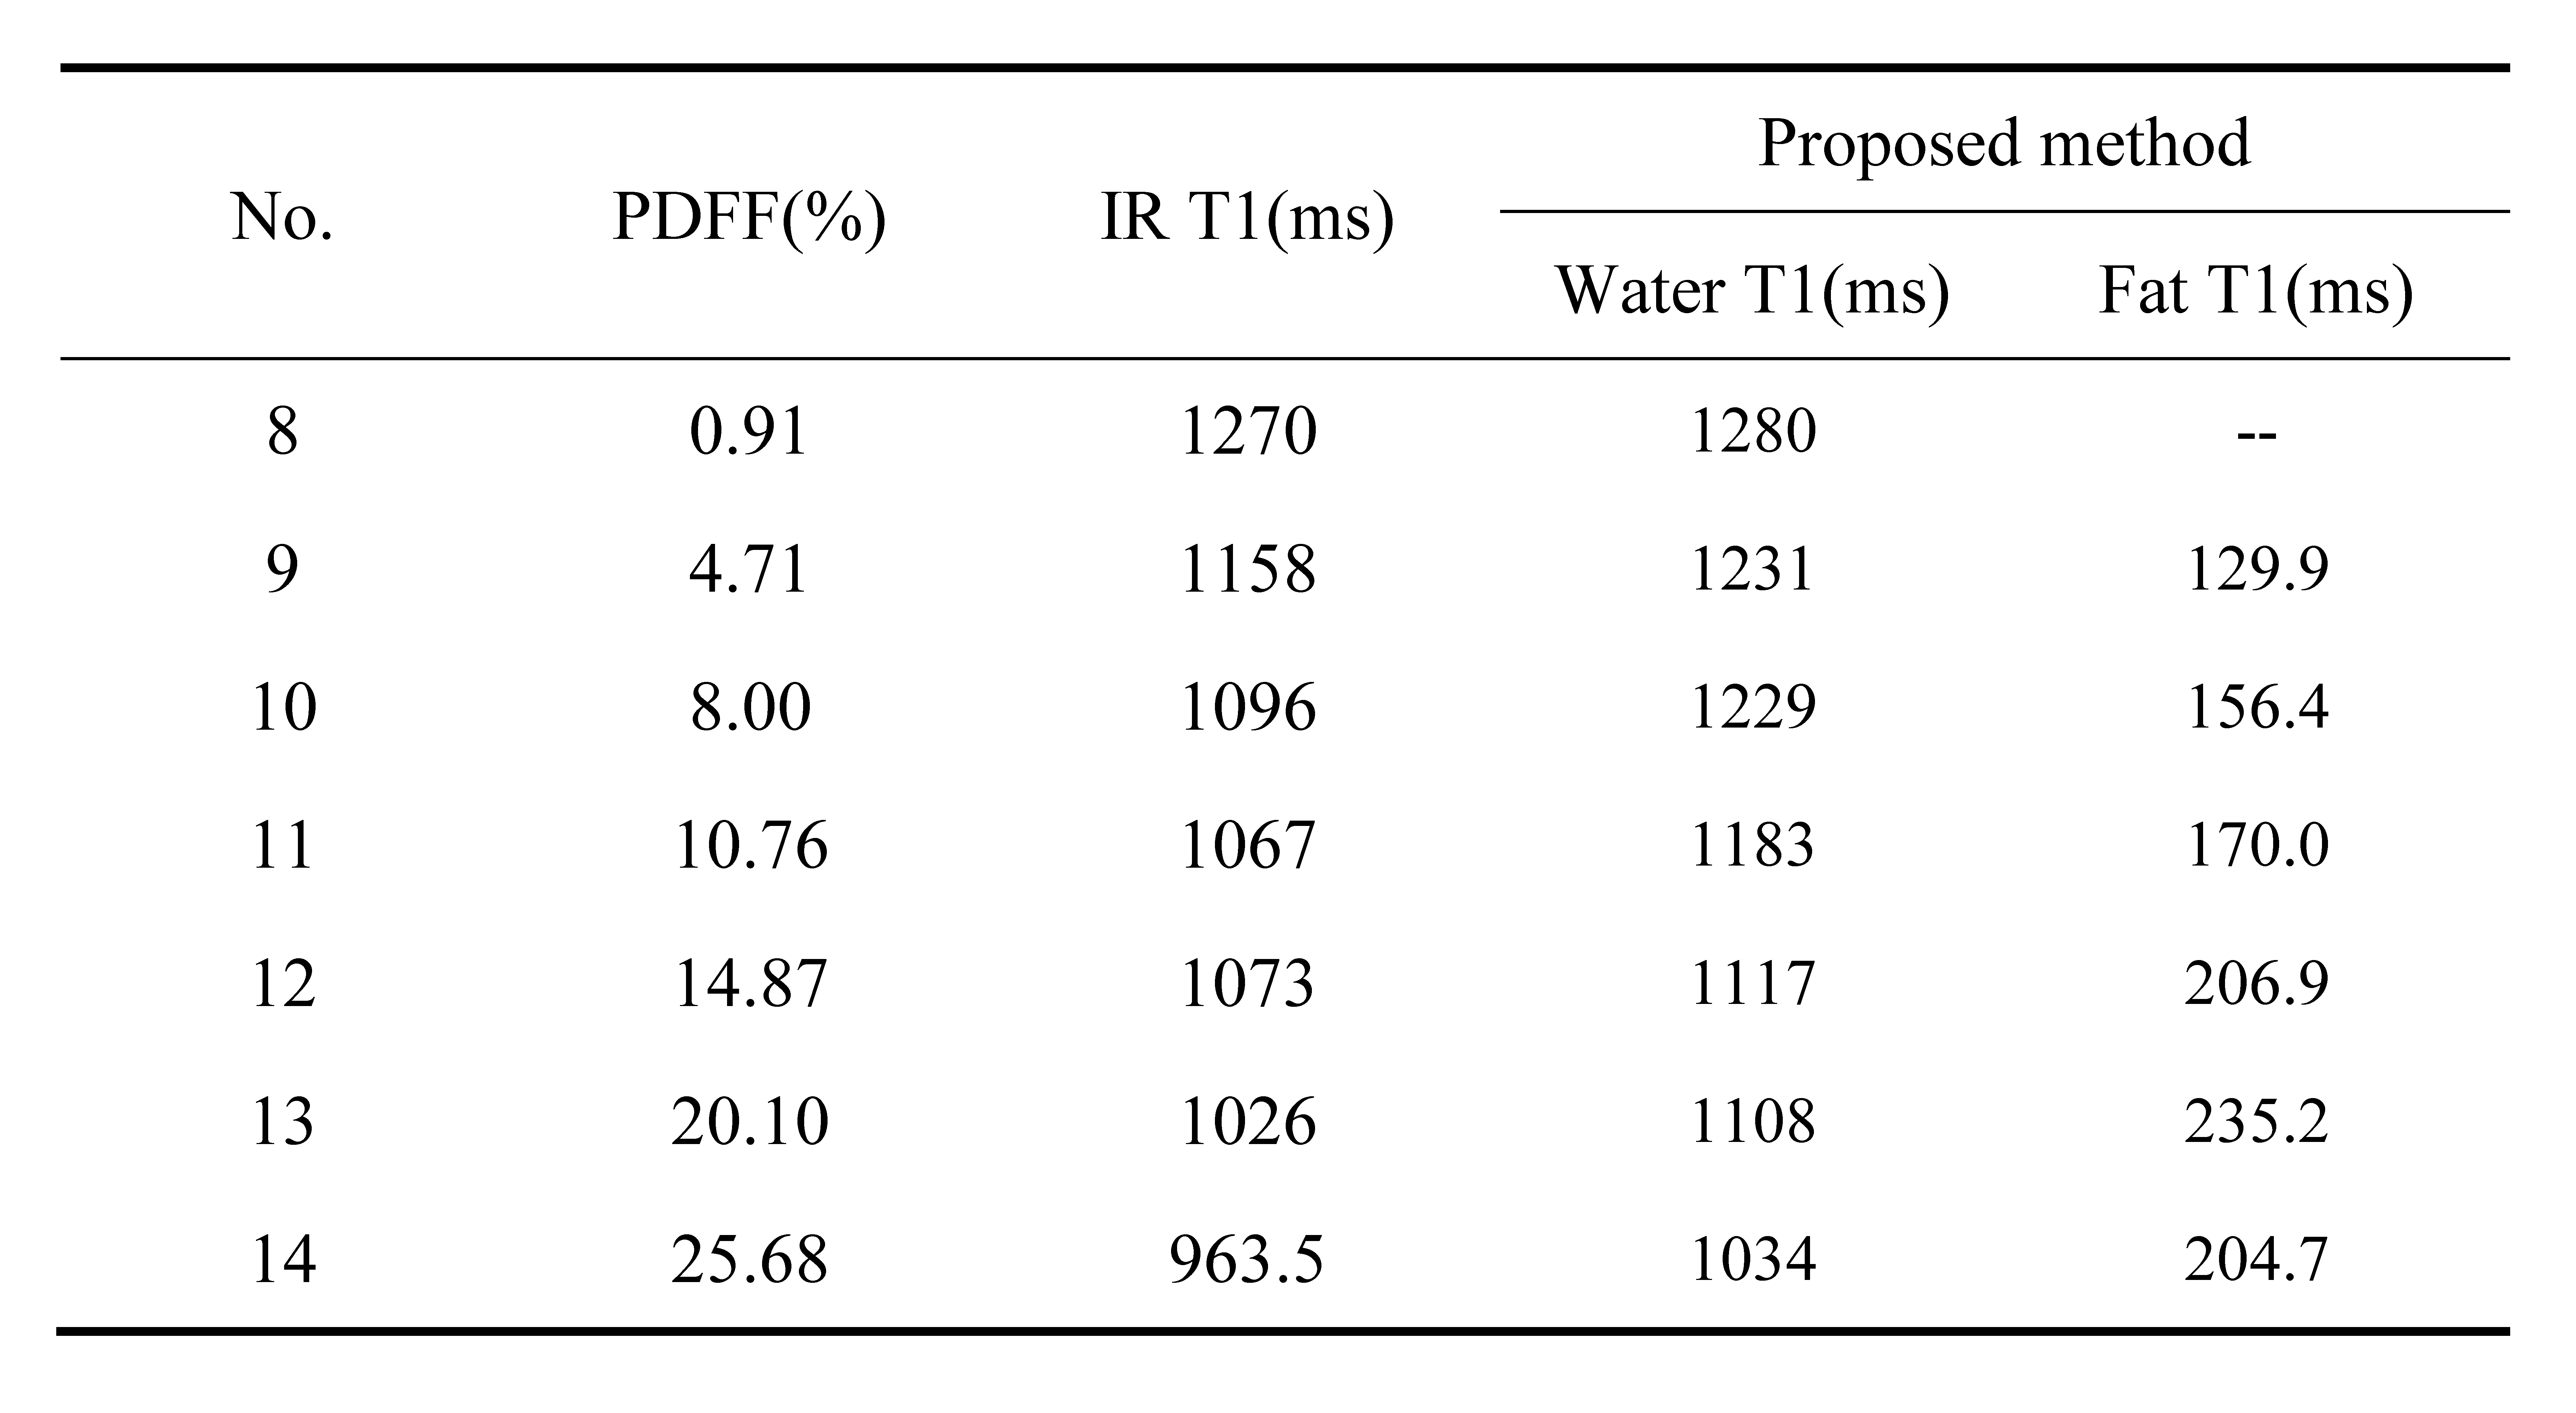
A series of fat-water phantoms was constructed to investigate the accuracy of proposed method. Fat-water phantoms #1-#7 was constructed according to ref.6 with FF ranged from 0 to 27.43%. A concentration of 0.05mmol/L gadolinium was dropped to phantoms #8-#14 with FF ranged from 0 to 25.68% to shorten the phantom T1. To evaluate the proton density fat fractions of these phantoms, a 2D multi-echo GRE sequence was scanned beforehand with TE = 2.43/4.11/5.79/7.47/9.15/10.83ms, flip angle = 2°, TR = 19ms. For inversion recovery T1 measurement, inversion time τ was set to 100ms, 600ms, 1100ms, 2100ms, and 2600ms, repetition time was 3000ms with fast spin echo sequence with TE = 8.62ms, and echo train length = 7.The first vial was constructed with no peanut oil and no gadolinium, so the conventional inversion recovery method was applicable and could be used as the reference for the T1 measurement of the water component. All phantoms were placed into scanning room for two hours before experiment so that the temperature could reach the room temperature. All scans were conducted on 3.0T MR system (uMR 790, Shanghai United Imaging Healthcare, Shanghai, China). The FF calculation was corrected to the temperature. The fitting was implemented in MATLAB (Math Works, Natick, MA) on a desktop computer.
Results
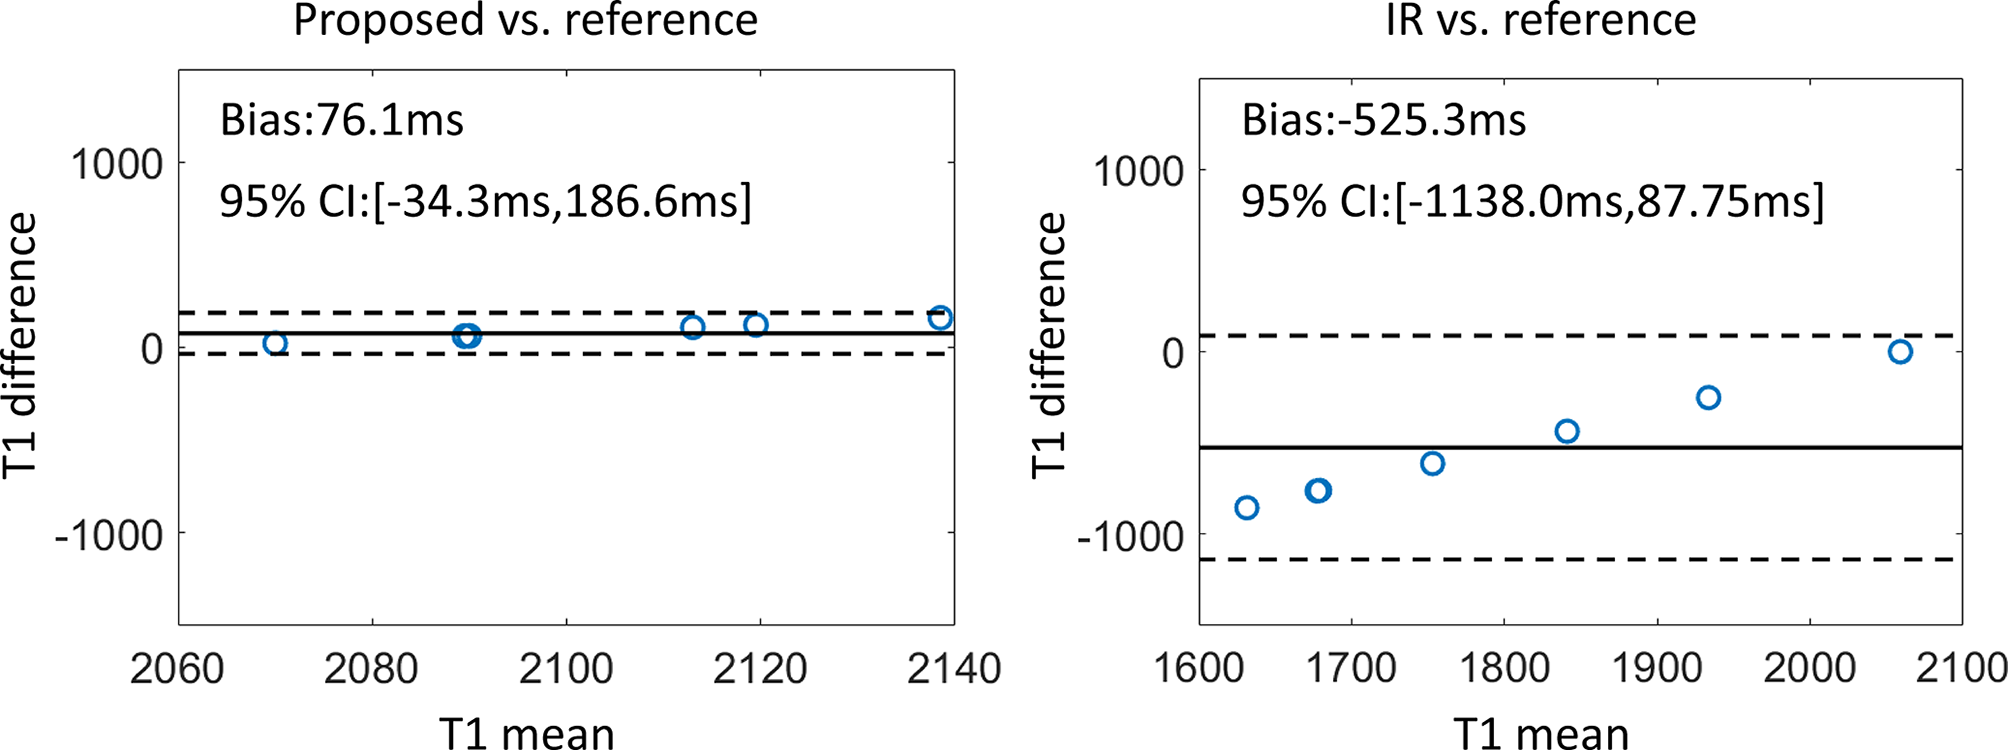
The proton density FF calculated for vial #1-#7 was 0.29%, 4.54%, 8.51%, 12.55%, 16.97%, 21.46%, 27.43%, respectively. T1 value calculated by proposed method and traditional single component fitting method for each vial was summarized in Tab.1. Compared to the #1 vial, the T1 values of the water component was stable regardless of the fat fraction using the multiple component method. Bland-Altman analyses for T1 calculated by these two methods were shown in Fig.1. Proposed method (bias: 76.1ms, 95% CI [-34.3ms, 186.6ms]) outperformed the single component methods (bias: -525.3ms, 95% CI [-1138.0ms, 87.75ms]).The proton density FF calculated for vial #8-#14 was 0.91%, 4.71%, 8.00%, 10.76%, 14.87%, 20.10%, 25.68%, respectively. The calculated T1 values were compared between the single component and multiple component methods, and listed in Tab.2.
Discussion and conclusions
In this work, the conventional inversion-recovery T1 measurement was combined with fat-water quantification method to overcome the confounding factor from fat signal to T1 measurement using a multiple component model. Proposed multiple component method showed good consistency in measuring water T1 despite the existence of fat signal and might be useful for T1 evaluation in organs with fat infiltration.The limitation of the study is that we only used the phantom without fat as reference. However, the fat content itself might have effect on the T1 relaxation time of the water component, which can be found in the both tables. With the increase of fat content, the deviation of the T1 values to the phantom without fat becomes larger. Thus, further validation should be considered using the spectroscopic method[7] in the future.
Acknowledgements
No acknowledgement found.References
[1]. Hollis Donald P et al., Nuclear magnetic resonance studies of several experimental and human malignant tumors. Cancer Research. 1973;33(9): 2156-2160.
[2]. Taylor Andrew J et al., T1 mapping: basic techniques and clinical applications. JACC: Cardiovascular Imaging. 2016;9(1): 67-81.
[3]. Pykett IL et al., Measurement of spinlattice relaxation times in nuclear magnetic resonance imaging. Phys Med Biol 1983;28(6):723–729.
[4]. Peng H, Zou C, Cheng C, et al. Fat-water separation based on Transition Region Extraction (TREE). Magn Reson Med. 2019;82(1):436–448.
[5]. Cheng C, Zou C, et al. Fat-water separation using a region-growing algorithm with self-feeding phasor estimation. Magn Reson Med. 2017;77(6):2390–2401.
[6]. Bernard, Clare P., et al. Comparison of fat quantification methods: a phantom study at 3.0 T. J Magn Reson Imaging. 2008;27(1): 192-197.
[7]. Hamilton, Gavin, et al. In vivo breath-hold 1H MRS simultaneous estimation of liver proton density fat fraction, and T1 and T2 of water and fat, with a multi-TR, multi-TE sequence. J Magn Reson Imaging 2015:42(6): 1538-1543.
Figures